MIS775 - Portfolio Optimization using LP, ILP & NLP Decision Models

Verified

Added on  2023/06/13

|22
|1262
|286
Project
AI Summary
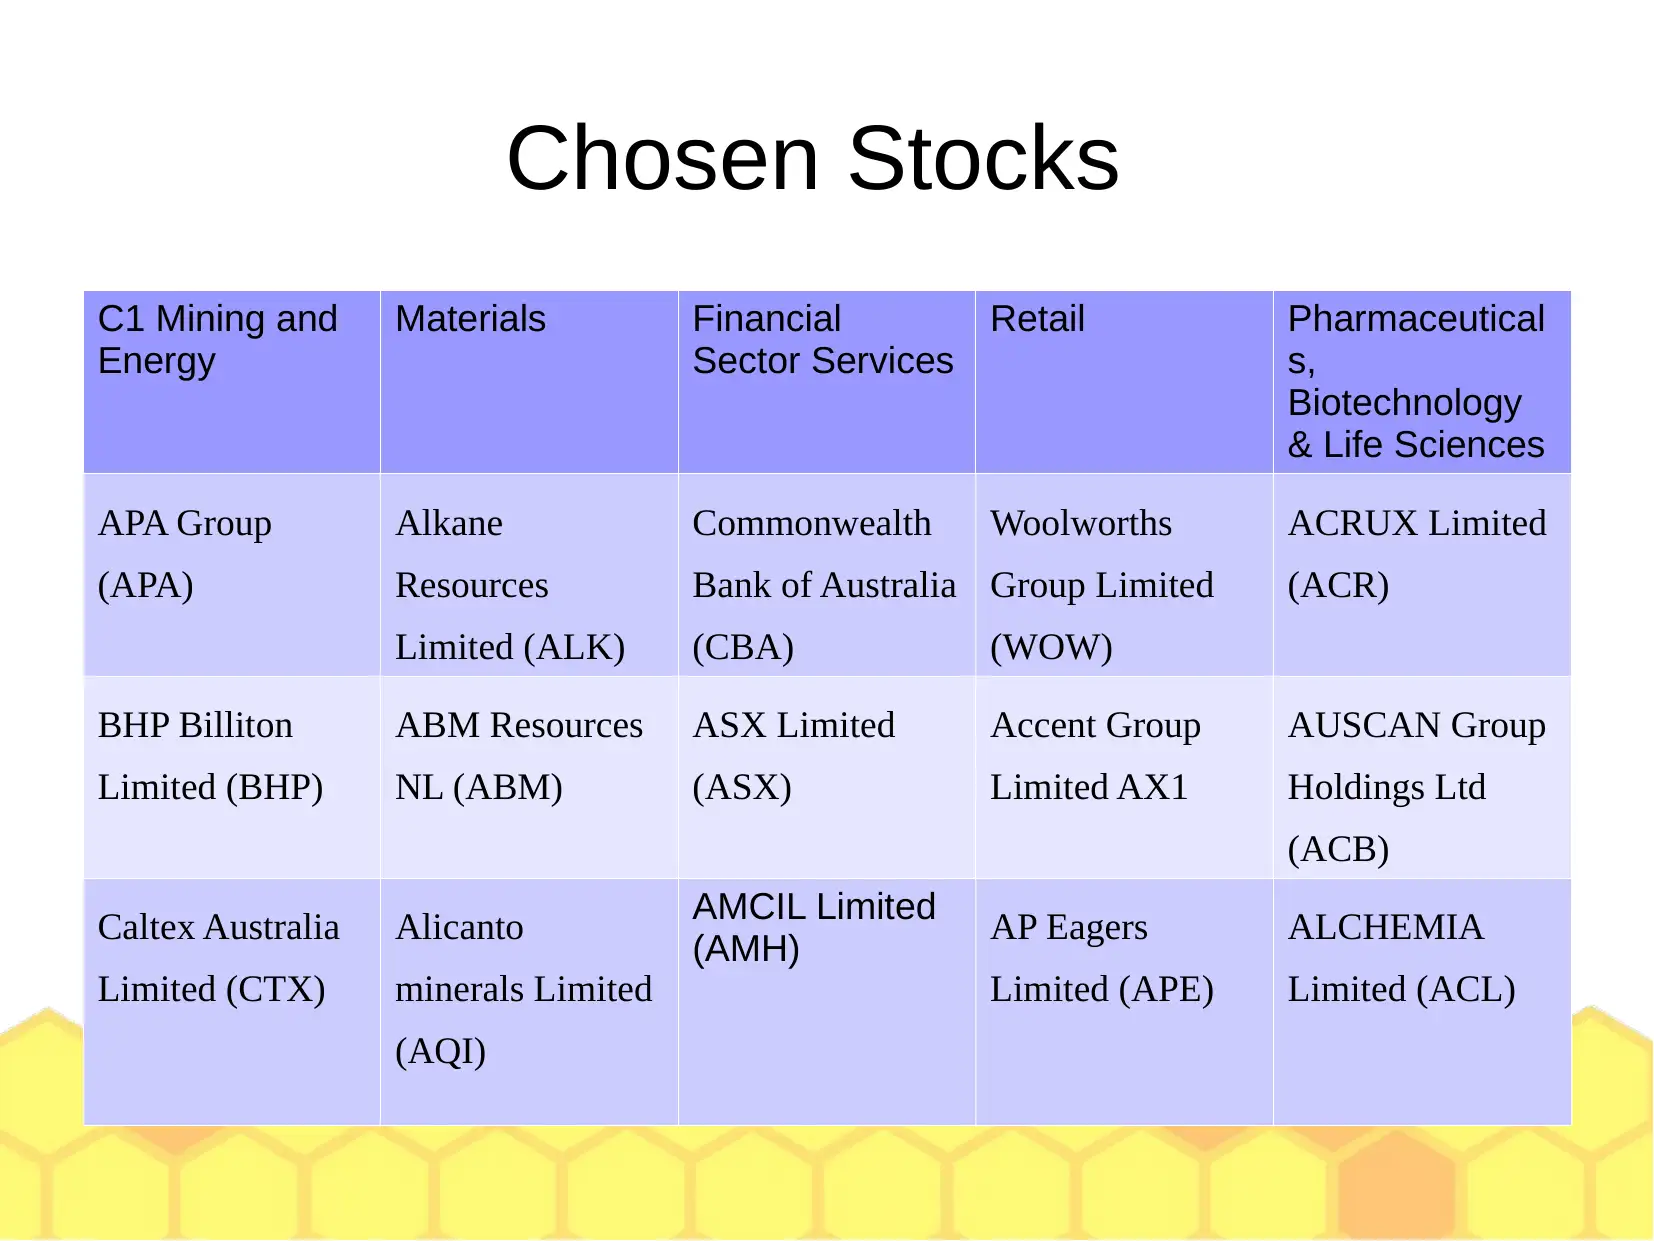
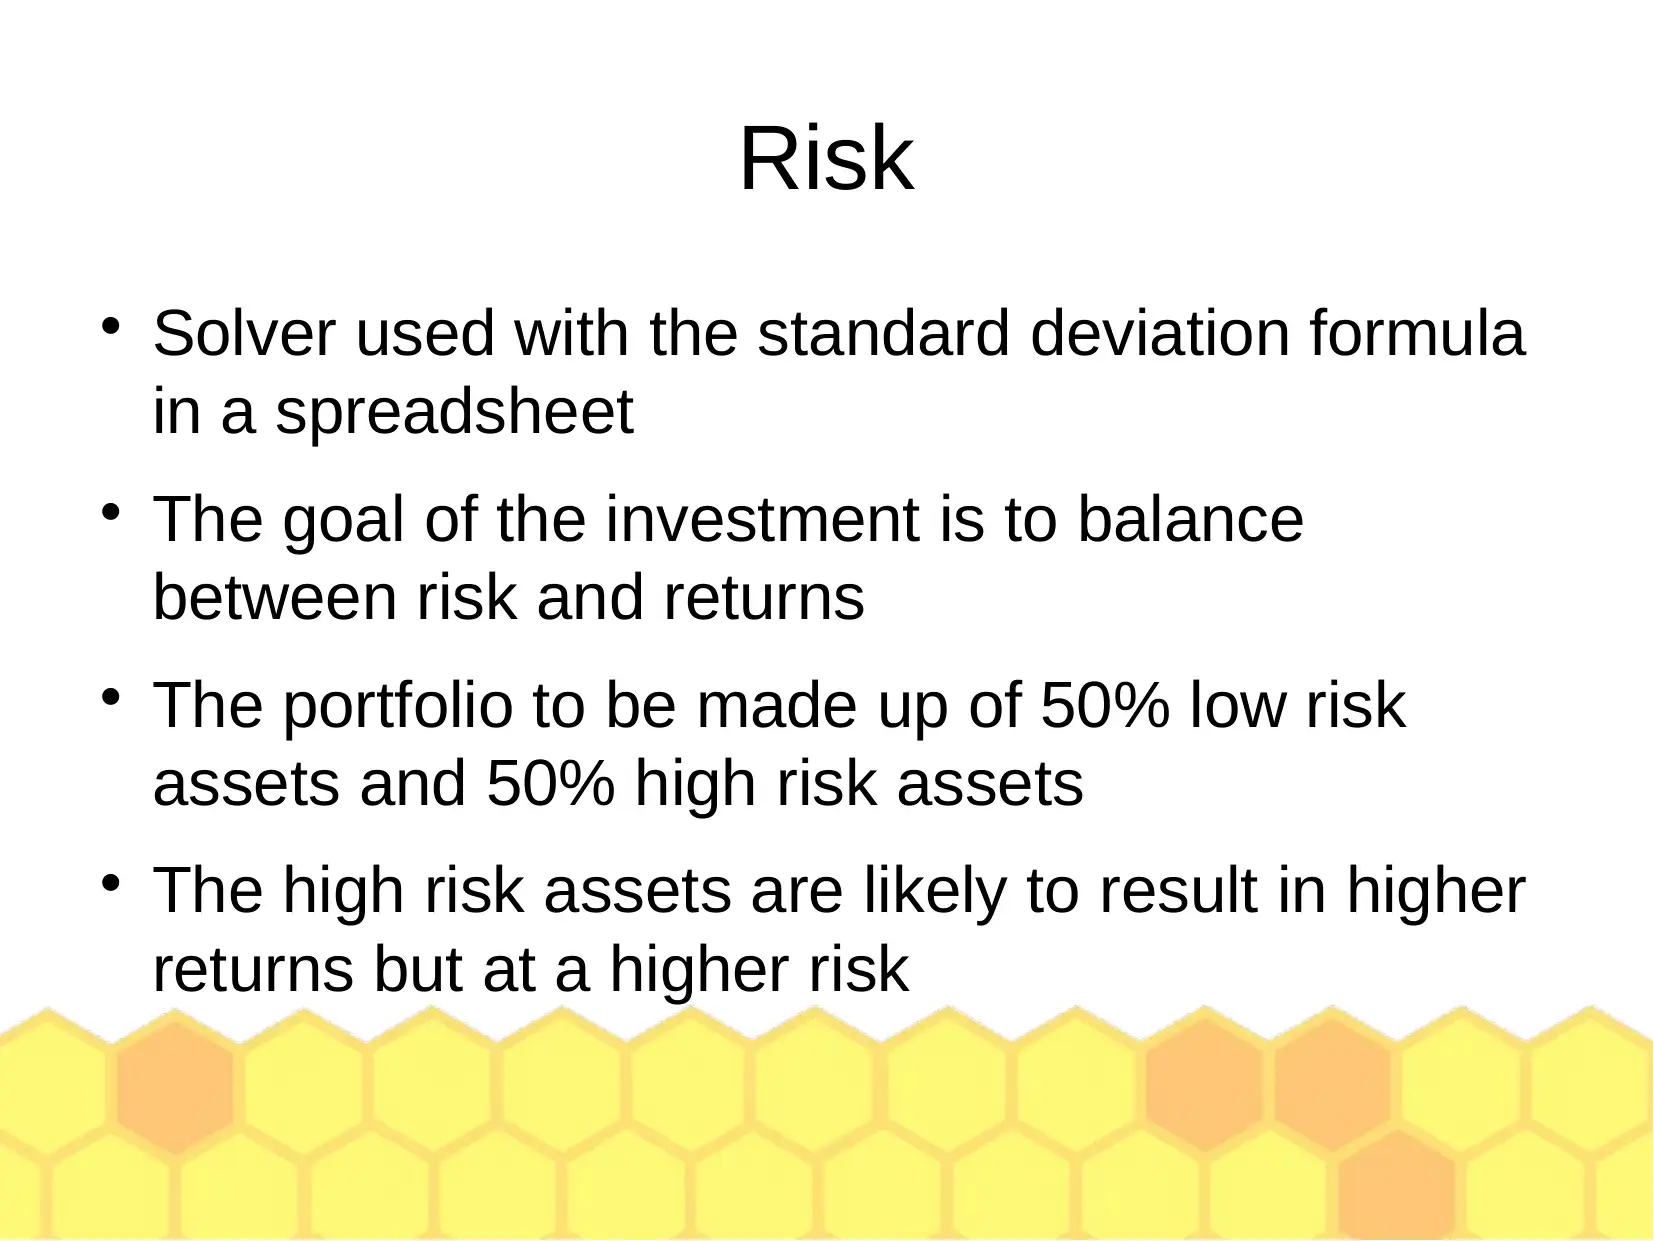
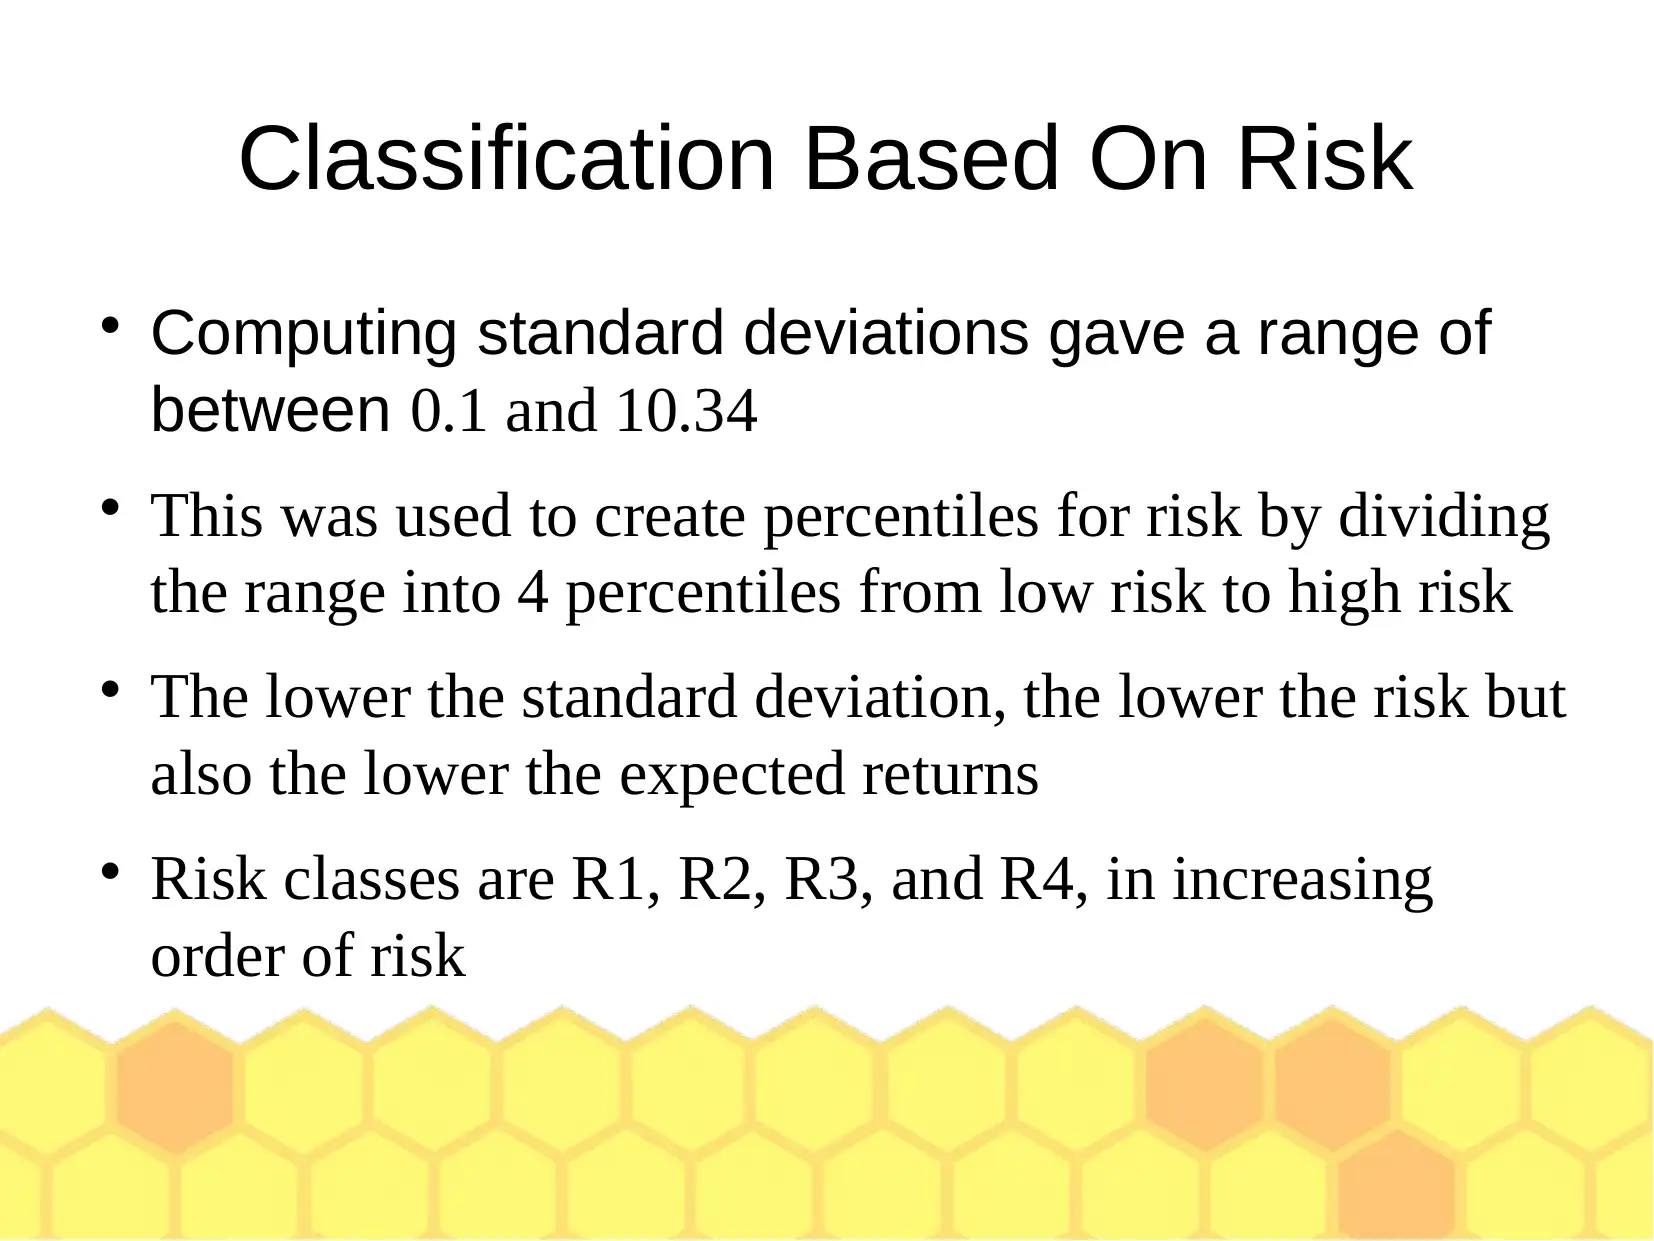
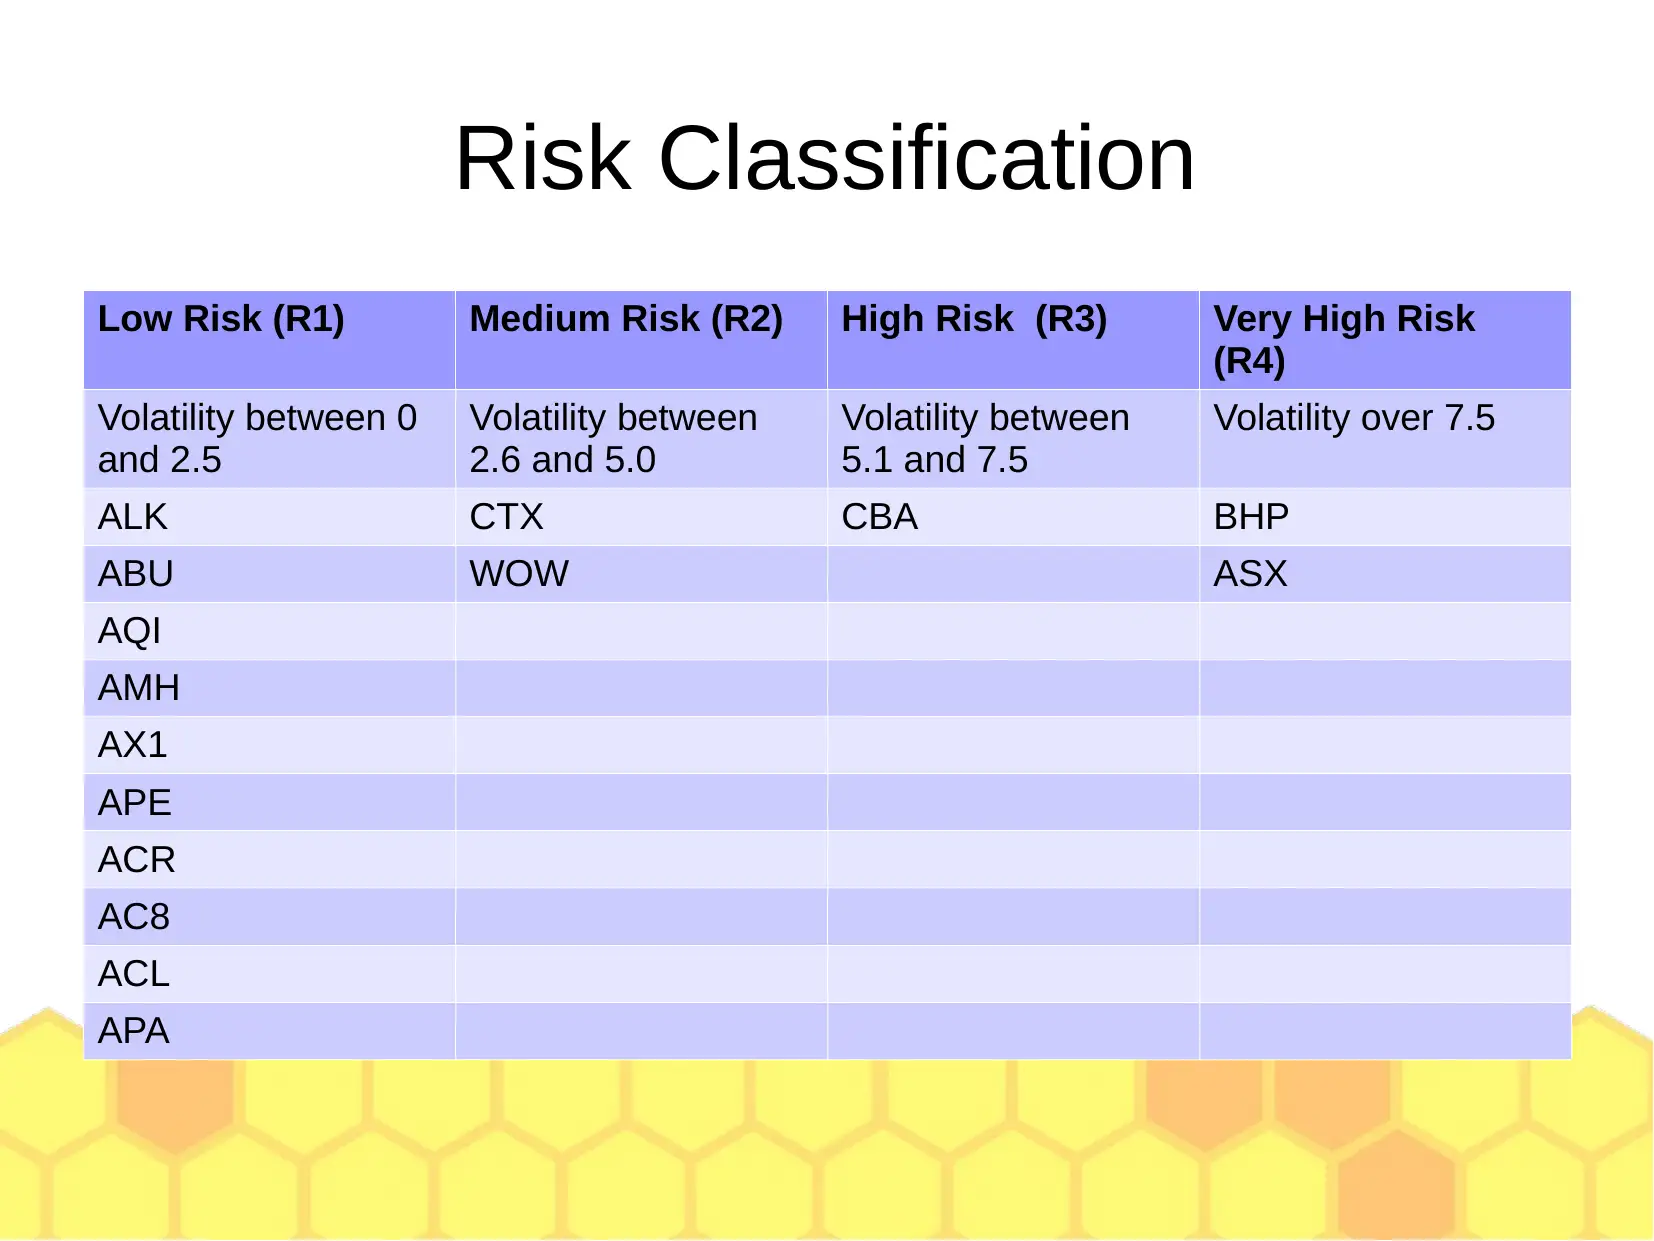
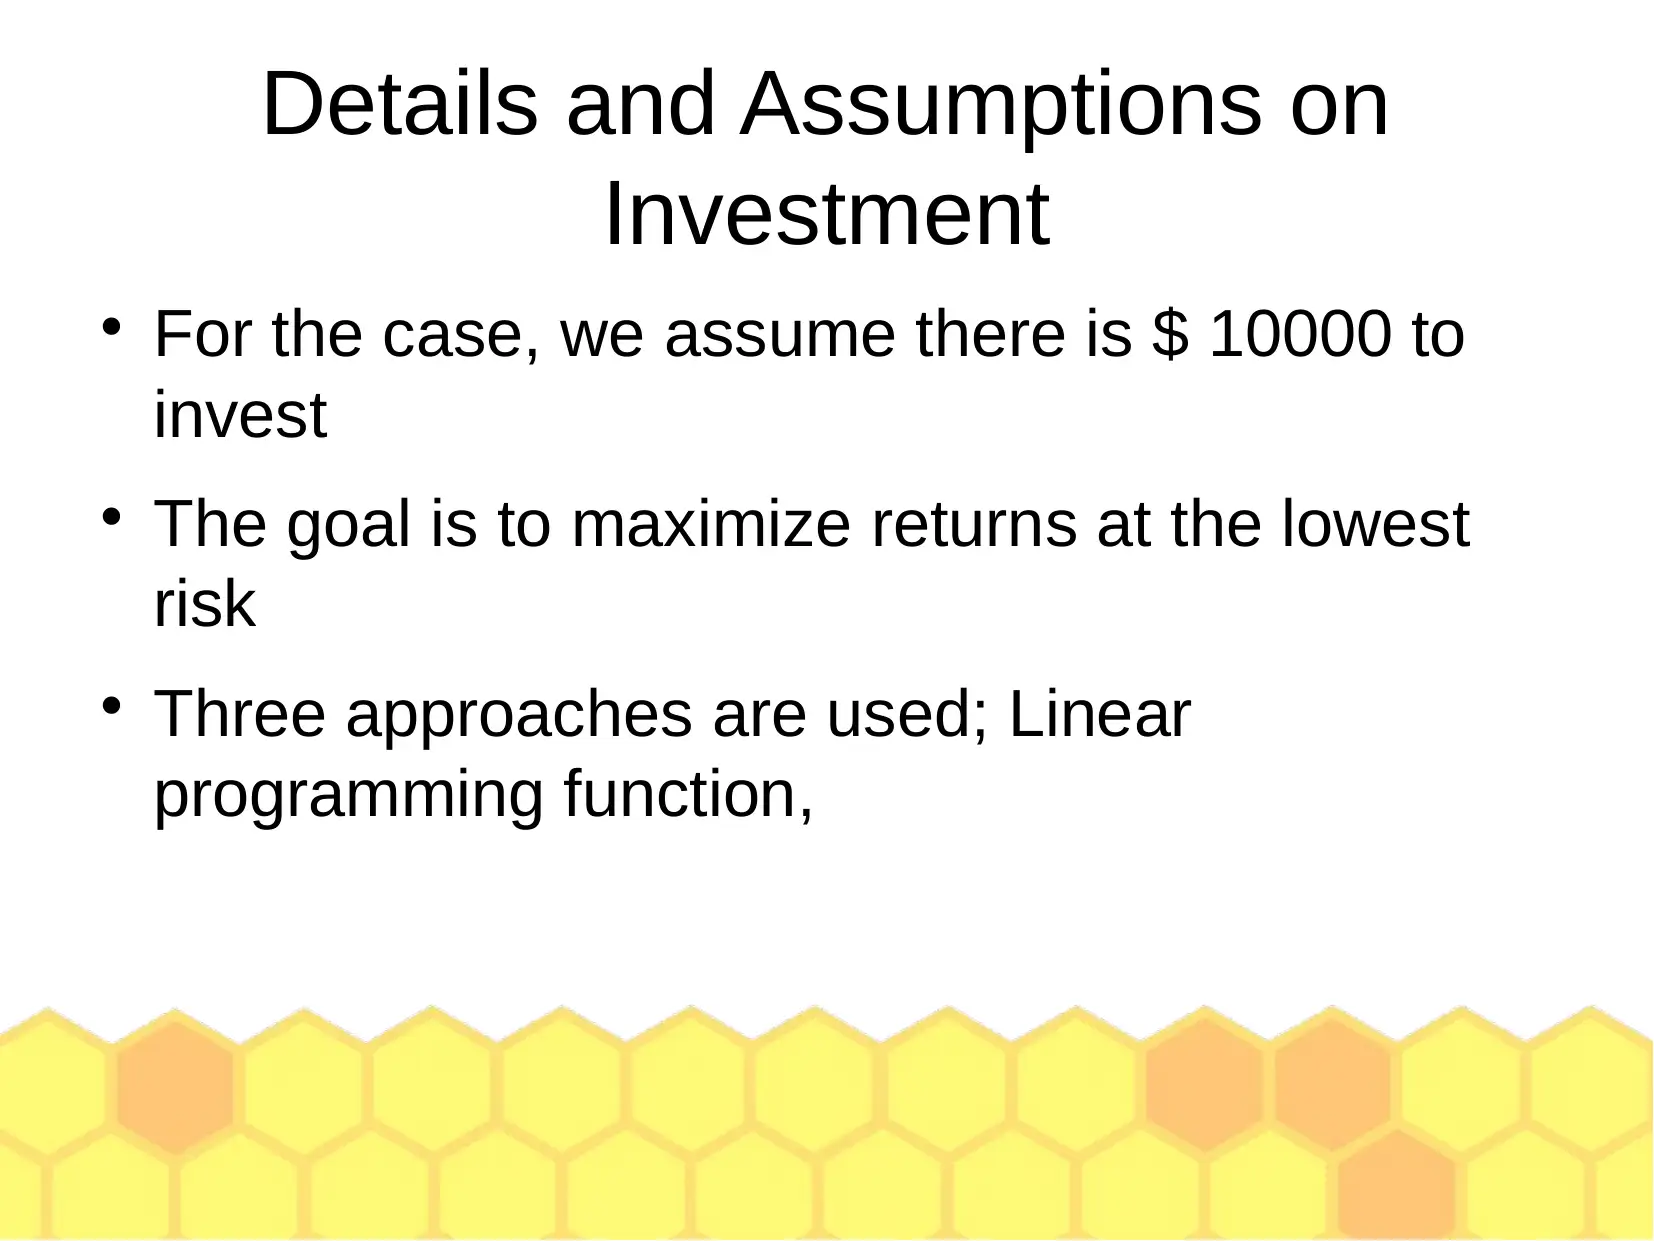
This project evaluates 15 stocks from the ASX (Australian Stock Exchange) using Linear Programming (LP), Integer Linear Programming (ILP), and Non-Linear Programming (NLP) models to optimize an investment portfolio. The securities are chosen based on asset class restrictions, individual risk appetites, portfolio size constraints, and required returns. Stocks are classified into industries like Mining and Energy, Materials, Financial Sector, Retail, and Pharmaceuticals, Biotechnology, and Life Sciences, and further categorized by risk levels determined by historical performance data and volatility. The investment goal is to balance risk and returns, with a portfolio comprising 50% low-risk and 50% high-risk assets. The LP model maximizes returns subject to constraints on investment amounts in each risk class, while the ILP model requires a minimum number of stocks from the least and most risky categories. The NLP model uses a variance/covariance matrix to optimize the portfolio. The project concludes with a discussion on the advantages and challenges of each method, favoring the linear model for its ease of use in obtaining the optimum solution.
Document Page
DECISION MODELS FOR
BUSINESS ANALYTICS
[Name]
[Date]
tabler-icon-diamond-filled.svg

Paraphrase This Document

Need a fresh take? Get an instant paraphrase of this document with our AI Paraphraser
Document Page
Introduction
15 stocks from the ASX (Australian Stock Exchange) are
evaluated using the LP model, the ILP model, and the
NLP model as approaches in optimizing the portfolio
The securities are chosen according to restrictions of
asset classes and individual risk appetites
The securities are also chosen according to the portfolio
size restrictions and risk appetite, as well as based on
portfolio risk and the required return
Document Page
Introduction
Preliminary work done by choosing and
classifying securities into industries and
according to risk
Stocks chosen from mining and energy (C1),
Materials (C2), Financial Sector (C3), Retail
(C4), and Pharamaceuticals, Biotechnology and
Life Sciences (C5)
The Stocks are then classified based on Risk
Document Page
Chosen Stocks
C1 Mining and
Energy
Materials Financial
Sector Services
Retail Pharmaceutical
s,
Biotechnology
& Life Sciences
APA Group
(APA)
Alkane
Resources
Limited (ALK)
Commonwealth
Bank of Australia
(CBA)
Woolworths
Group Limited
(WOW)
ACRUX Limited
(ACR)
BHP Billiton
Limited (BHP)
ABM Resources
NL (ABM)
ASX Limited
(ASX)
Accent Group
Limited AX1
AUSCAN Group
Holdings Ltd
(ACB)
Caltex Australia
Limited (CTX)
Alicanto
minerals Limited
(AQI)
AMCIL Limited
(AMH) AP Eagers
Limited (APE)
ALCHEMIA
Limited (ACL)
tabler-icon-diamond-filled.svg

Paraphrase This Document

Need a fresh take? Get an instant paraphrase of this document with our AI Paraphraser
Document Page
Classification Based on Risk
The risk levels for each was is determined by historical
performance data
Data was collected on a monthly basis (average monthly
stock prices) for the past 48 months
The volatility of the stock determined its risk
Volatility computed as a function of standard deviation of
the stock performance
Standard deviation for each stock computed using data
from past 48 months
Document Page
Risk
Solver used with the standard deviation formula
in a spreadsheet
The goal of the investment is to balance
between risk and returns
The portfolio to be made up of 50% low risk
assets and 50% high risk assets
The high risk assets are likely to result in higher
returns but at a higher risk
Document Page
Classification Based On Risk
Computing standard deviations gave a range of
between 0.1 and 10.34
This was used to create percentiles for risk by dividing
the range into 4 percentiles from low risk to high risk
The lower the standard deviation, the lower the risk but
also the lower the expected returns
Risk classes are R1, R2, R3, and R4, in increasing
order of risk
tabler-icon-diamond-filled.svg

Paraphrase This Document

Need a fresh take? Get an instant paraphrase of this document with our AI Paraphraser
Document Page
Risk Classification
Low Risk (R1) Medium Risk (R2) High Risk (R3) Very High Risk
(R4)
Volatility between 0
and 2.5
Volatility between
2.6 and 5.0
Volatility between
5.1 and 7.5
Volatility over 7.5
ALK CTX CBA BHP
ABU WOW ASX
AQI
AMH
AX1
APE
ACR
AC8
ACL
APA
Document Page
Details and Assumptions on
Investment
For the case, we assume there is $ 10000 to
invest
The goal is to maximize returns at the lowest
risk
Three approaches are used; Linear
programming function,
Document Page
Part 1: LP
Done in a spreadsheet using solver
The first step entailed giving each of the stocks
values based on risk profile (volatility)
Low risk are denoted L, medium risk are denoted
M, high risk are denoted H, and very high risk
are denoted V
An objective function is then created based on
the expected returns and the risk appetite
tabler-icon-diamond-filled.svg

Paraphrase This Document

Need a fresh take? Get an instant paraphrase of this document with our AI Paraphraser
Document Page
LP
The objective function is subject to some
constraints
That L+M+H+V must be less than or equal to $
10000
The target of investment is to spread out risk but
have a chance for highest returns
Each asset risk class will have no more than $
2500 invested
Document Page
LP
The other condition therefore is that L+M+H+V
must be equal to or less than 2500
The objective is to maximize revenue
The trivial constraints are that L+M+H+V must
be greater than or equal to 0
The target yield is one that is above 4.3%, which
is the average annual yield of the ASX based on
48 months yield data
chevron_up_icon
1 out of 22
circle_padding
hide_on_mobile
zoom_out_icon
[object Object]