Numeracy & Data Analysis: Forecasting Transportation Expenses - LSC

Verified

Added on  2022/12/14

|11
|1346
|452
Report
AI Summary
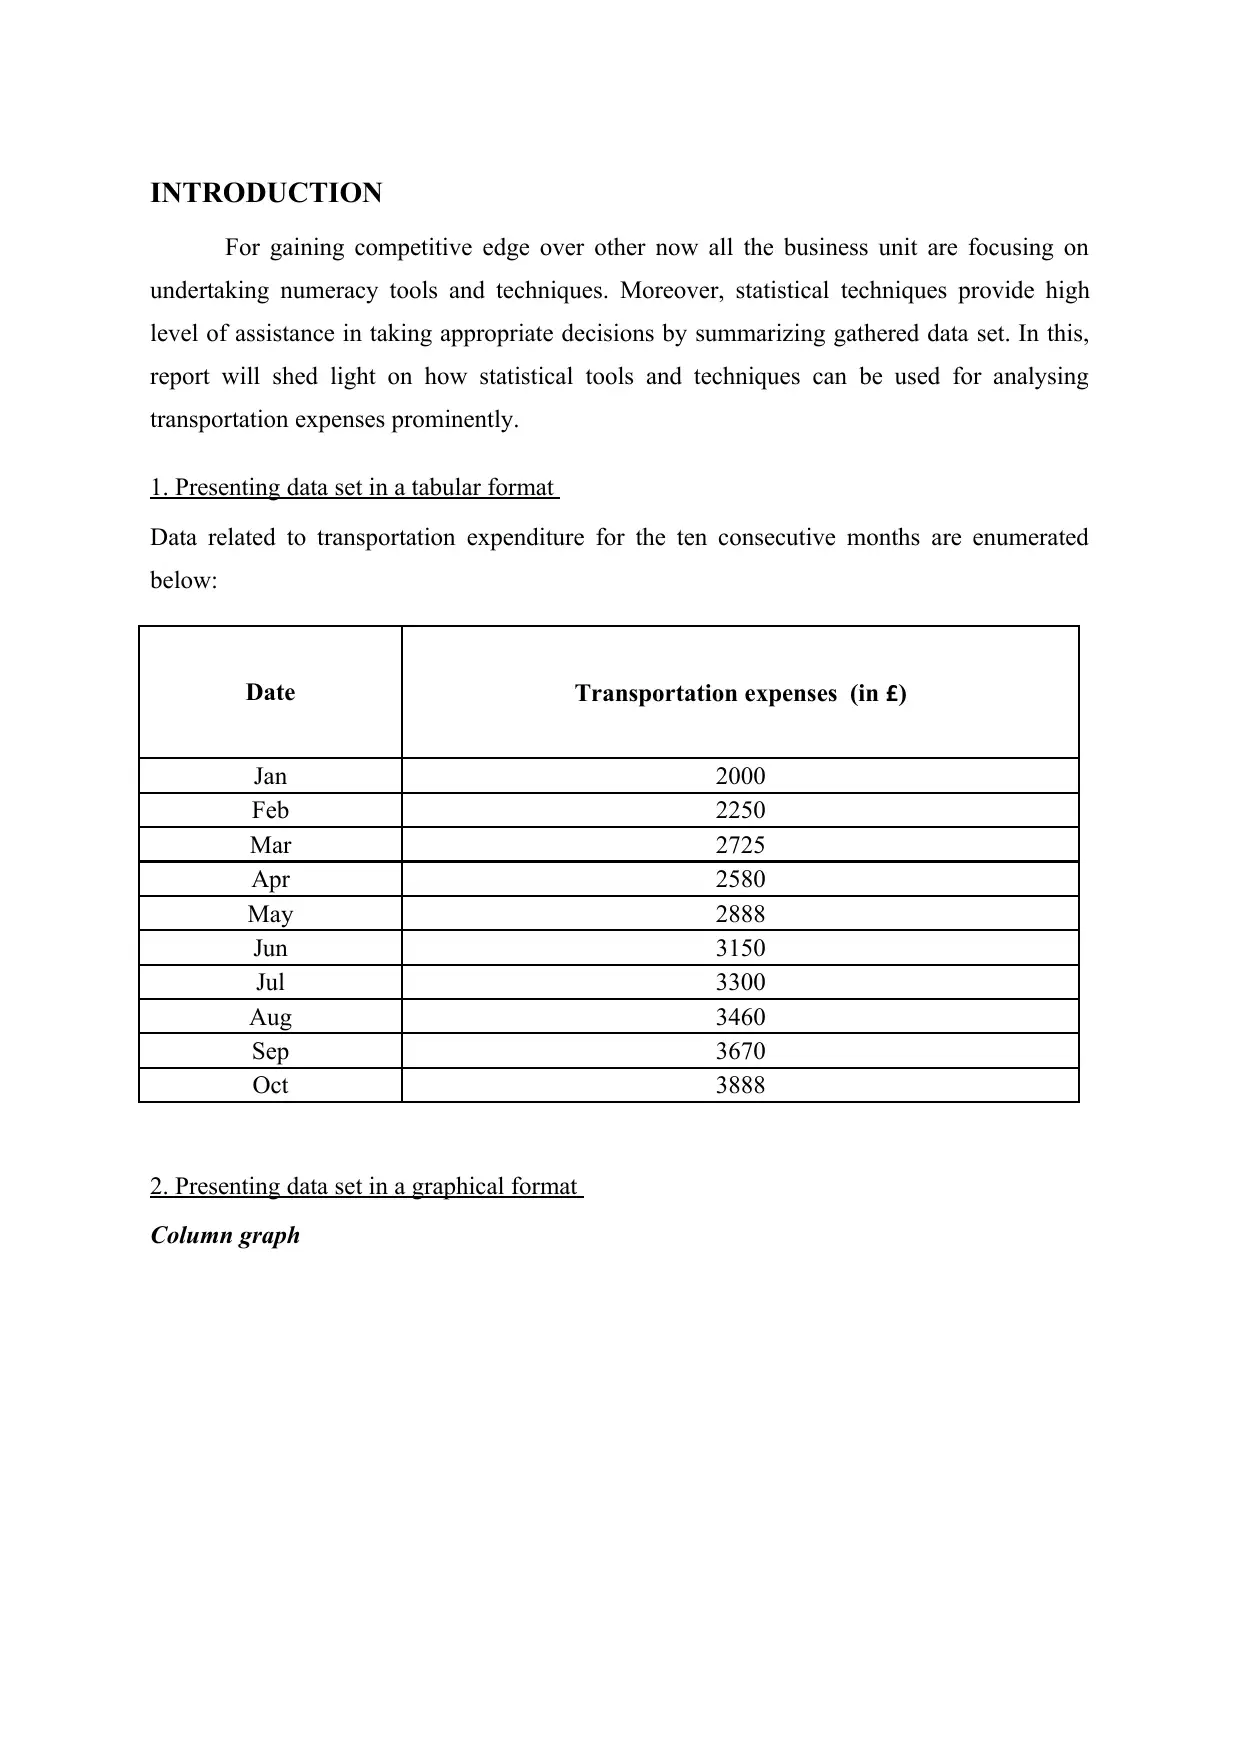
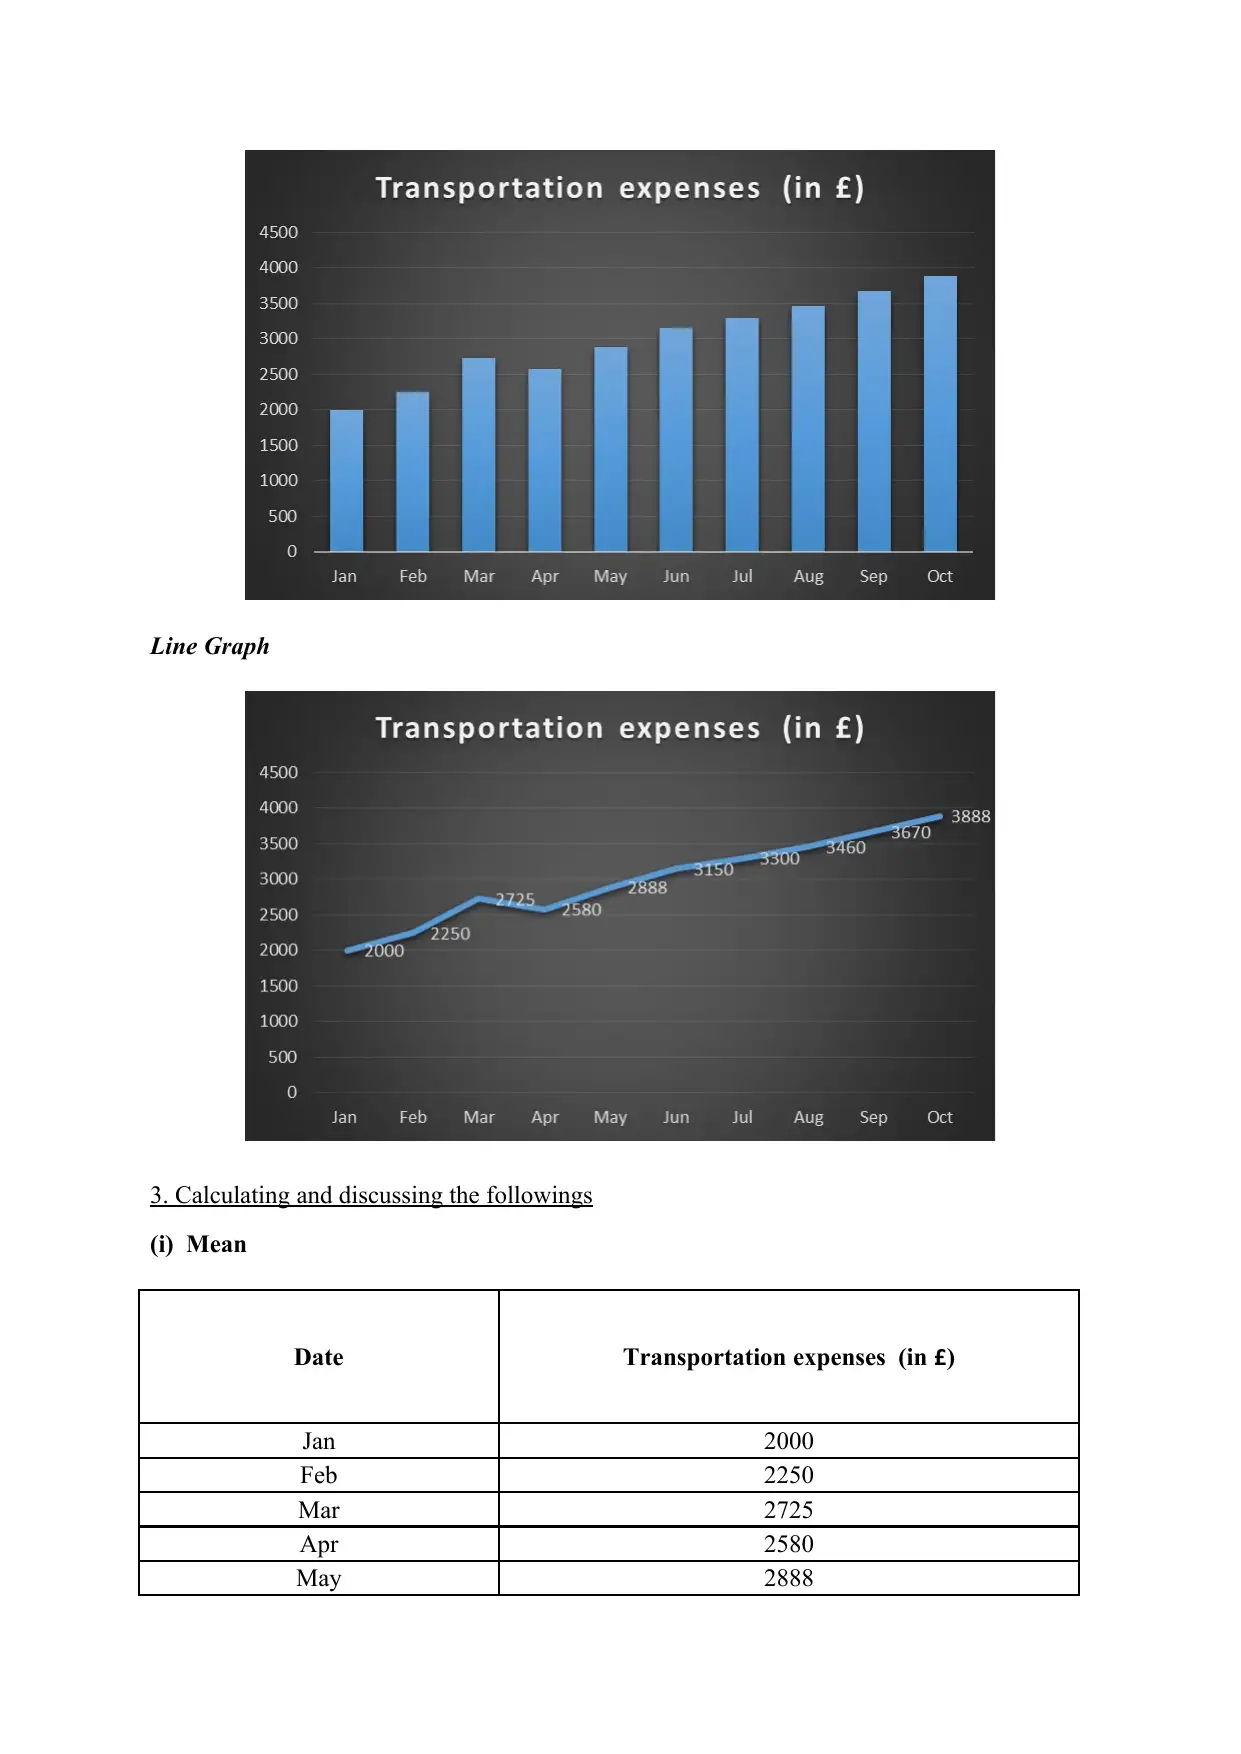
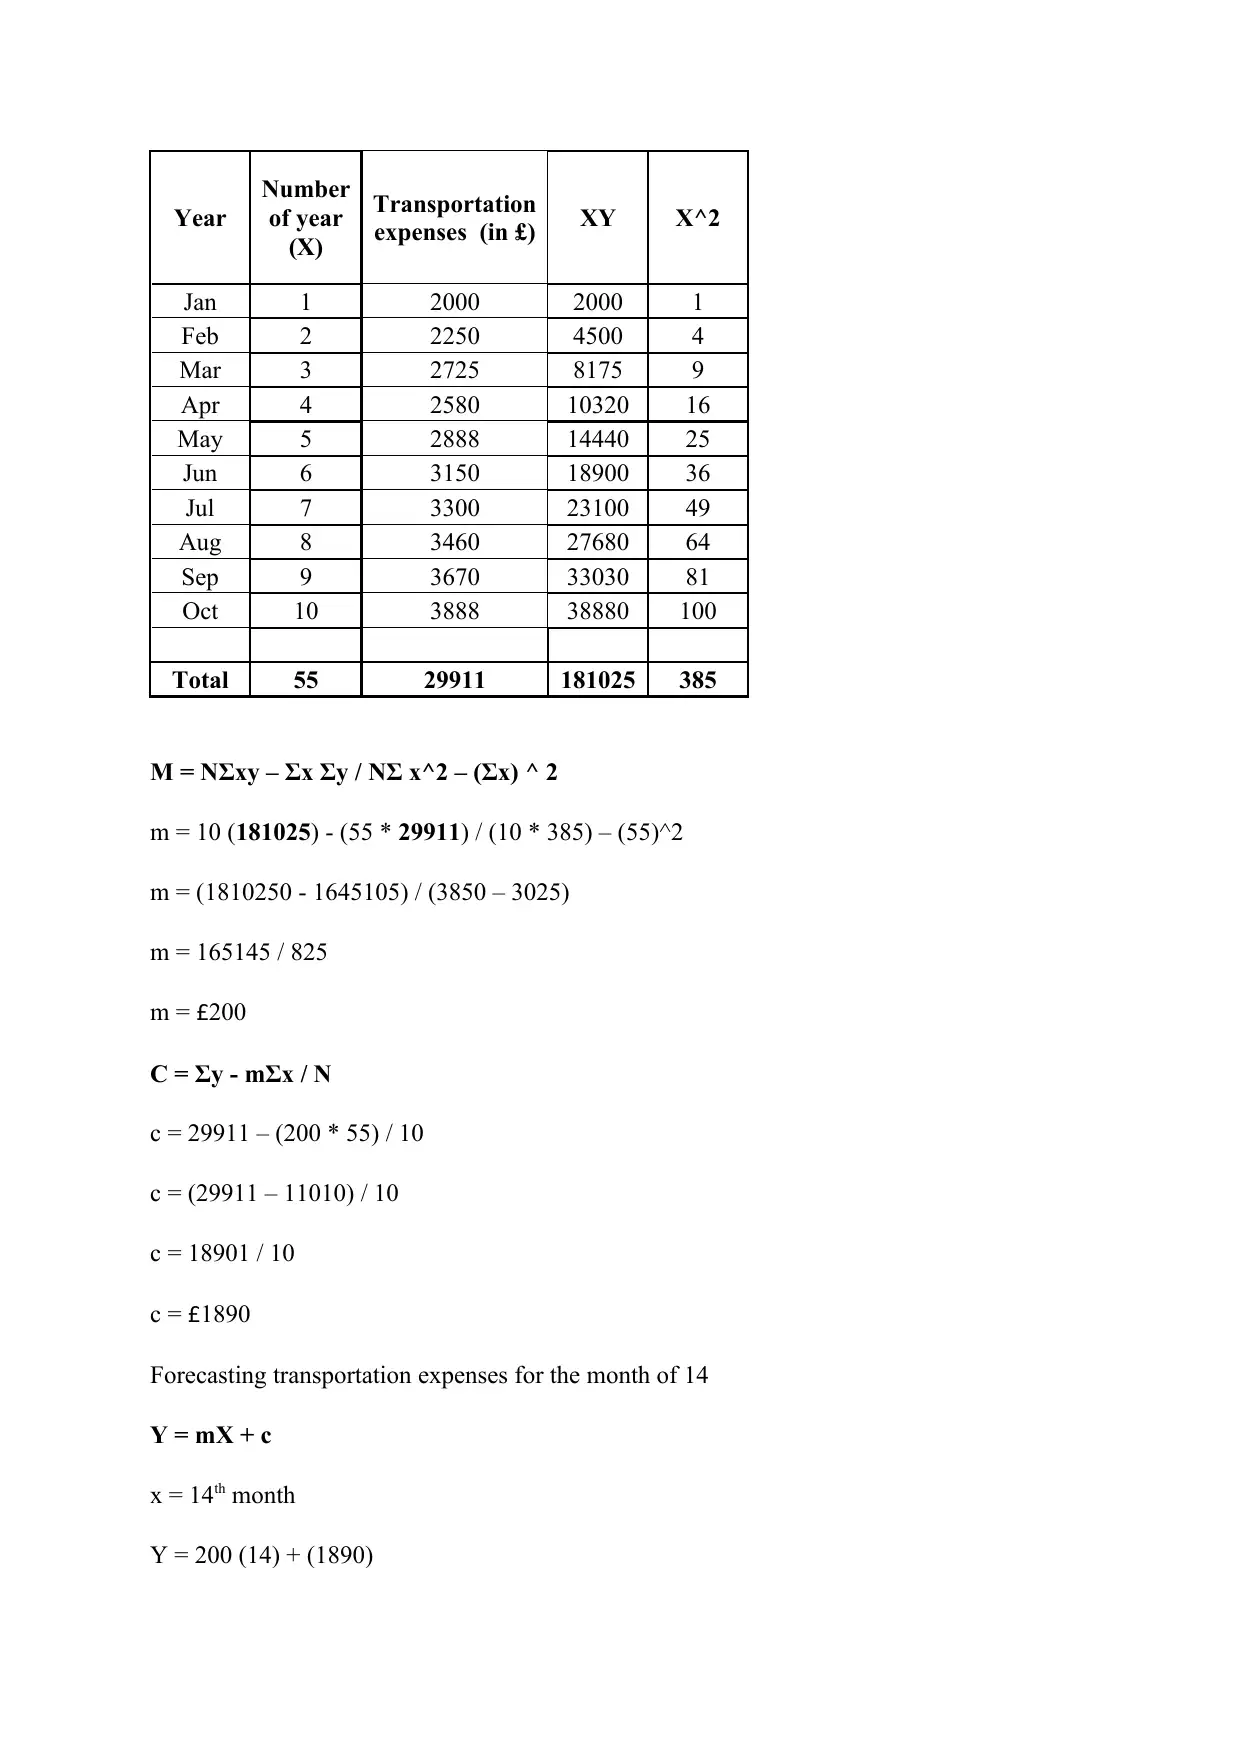
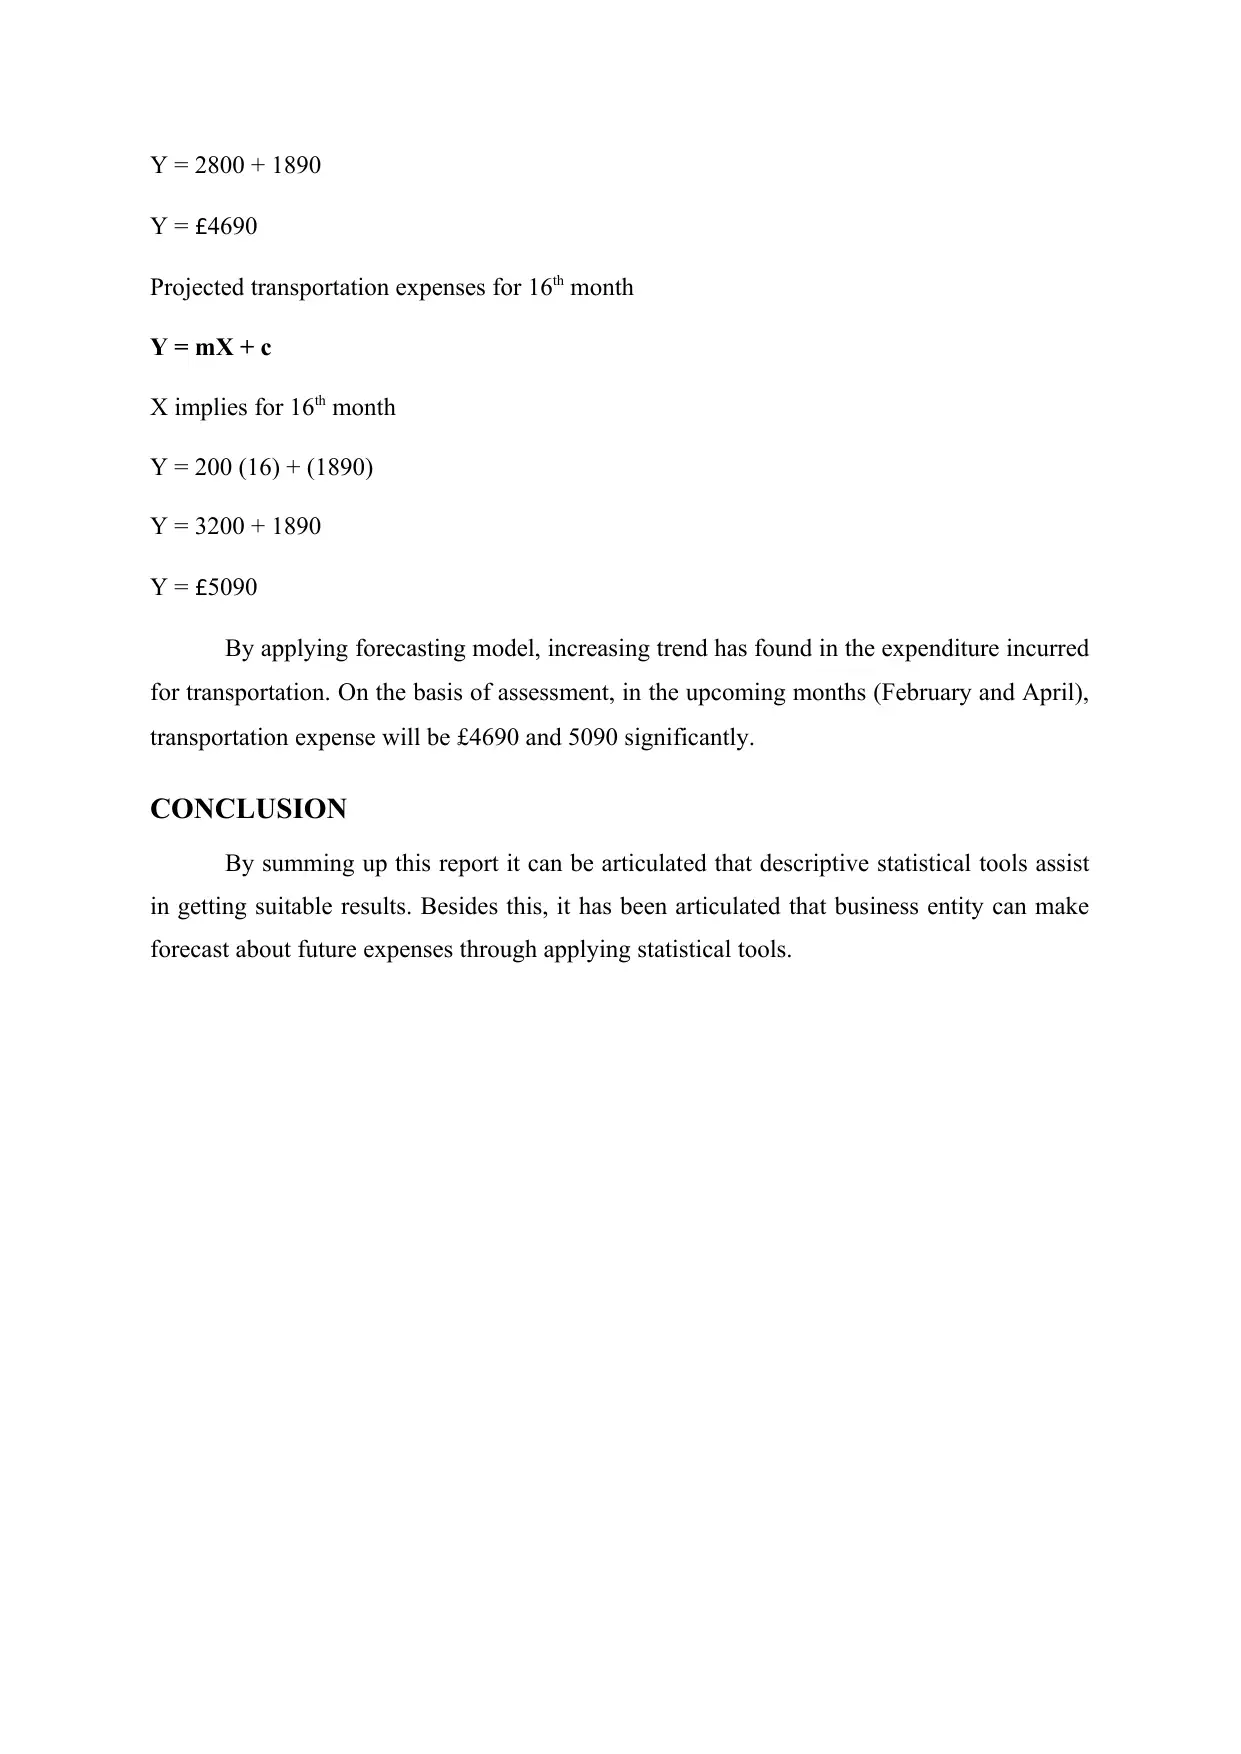
This report provides a comprehensive analysis of transportation expenses using various statistical tools and forecasting techniques. It begins by presenting a dataset of transportation expenditures over ten consecutive months in both tabular and graphical formats. The report then calculates and discusses key statistical measures, including mean, median, mode, range, and standard deviation. Furthermore, it employs a linear forecasting model (y = mx + c) to predict future transportation expenses, outlining the steps involved in calculating the 'm' and 'c' values. The report concludes by forecasting transportation expenses for the 14th and 16th months, revealing an increasing trend in expenditure. This document is available on Desklib, a platform offering a wide array of study resources and solved assignments for students.
Document Page
NUMERACY AND DATA ANALYSIS
tabler-icon-diamond-filled.svg

Paraphrase This Document

Need a fresh take? Get an instant paraphrase of this document with our AI Paraphraser
Document Page
TABLE OF CONTENTS
INTRODUCTION......................................................................................................................3
1. Presenting data set in a tabular format...............................................................................3
2. Presenting data set in a graphical format...........................................................................3
3. Calculating and discussing the followings.........................................................................4
4. Discuss the followings: using the linear forecasting model which is y = mx + c along
with the steps..........................................................................................................................8
CONCLUSION........................................................................................................................10
REFERENCES.........................................................................................................................11
Document Page
INTRODUCTION
For gaining competitive edge over other now all the business unit are focusing on
undertaking numeracy tools and techniques. Moreover, statistical techniques provide high
level of assistance in taking appropriate decisions by summarizing gathered data set. In this,
report will shed light on how statistical tools and techniques can be used for analysing
transportation expenses prominently.
1. Presenting data set in a tabular format
Data related to transportation expenditure for the ten consecutive months are enumerated
below:
Date Transportation expenses (in £)
Jan 2000
Feb 2250
Mar 2725
Apr 2580
May 2888
Jun 3150
Jul 3300
Aug 3460
Sep 3670
Oct 3888
2. Presenting data set in a graphical format
Column graph
Document Page
Line Graph
3. Calculating and discussing the followings
(i) Mean
Date Transportation expenses (in £)
Jan 2000
Feb 2250
Mar 2725
Apr 2580
May 2888
tabler-icon-diamond-filled.svg

Paraphrase This Document

Need a fresh take? Get an instant paraphrase of this document with our AI Paraphraser
Document Page
Jun 3150
Jul 3300
Aug 3460
Sep 3670
Oct 3888
Sum of expenses (∑X) 29911
N 10
Mean / Average
(∑X) / N
= 29911 / 10
= 2991
(ii) Median
Steps
Firstly sort values in the format smallest to largest
Thereafter determining the middle value range by using the following formula
(Number of observation + 1) / 2
In the current scenario, middle value is derived by dividing addition of 5th and 6th
value by 2.
Arranging data set in an ascending manner:
Date Transportation expenses (in £)
Jan 2000
Feb 2250
Apr 2580
Mar 2725
May 2888
Jun 3150
Jul 3300
Aug 3460
Sep 3670
Oct 3888
Median = (N + 1) / 2 (Median Concepts and Definitions, 2021)
Document Page
= (10 + 1) / 2
= 5.5
Accordingly
(5th Value + 6th Value) / 2
2888 + £3150) / 2
= £3019
(iii) Mode
As per central tendency measures, mode refers to the value that repeated most
frequently in the data set. (Mode, 2021) In the context of current data set, there is no repeated
value so mode accounts for n/a.
(iv) Range
Range =Maximum – Minimum value (Gaunt and Merkle, 2021)
Steps for calculating range value is as follows:
Determining the maximum figure from data
Assessing lowest values comes under data set
Determining range value by subtracting value of step 2 from 1
Maximum value from data set = £3888
Minimum value from data set = £2000
= £3888 - £2000
= £1888
Particulars Figures
Document Page
Maximum or highest wind speed level 17
Minimum or lowest wind speed level 6
Range
Maximum – Minimum value
17 – 6
= 11
(v) Standard Deviation (SD)
Following stages are applied for calculating SD
1. In the first stage x (transportation expenses) square is calculated
2. Thereafter, ∑X^2 is derived for further evaluation
3. At this step ∑X^2 is divided by n
4. In fourth stage sum of transportation expenses is divided by n
5. Here, for calculating variance results of 4 stage is subtracted from outcome of 3rd step
6. Value of SD is derived by doing square root of variance
Date Transportation expenses (in £)
X^2
Jan 2000 4000000
Feb 2250 5062500
Mar 2725 7425625
Apr 2580 6656400
May 2888 8340544
Jun 3150 9922500
Jul 3300 10890000
Aug 3460 11971600
Sep 3670 13468900
Oct 3888 15116544
Sum of X^2 92854613
tabler-icon-diamond-filled.svg

Paraphrase This Document

Need a fresh take? Get an instant paraphrase of this document with our AI Paraphraser
Document Page
Standard deviation= SQRT of ∑x^2 / N – (∑x / n) ^ 2
= SQRT of (92854613 / 10) – (29911 / 10) ^ 2
= SQRT of £9285461 – £8946679
= SQRT of £338782
= £582
4. Discuss the followings: using the linear forecasting model which is y = mx + c along with
the steps
1. Stating stages for the computation of m value
m = NΣxy – Σx Σy / NΣ x^2 – (Σx)^2
In step 1, summation of x*y is calculated
Here, number of observation is multiplied by Σxy
At this level summation of year numbers and expenditure assessed
Step 2 – Step 3
Thereafter, observations * Σ x^2 is done
Square of Σx value is calculated
Step 5 – Step 6
M value derived through dividing the value of step 4 from 7
2. Presenting how c value can be calculated
For c value assessment firstly sum of expenditure is identified
In the very second step, M * Σx
Thereafter, below mentioned formula is being used
(m * Σx / number of observations
Value of step 3 is subtracted from Σy
3. Forecasting transportation expenses for the month of 14th and 16th
Document Page
Year
Number
of year
(X)
Transportation
expenses (in £) XY X^2
Jan 1 2000 2000 1
Feb 2 2250 4500 4
Mar 3 2725 8175 9
Apr 4 2580 10320 16
May 5 2888 14440 25
Jun 6 3150 18900 36
Jul 7 3300 23100 49
Aug 8 3460 27680 64
Sep 9 3670 33030 81
Oct 10 3888 38880 100
Total 55 29911 181025 385
M = NΣxy – Σx Σy / NΣ x^2 – (Σx) ^ 2
m = 10 (181025) - (55 * 29911) / (10 * 385) – (55)^2
m = (1810250 - 1645105) / (3850 – 3025)
m = 165145 / 825
m = £200
C = Σy - mΣx / N
c = 29911 – (200 * 55) / 10
c = (29911 – 11010) / 10
c = 18901 / 10
c = £1890
Forecasting transportation expenses for the month of 14
Y = mX + c
x = 14th month
Y = 200 (14) + (1890)
Document Page
Y = 2800 + 1890
Y = £4690
Projected transportation expenses for 16th month
Y = mX + c
X implies for 16th month
Y = 200 (16) + (1890)
Y = 3200 + 1890
Y = £5090
By applying forecasting model, increasing trend has found in the expenditure incurred
for transportation. On the basis of assessment, in the upcoming months (February and April),
transportation expense will be £4690 and 5090 significantly.
CONCLUSION
By summing up this report it can be articulated that descriptive statistical tools assist
in getting suitable results. Besides this, it has been articulated that business entity can make
forecast about future expenses through applying statistical tools.
tabler-icon-diamond-filled.svg

Paraphrase This Document

Need a fresh take? Get an instant paraphrase of this document with our AI Paraphraser
Document Page
REFERENCES
Books and Journals
Gaunt, R. E. and Merkle, M., 2021. On bounds for the mode and median of the generalized
hyperbolic and related distributions. Journal of Mathematical Analysis and
Applications. 493(1). p.124508.
Online
Median Concepts and Definitions. 2021. Online. Available through:
<https://stats.mom.gov.sg/SL/Pages/Median-Concepts-and-Definitions.aspx#:~:text=If
%20the%20number%20of%20observations,is%20the%20number%20of
%20observations.&text=Else%2C%20if%20the%20number%20of,of%20the%20middle
%20two%20numbers.>.
Mode. 2021. Online. Available through: <
https://www.merriam-webster.com/dictionary/mode>.
chevron_up_icon
1 out of 11
circle_padding
hide_on_mobile
zoom_out_icon