Statistics for Decision Making: Report on Luxury Car Buyer Preferences
VerifiedAdded on 2023/06/10
|23
|3968
|172
Report
AI Summary
This business report provides a statistical analysis of customer profiles for three luxury car models: BMW, Lexus, and Mercedes. A survey of 420 households examines age, income, and education levels to understand car preferences. The analysis reveals that Mercedes buyers tend to be older, wealthier, and more educated. ANOVA testing supports the claim that average age, income, and education years are independent across the three car buyer groups. A binary logit model indicates a significant positive influence of age, income, and education on Mercedes preference. The report concludes that Mercedes sellers should target older, richer, and more educated individuals to maximize sales.
Running Head: STATISTICS FOR DECISION MAKING
Statistics for Decision Making
Name of the Student
Name of the University
Course ID
Student ID
Statistics for Decision Making
Name of the Student
Name of the University
Course ID
Student ID
Paraphrase This Document
Need a fresh take? Get an instant paraphrase of this document with our AI Paraphraser
1STATISTICS FOR DECISION MAKING
Executive Summary
The business report briefly analyzes profile of customers buying three different models of car.
The three chosen car models are BMW, Lexus and Mercedes. Households are surveyed on the
scale of age, income and education years. The business problem of car sellers is addressed in
light of statistical tools. In order to reach a firm conclusion about customers’ profile 420 samples
are considered. It has been observed that buyers of Mercedes are older, have a relatively higher
income and are more educated. The claim that average age, income and education years are
independent among the buyers of three different luxury cars are supported based on ANOVA test
result. In the chosen sample, 36% people prefer Mercedes and 64% prefer either Lexus or BMW.
The fitted binary logit model indicates age, income and education years have significant positive
influence on preference of Mercedes cars. The Mercedes car sellers thus should target richer,
older and educated people to their car model.
2STATISTICS FOR DECISION MAKING
Table of Contents
1.Introduction...................................................................................................................................3
1.1 Business Problem...................................................................................................................3
1.2 Statistical Problem.................................................................................................................3
2. Analysis.......................................................................................................................................3
2.1 Analysis of ages of buyers of luxury cars..............................................................................3
2.2 Analysis of incomes of buyers of luxury cars.......................................................................7
2.3 Analysis of education years of buyers of luxury cars..........................................................11
2.4 Hypothesis testing for independence of average age of buyers...........................................15
2.5 Hypothesis testing for independence of average income of buyers....................................16
2.6 Hypothesis testing for independence of average education years of buyers.......................17
2.7 Test of preference of Mercedes cars to BMW or Lexus......................................................18
3. Conclusion.................................................................................................................................21
4. Implication of the study.............................................................................................................21
⊘ This is a preview!⊘
Do you want full access?
Subscribe today to unlock all pages.
Trusted by 1+ million students worldwide
3STATISTICS FOR DECISION MAKING
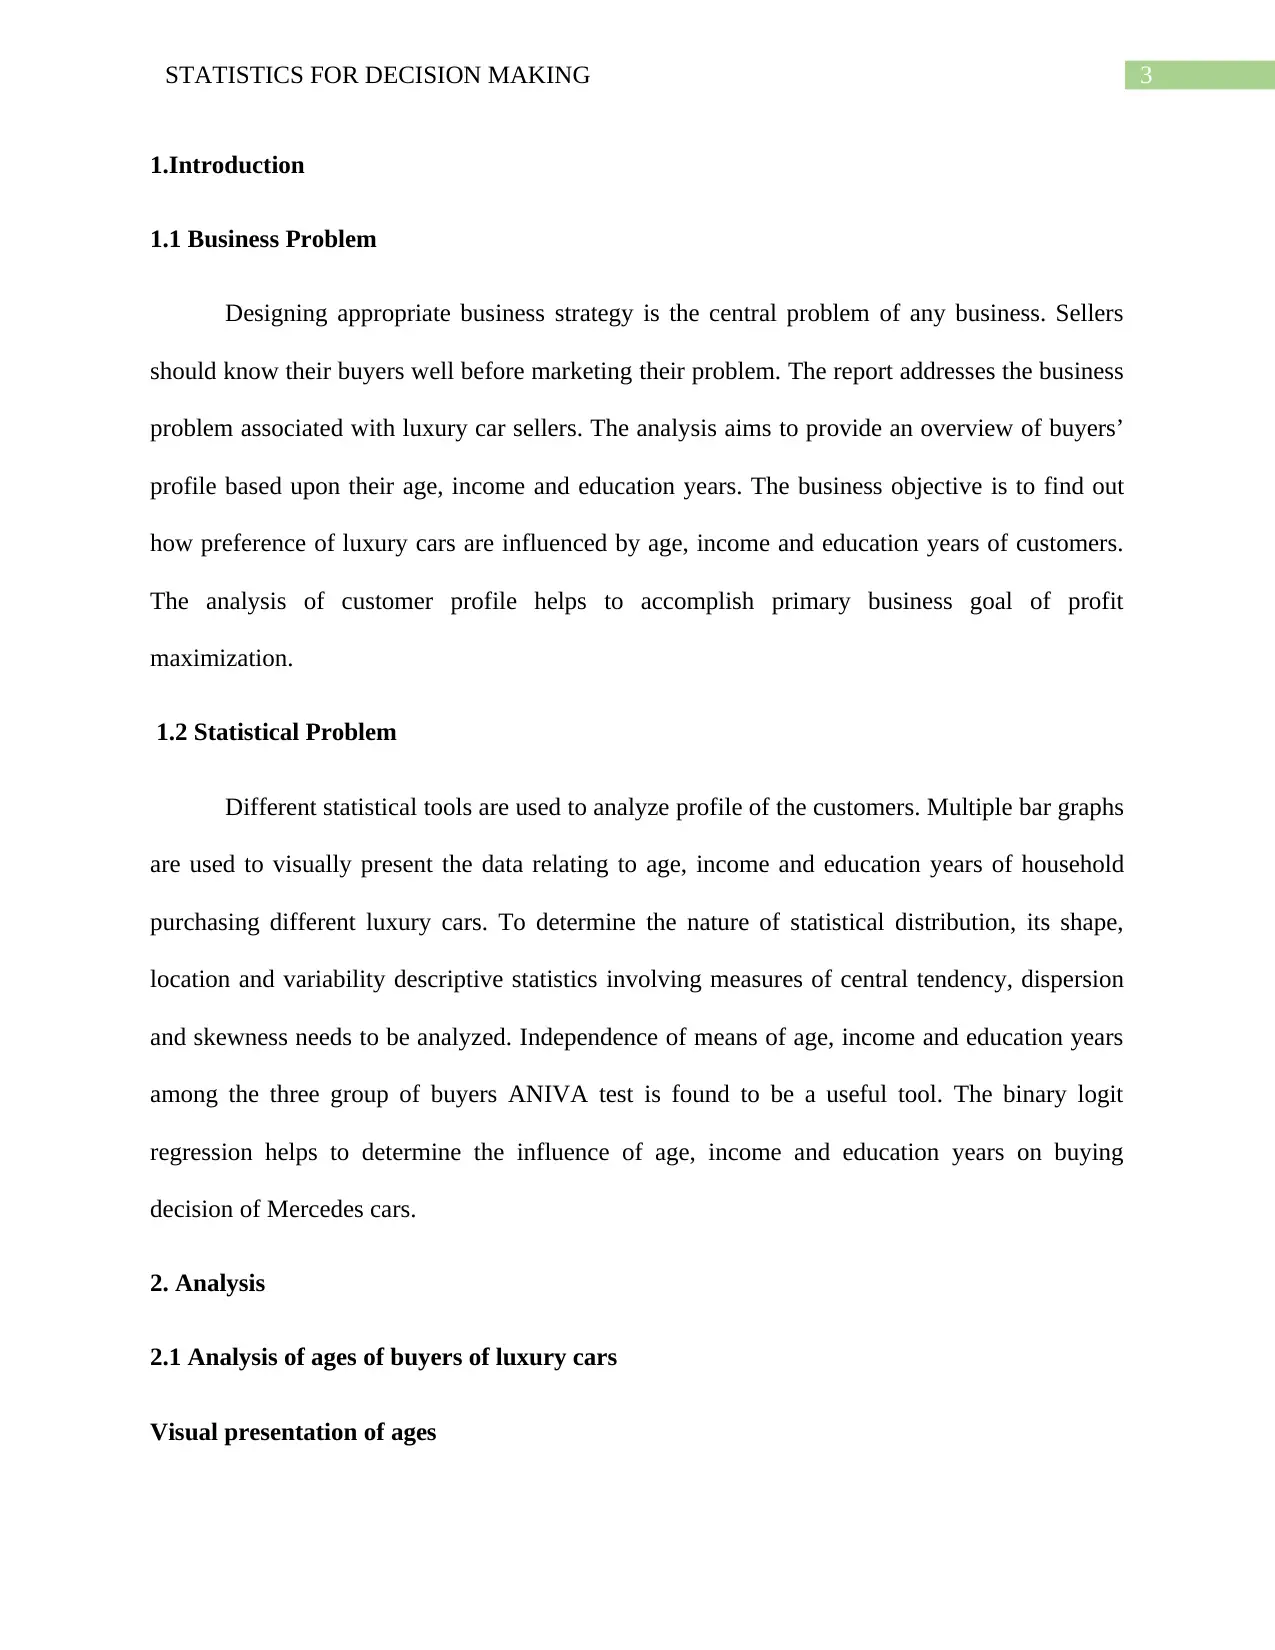
1.Introduction
1.1 Business Problem
Designing appropriate business strategy is the central problem of any business. Sellers
should know their buyers well before marketing their problem. The report addresses the business
problem associated with luxury car sellers. The analysis aims to provide an overview of buyers’
profile based upon their age, income and education years. The business objective is to find out
how preference of luxury cars are influenced by age, income and education years of customers.
The analysis of customer profile helps to accomplish primary business goal of profit
maximization.
1.2 Statistical Problem
Different statistical tools are used to analyze profile of the customers. Multiple bar graphs
are used to visually present the data relating to age, income and education years of household
purchasing different luxury cars. To determine the nature of statistical distribution, its shape,
location and variability descriptive statistics involving measures of central tendency, dispersion
and skewness needs to be analyzed. Independence of means of age, income and education years
among the three group of buyers ANIVA test is found to be a useful tool. The binary logit
regression helps to determine the influence of age, income and education years on buying
decision of Mercedes cars.
2. Analysis
2.1 Analysis of ages of buyers of luxury cars
Visual presentation of ages
Paraphrase This Document
Need a fresh take? Get an instant paraphrase of this document with our AI Paraphraser
4STATISTICS FOR DECISION MAKING
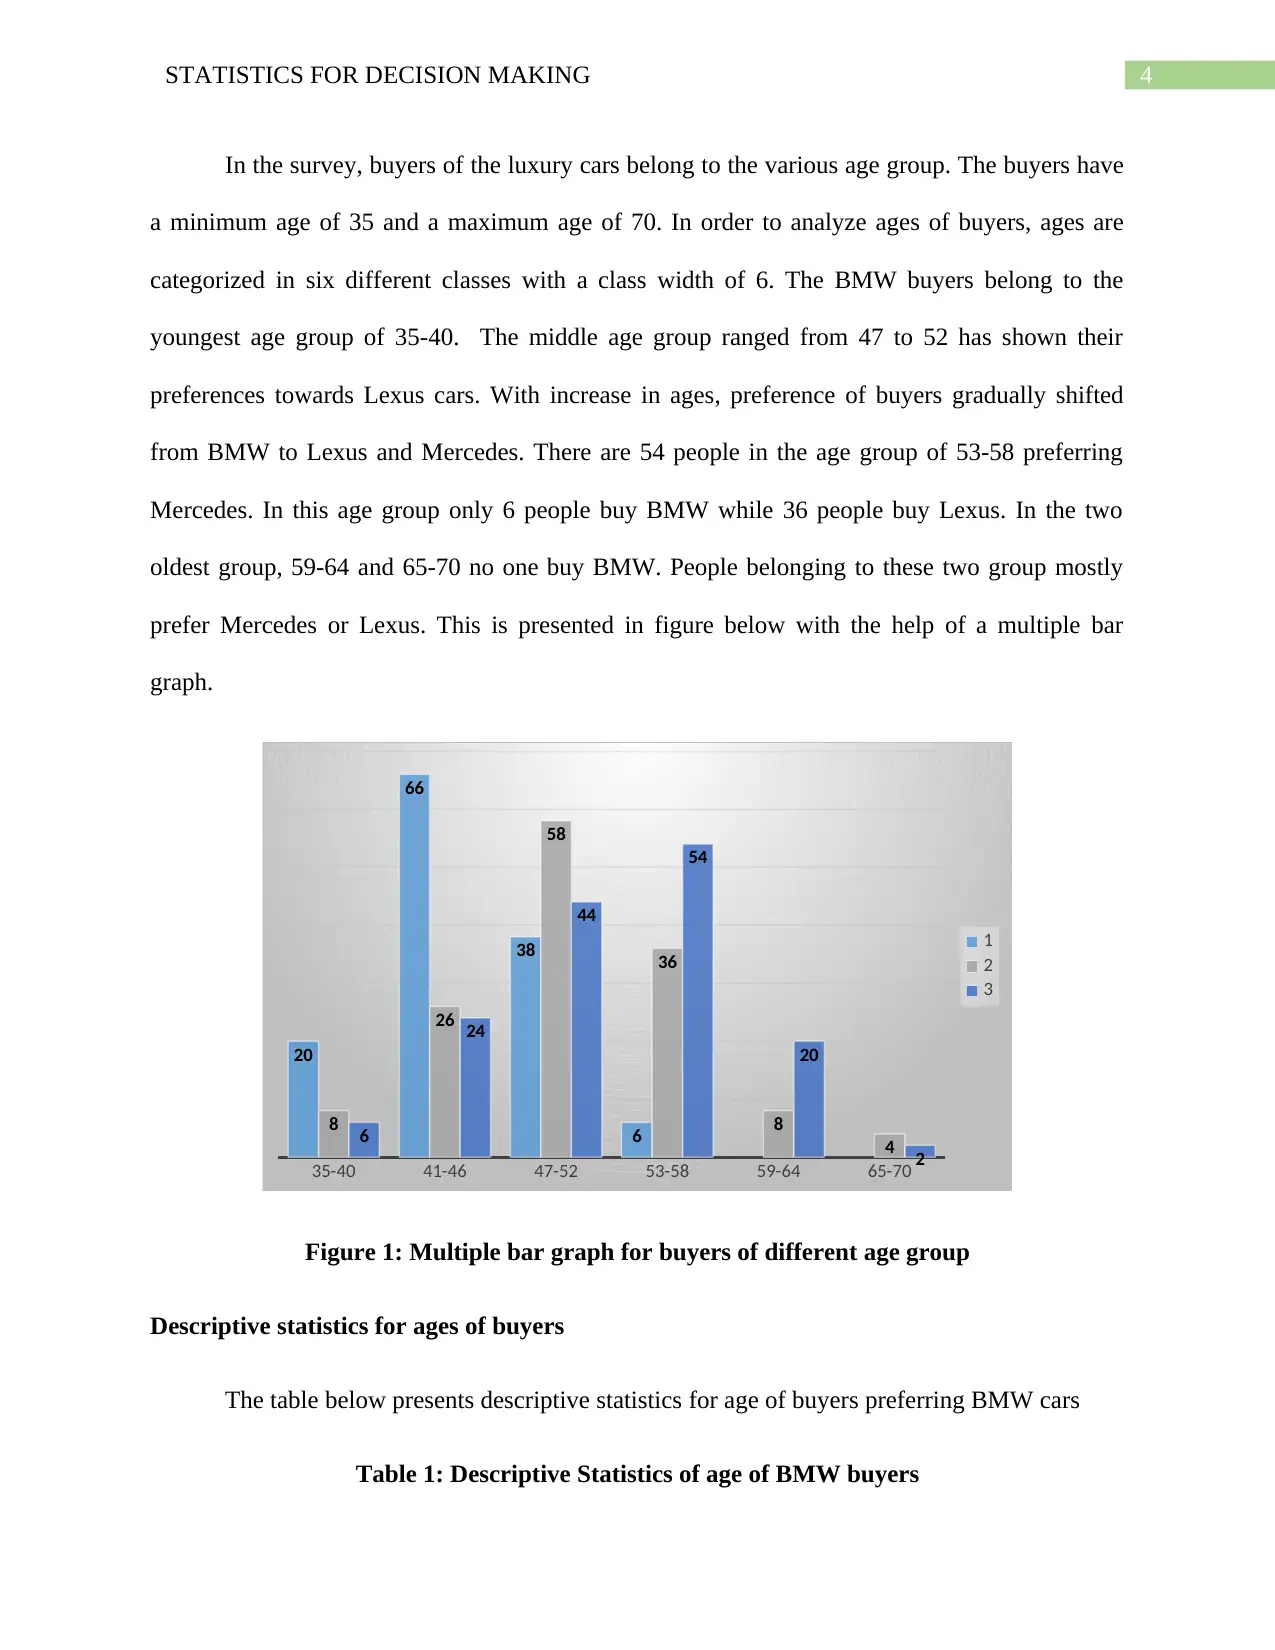
In the survey, buyers of the luxury cars belong to the various age group. The buyers have
a minimum age of 35 and a maximum age of 70. In order to analyze ages of buyers, ages are
categorized in six different classes with a class width of 6. The BMW buyers belong to the
youngest age group of 35-40. The middle age group ranged from 47 to 52 has shown their
preferences towards Lexus cars. With increase in ages, preference of buyers gradually shifted
from BMW to Lexus and Mercedes. There are 54 people in the age group of 53-58 preferring
Mercedes. In this age group only 6 people buy BMW while 36 people buy Lexus. In the two
oldest group, 59-64 and 65-70 no one buy BMW. People belonging to these two group mostly
prefer Mercedes or Lexus. This is presented in figure below with the help of a multiple bar
graph.
35-40 41-46 47-52 53-58 59-64 65-70
20
66
38
6
8
26
58
36
8
4
6
24
44
54
20
2
1
2
3
Figure 1: Multiple bar graph for buyers of different age group
Descriptive statistics for ages of buyers
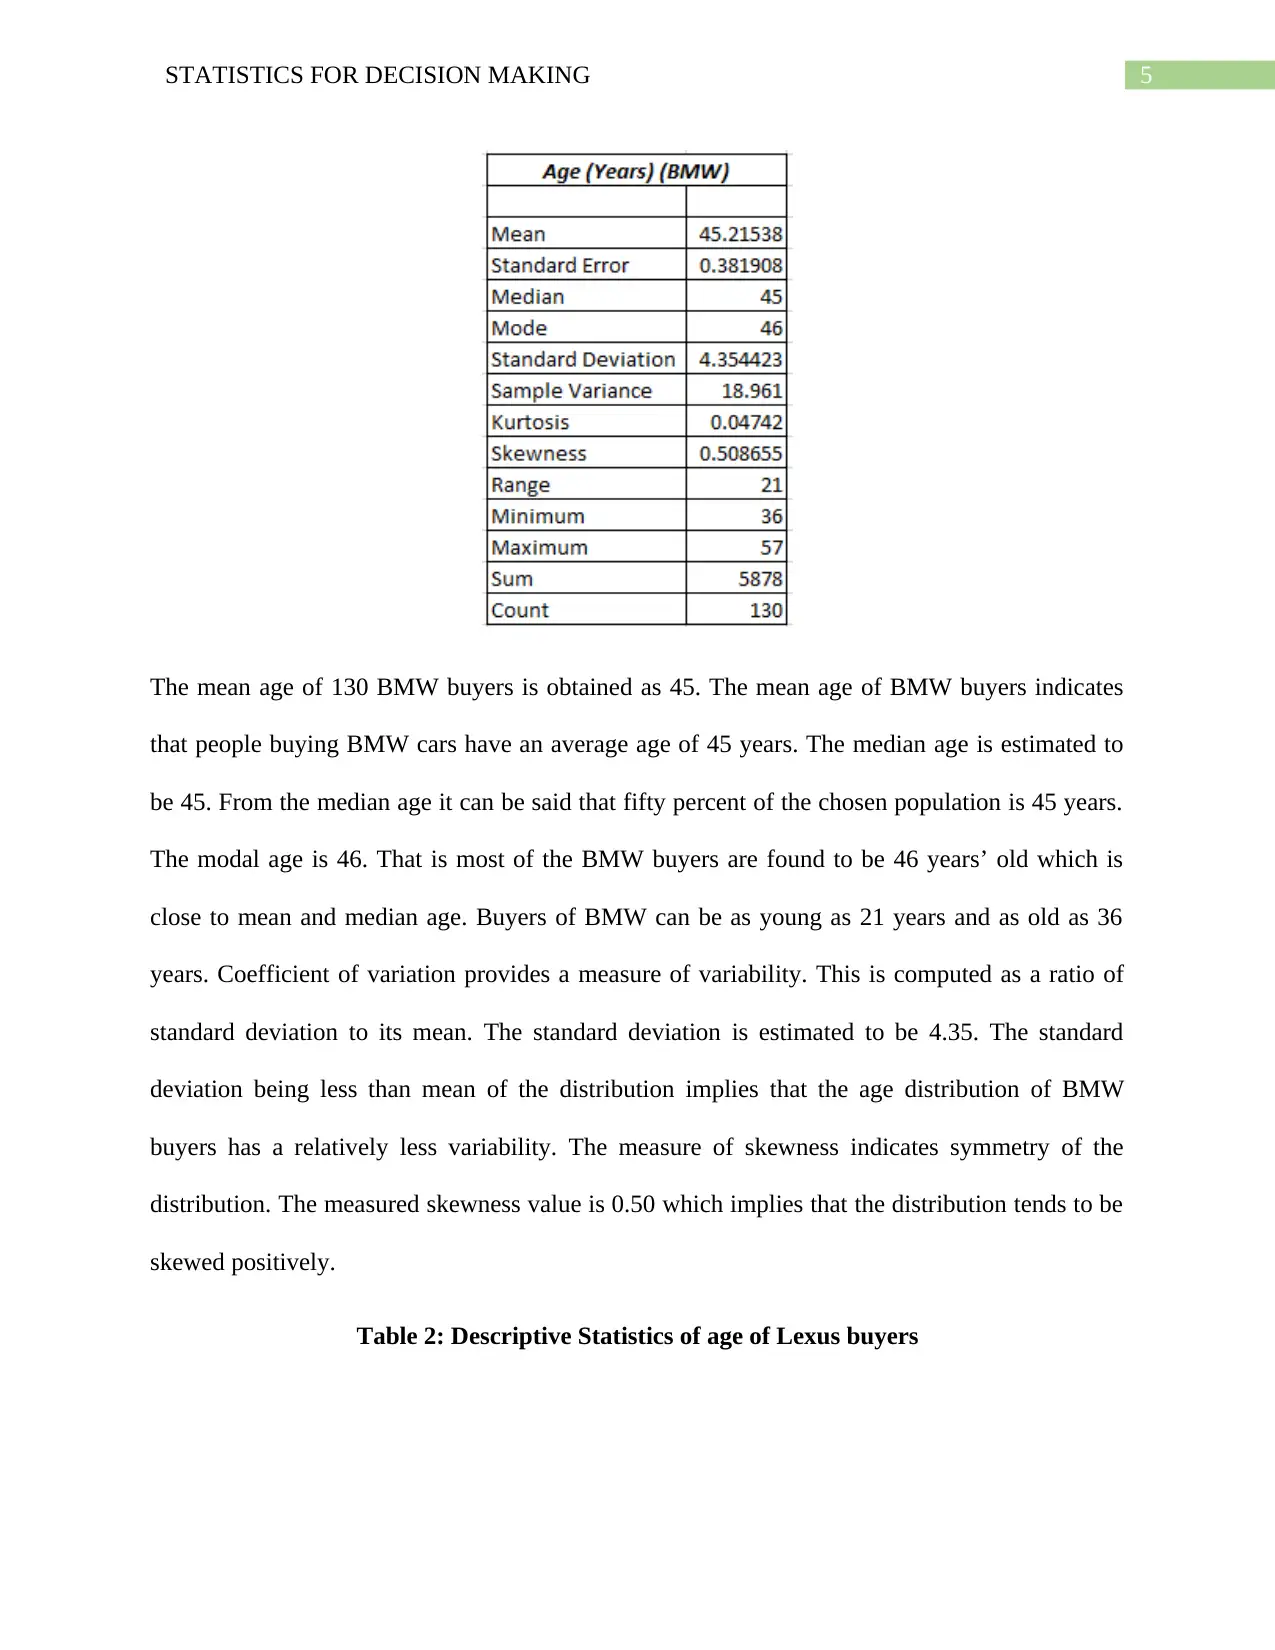
The table below presents descriptive statistics for age of buyers preferring BMW cars
Table 1: Descriptive Statistics of age of BMW buyers
In the survey, buyers of the luxury cars belong to the various age group. The buyers have
a minimum age of 35 and a maximum age of 70. In order to analyze ages of buyers, ages are
categorized in six different classes with a class width of 6. The BMW buyers belong to the
youngest age group of 35-40. The middle age group ranged from 47 to 52 has shown their
preferences towards Lexus cars. With increase in ages, preference of buyers gradually shifted
from BMW to Lexus and Mercedes. There are 54 people in the age group of 53-58 preferring
Mercedes. In this age group only 6 people buy BMW while 36 people buy Lexus. In the two
oldest group, 59-64 and 65-70 no one buy BMW. People belonging to these two group mostly
prefer Mercedes or Lexus. This is presented in figure below with the help of a multiple bar
graph.
35-40 41-46 47-52 53-58 59-64 65-70
20
66
38
6
8
26
58
36
8
4
6
24
44
54
20
2
1
2
3
Figure 1: Multiple bar graph for buyers of different age group
Descriptive statistics for ages of buyers
The table below presents descriptive statistics for age of buyers preferring BMW cars
Table 1: Descriptive Statistics of age of BMW buyers
5STATISTICS FOR DECISION MAKING
The mean age of 130 BMW buyers is obtained as 45. The mean age of BMW buyers indicates
that people buying BMW cars have an average age of 45 years. The median age is estimated to
be 45. From the median age it can be said that fifty percent of the chosen population is 45 years.
The modal age is 46. That is most of the BMW buyers are found to be 46 years’ old which is
close to mean and median age. Buyers of BMW can be as young as 21 years and as old as 36
years. Coefficient of variation provides a measure of variability. This is computed as a ratio of
standard deviation to its mean. The standard deviation is estimated to be 4.35. The standard
deviation being less than mean of the distribution implies that the age distribution of BMW
buyers has a relatively less variability. The measure of skewness indicates symmetry of the
distribution. The measured skewness value is 0.50 which implies that the distribution tends to be
skewed positively.
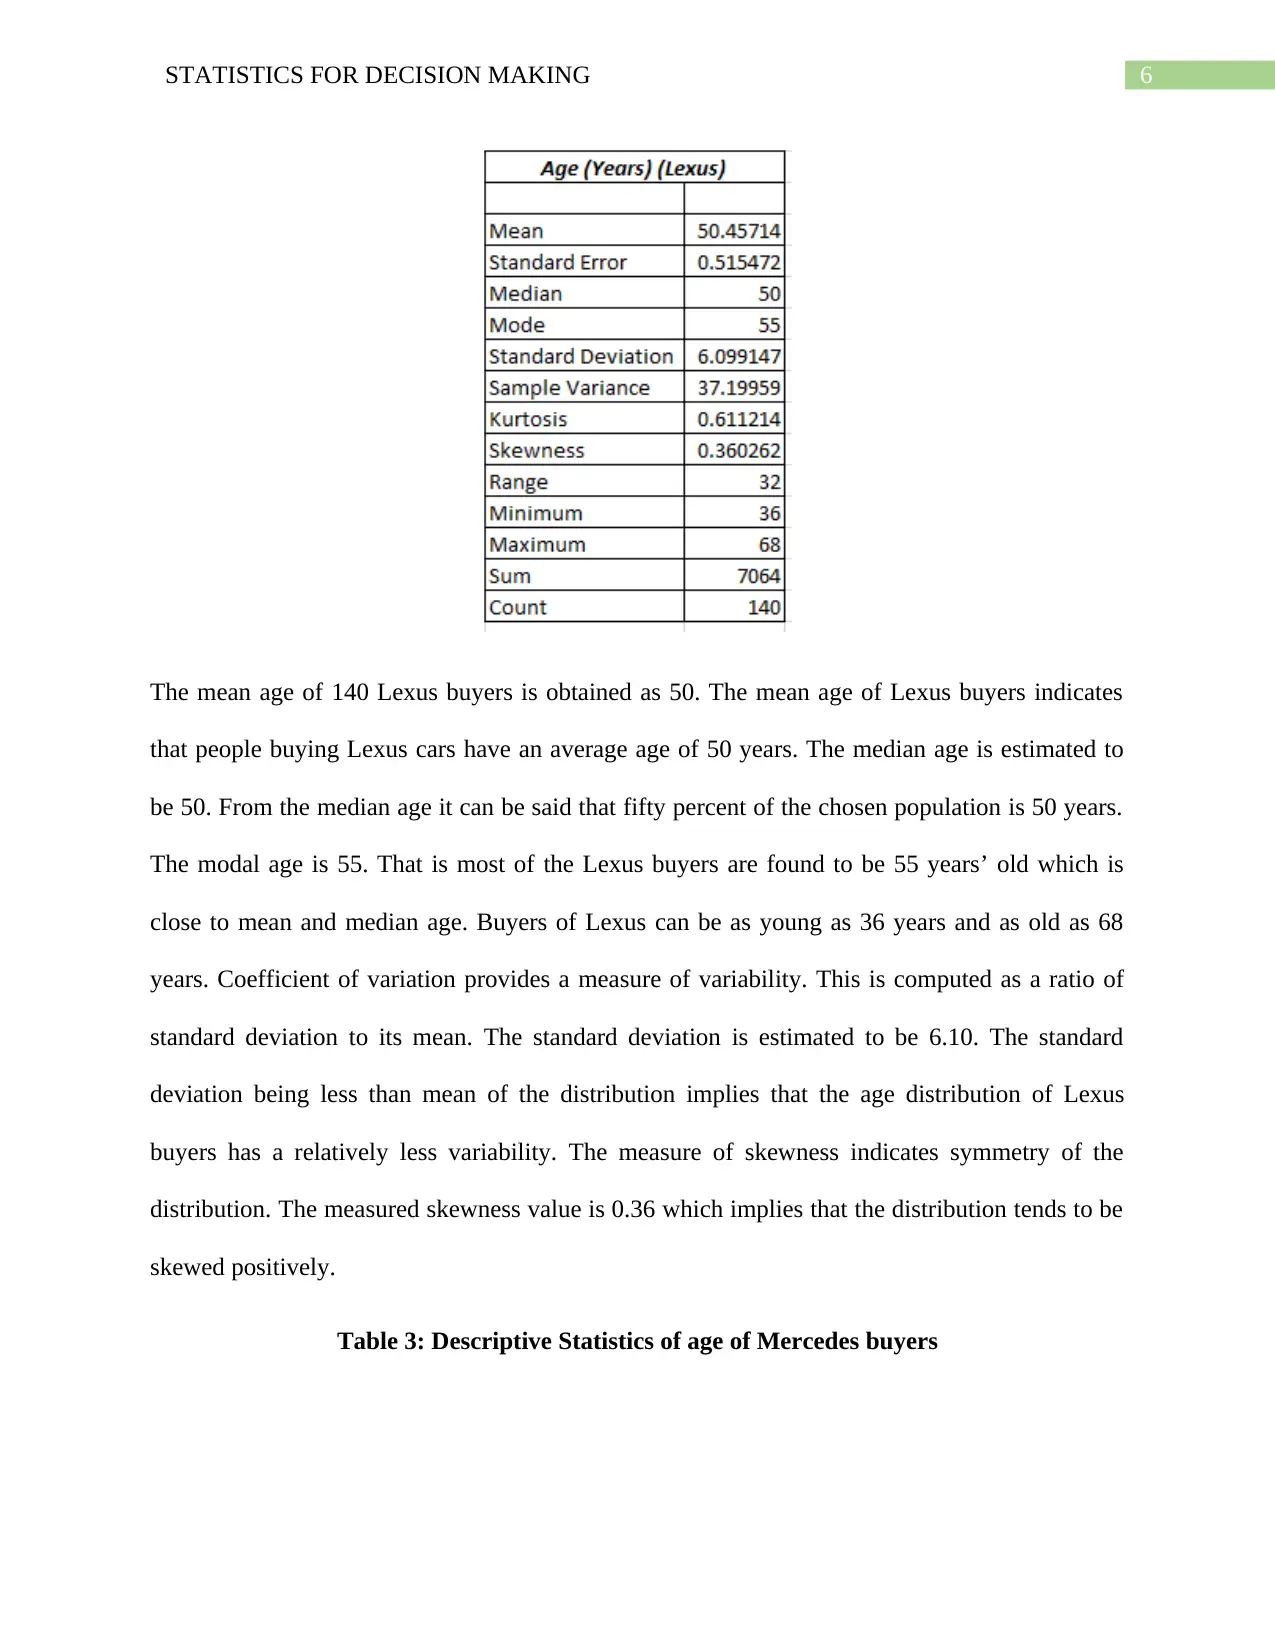
Table 2: Descriptive Statistics of age of Lexus buyers
The mean age of 130 BMW buyers is obtained as 45. The mean age of BMW buyers indicates
that people buying BMW cars have an average age of 45 years. The median age is estimated to
be 45. From the median age it can be said that fifty percent of the chosen population is 45 years.
The modal age is 46. That is most of the BMW buyers are found to be 46 years’ old which is
close to mean and median age. Buyers of BMW can be as young as 21 years and as old as 36
years. Coefficient of variation provides a measure of variability. This is computed as a ratio of
standard deviation to its mean. The standard deviation is estimated to be 4.35. The standard
deviation being less than mean of the distribution implies that the age distribution of BMW
buyers has a relatively less variability. The measure of skewness indicates symmetry of the
distribution. The measured skewness value is 0.50 which implies that the distribution tends to be
skewed positively.
Table 2: Descriptive Statistics of age of Lexus buyers
⊘ This is a preview!⊘
Do you want full access?
Subscribe today to unlock all pages.
Trusted by 1+ million students worldwide
6STATISTICS FOR DECISION MAKING
The mean age of 140 Lexus buyers is obtained as 50. The mean age of Lexus buyers indicates
that people buying Lexus cars have an average age of 50 years. The median age is estimated to
be 50. From the median age it can be said that fifty percent of the chosen population is 50 years.
The modal age is 55. That is most of the Lexus buyers are found to be 55 years’ old which is
close to mean and median age. Buyers of Lexus can be as young as 36 years and as old as 68
years. Coefficient of variation provides a measure of variability. This is computed as a ratio of
standard deviation to its mean. The standard deviation is estimated to be 6.10. The standard
deviation being less than mean of the distribution implies that the age distribution of Lexus
buyers has a relatively less variability. The measure of skewness indicates symmetry of the
distribution. The measured skewness value is 0.36 which implies that the distribution tends to be
skewed positively.
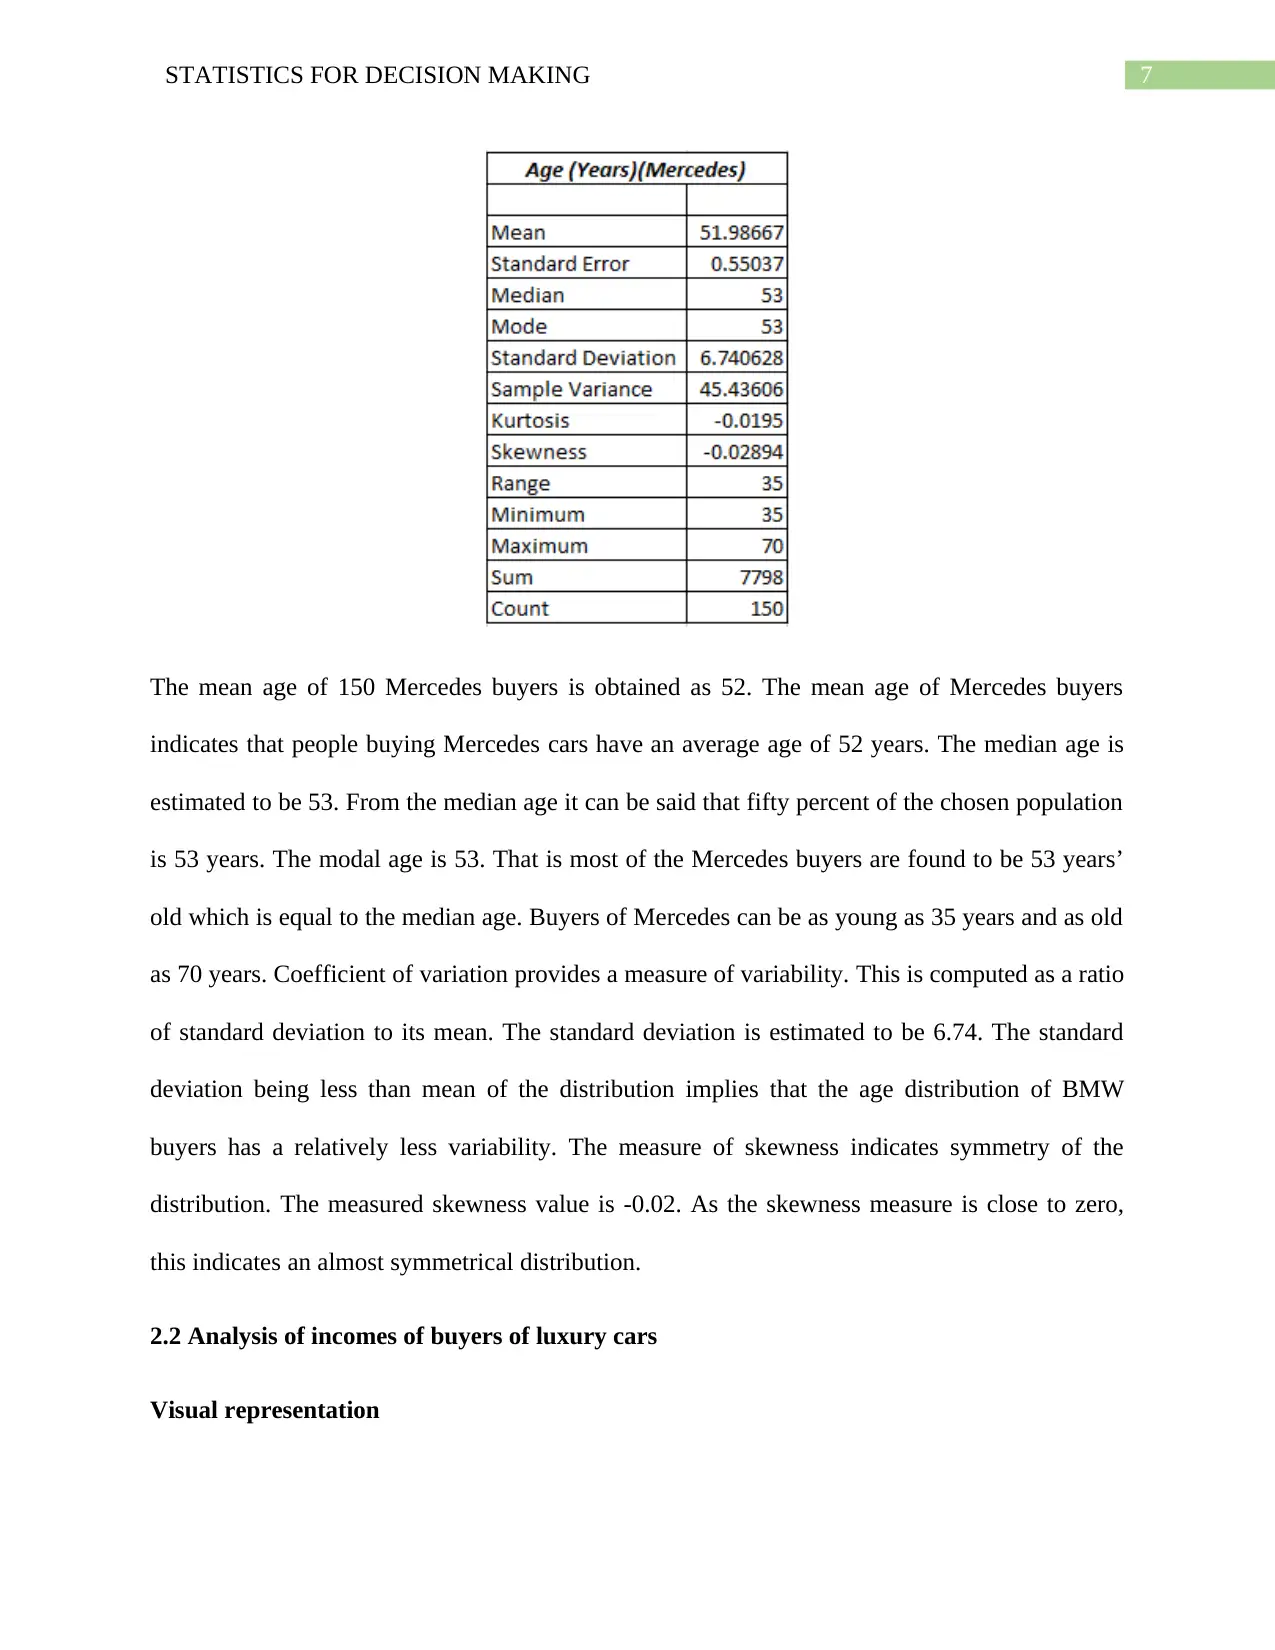
Table 3: Descriptive Statistics of age of Mercedes buyers
The mean age of 140 Lexus buyers is obtained as 50. The mean age of Lexus buyers indicates
that people buying Lexus cars have an average age of 50 years. The median age is estimated to
be 50. From the median age it can be said that fifty percent of the chosen population is 50 years.
The modal age is 55. That is most of the Lexus buyers are found to be 55 years’ old which is
close to mean and median age. Buyers of Lexus can be as young as 36 years and as old as 68
years. Coefficient of variation provides a measure of variability. This is computed as a ratio of
standard deviation to its mean. The standard deviation is estimated to be 6.10. The standard
deviation being less than mean of the distribution implies that the age distribution of Lexus
buyers has a relatively less variability. The measure of skewness indicates symmetry of the
distribution. The measured skewness value is 0.36 which implies that the distribution tends to be
skewed positively.
Table 3: Descriptive Statistics of age of Mercedes buyers
Paraphrase This Document
Need a fresh take? Get an instant paraphrase of this document with our AI Paraphraser
7STATISTICS FOR DECISION MAKING
The mean age of 150 Mercedes buyers is obtained as 52. The mean age of Mercedes buyers
indicates that people buying Mercedes cars have an average age of 52 years. The median age is
estimated to be 53. From the median age it can be said that fifty percent of the chosen population
is 53 years. The modal age is 53. That is most of the Mercedes buyers are found to be 53 years’
old which is equal to the median age. Buyers of Mercedes can be as young as 35 years and as old
as 70 years. Coefficient of variation provides a measure of variability. This is computed as a ratio
of standard deviation to its mean. The standard deviation is estimated to be 6.74. The standard
deviation being less than mean of the distribution implies that the age distribution of BMW
buyers has a relatively less variability. The measure of skewness indicates symmetry of the
distribution. The measured skewness value is -0.02. As the skewness measure is close to zero,
this indicates an almost symmetrical distribution.
2.2 Analysis of incomes of buyers of luxury cars
Visual representation
8STATISTICS FOR DECISION MAKING
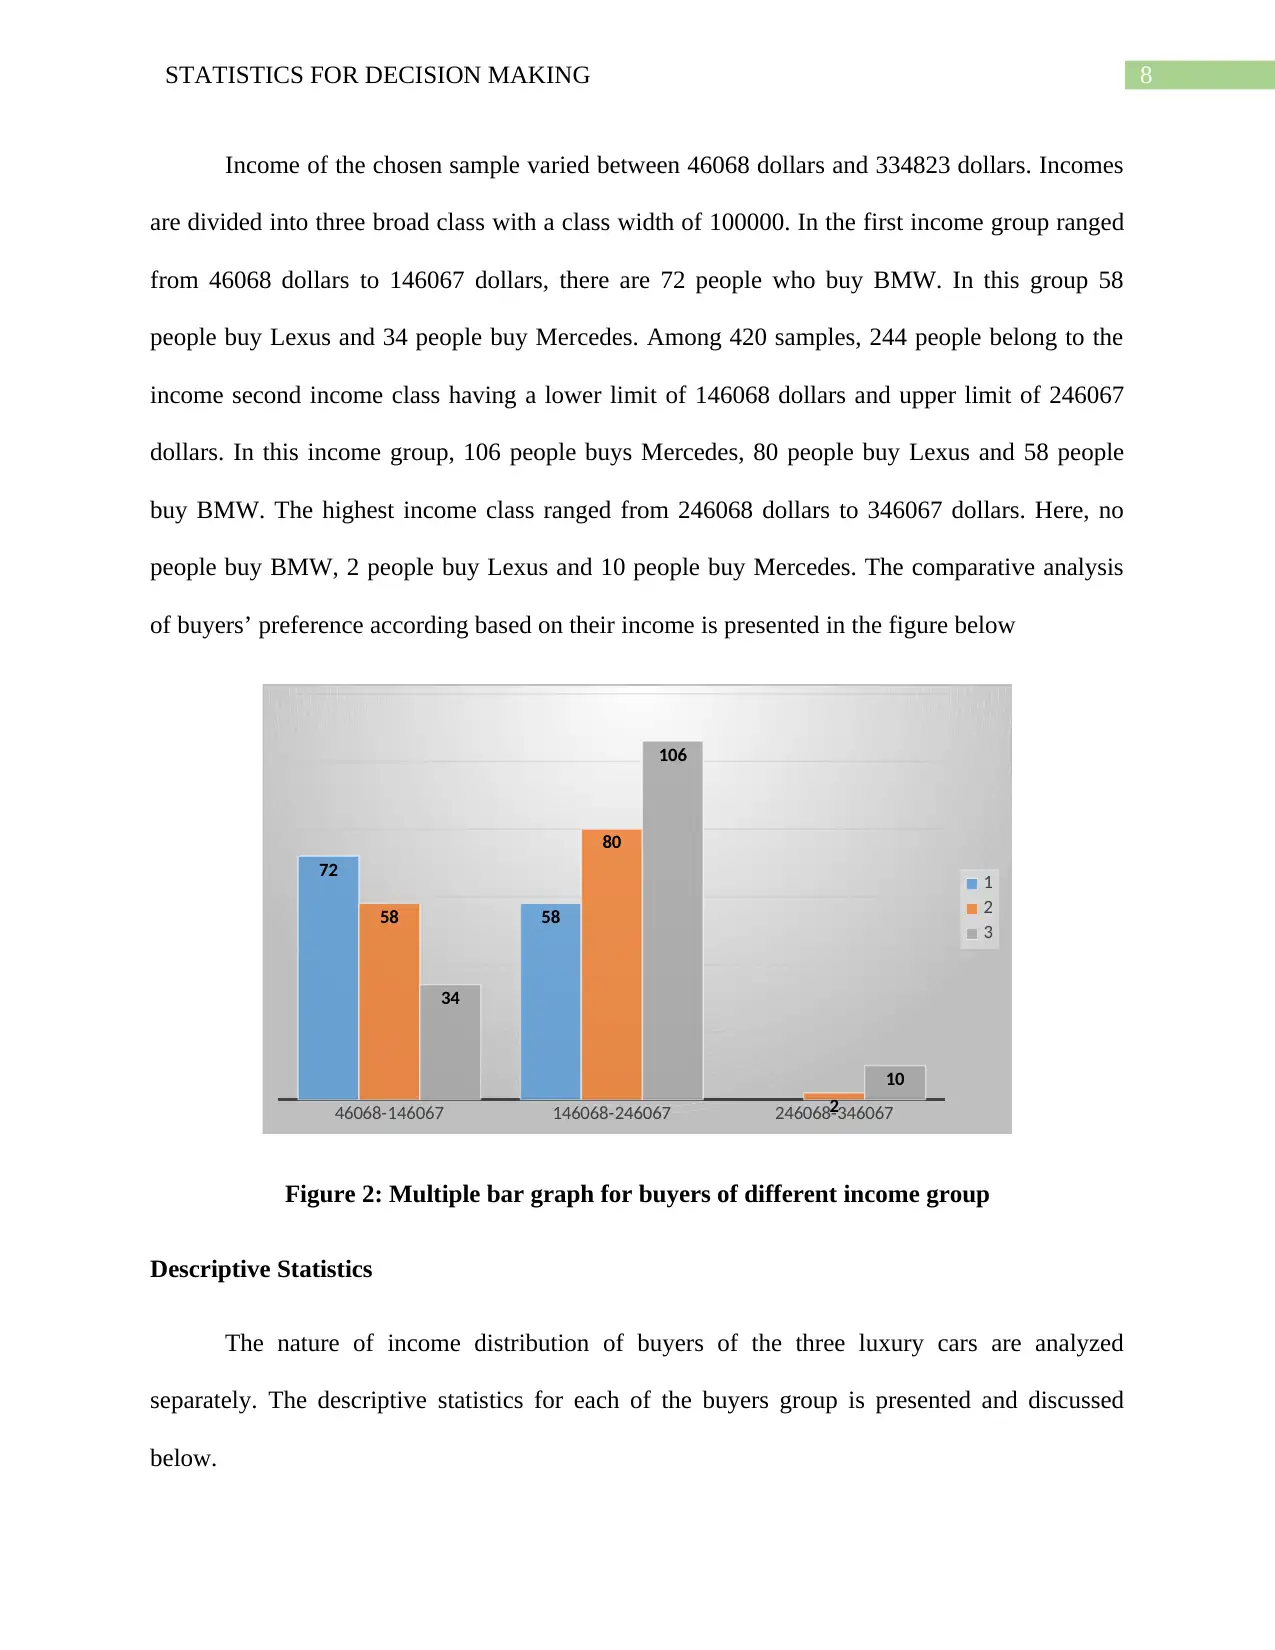
Income of the chosen sample varied between 46068 dollars and 334823 dollars. Incomes
are divided into three broad class with a class width of 100000. In the first income group ranged
from 46068 dollars to 146067 dollars, there are 72 people who buy BMW. In this group 58
people buy Lexus and 34 people buy Mercedes. Among 420 samples, 244 people belong to the
income second income class having a lower limit of 146068 dollars and upper limit of 246067
dollars. In this income group, 106 people buys Mercedes, 80 people buy Lexus and 58 people
buy BMW. The highest income class ranged from 246068 dollars to 346067 dollars. Here, no
people buy BMW, 2 people buy Lexus and 10 people buy Mercedes. The comparative analysis
of buyers’ preference according based on their income is presented in the figure below
46068-146067 146068-246067 246068-346067
72
5858
80
2
34
106
10
1
2
3
Figure 2: Multiple bar graph for buyers of different income group
Descriptive Statistics
The nature of income distribution of buyers of the three luxury cars are analyzed
separately. The descriptive statistics for each of the buyers group is presented and discussed
below.
⊘ This is a preview!⊘
Do you want full access?
Subscribe today to unlock all pages.
Trusted by 1+ million students worldwide
9STATISTICS FOR DECISION MAKING
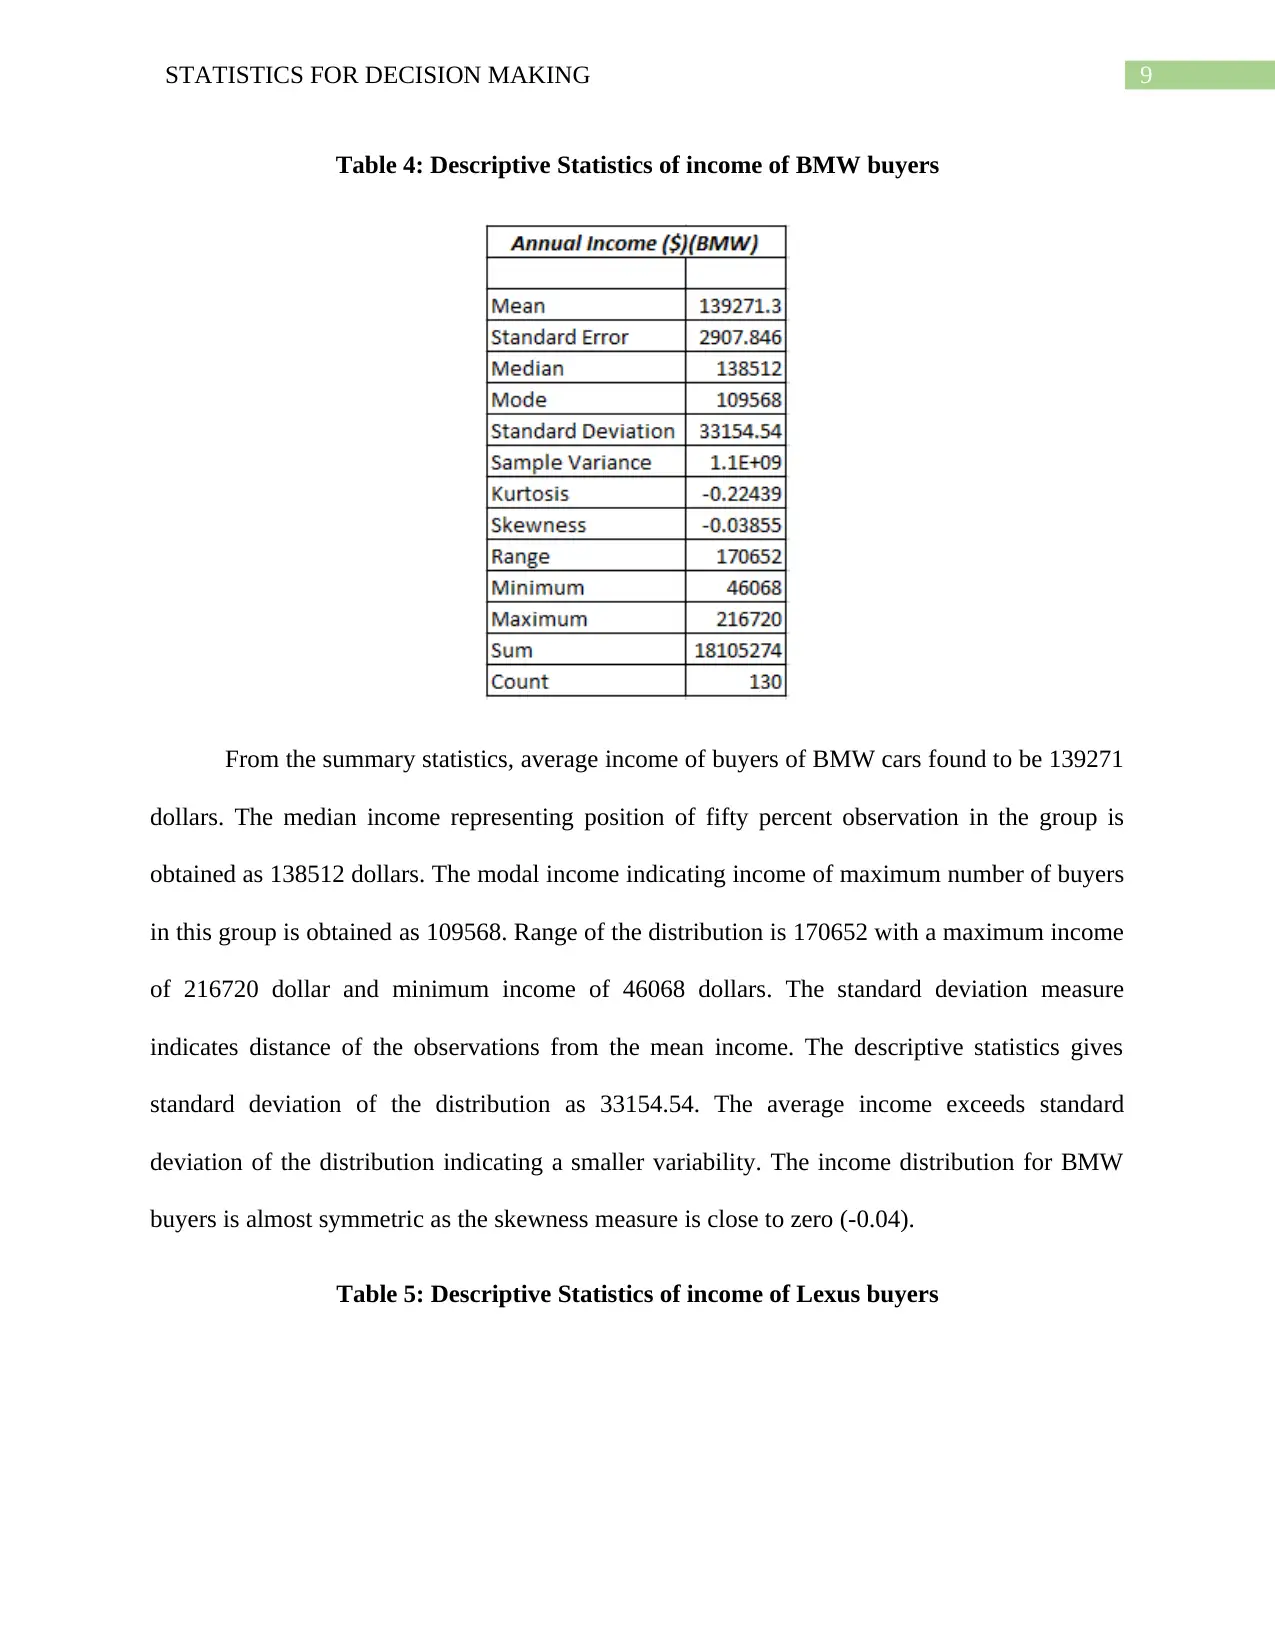
Table 4: Descriptive Statistics of income of BMW buyers
From the summary statistics, average income of buyers of BMW cars found to be 139271
dollars. The median income representing position of fifty percent observation in the group is
obtained as 138512 dollars. The modal income indicating income of maximum number of buyers
in this group is obtained as 109568. Range of the distribution is 170652 with a maximum income
of 216720 dollar and minimum income of 46068 dollars. The standard deviation measure
indicates distance of the observations from the mean income. The descriptive statistics gives
standard deviation of the distribution as 33154.54. The average income exceeds standard
deviation of the distribution indicating a smaller variability. The income distribution for BMW
buyers is almost symmetric as the skewness measure is close to zero (-0.04).
Table 5: Descriptive Statistics of income of Lexus buyers
Paraphrase This Document
Need a fresh take? Get an instant paraphrase of this document with our AI Paraphraser
10STATISTICS FOR DECISION MAKING
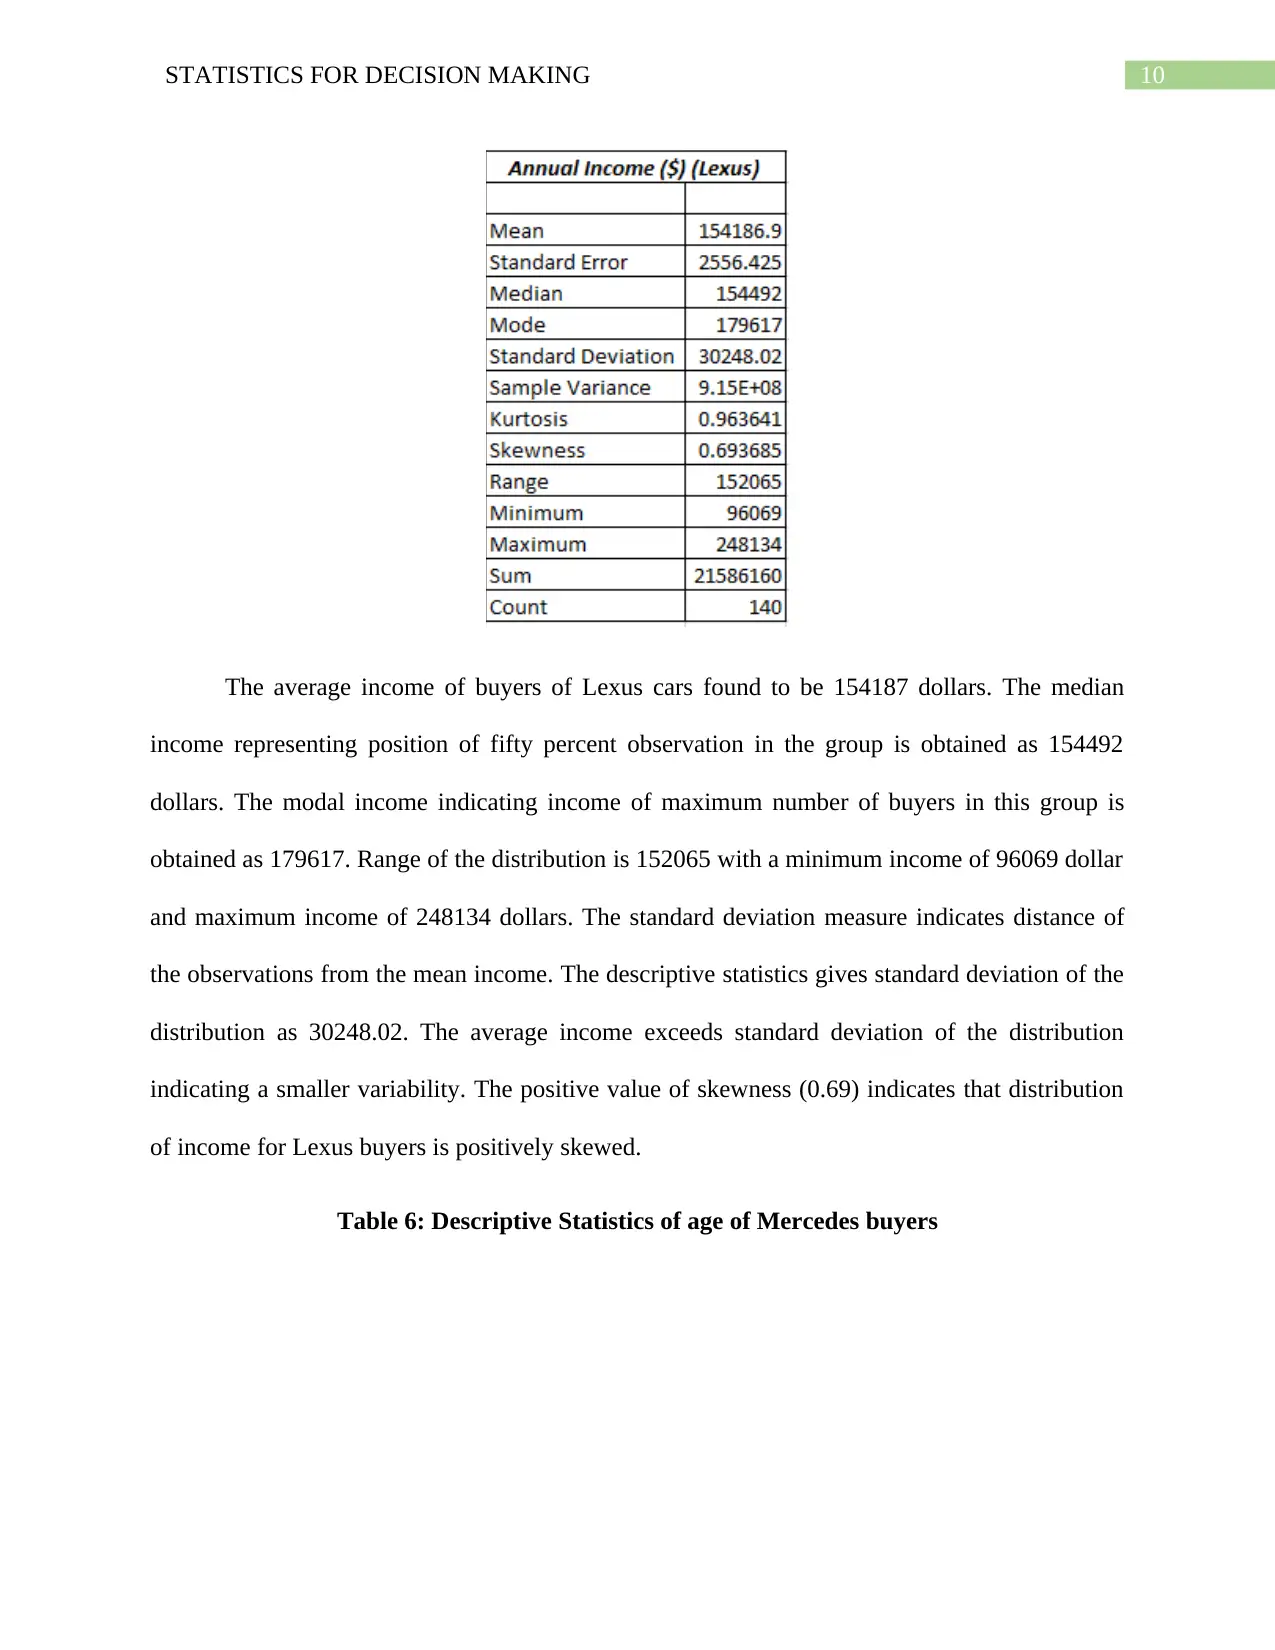
The average income of buyers of Lexus cars found to be 154187 dollars. The median
income representing position of fifty percent observation in the group is obtained as 154492
dollars. The modal income indicating income of maximum number of buyers in this group is
obtained as 179617. Range of the distribution is 152065 with a minimum income of 96069 dollar
and maximum income of 248134 dollars. The standard deviation measure indicates distance of
the observations from the mean income. The descriptive statistics gives standard deviation of the
distribution as 30248.02. The average income exceeds standard deviation of the distribution
indicating a smaller variability. The positive value of skewness (0.69) indicates that distribution
of income for Lexus buyers is positively skewed.
Table 6: Descriptive Statistics of age of Mercedes buyers

11STATISTICS FOR DECISION MAKING
The descriptive statistics gives average income of buyers of Mercedes cars as 184424
dollars. The median income representing position of fifty percent observation in the group is
obtained as 186070 dollars. The modal income indicating income of maximum number of buyers
in this group is obtained as 161590 dollars. Range of the distribution is 284882 with a maximum
income of 334823 dollar and minimum income of 49941 dollars. The standard deviation measure
indicates distance of the observations from the mean income. The descriptive statistics gives
standard deviation of the distribution as 47095.22. The average income exceeds standard
deviation of the distribution indicating a smaller variability. The income distribution for BMW
buyers is positively skewed as the skewness measure is estimated to be positive.
2.3 Analysis of education years of buyers of luxury cars
Visual representation
Education years of buyers are discussed in terms of three different classes having a class
width of 4. People having education years of 11 to 14 years mostly buy Lexus. There are 48
people in this class who buy Lexus car, 38 people with the same education years buy BMW
⊘ This is a preview!⊘
Do you want full access?
Subscribe today to unlock all pages.
Trusted by 1+ million students worldwide
1 out of 23
Related Documents


Your All-in-One AI-Powered Toolkit for Academic Success.
+13062052269
info@desklib.com
Available 24*7 on WhatsApp / Email
![[object Object]](/_next/static/media/star-bottom.7253800d.svg)
Unlock your academic potential
Copyright © 2020–2026 A2Z Services. All Rights Reserved. Developed and managed by ZUCOL.