Analyzing Luxury Car Demand: Statistics for Informed Decision Making
VerifiedAdded on  2023/06/11
|29
|4657
|394
Report
AI Summary
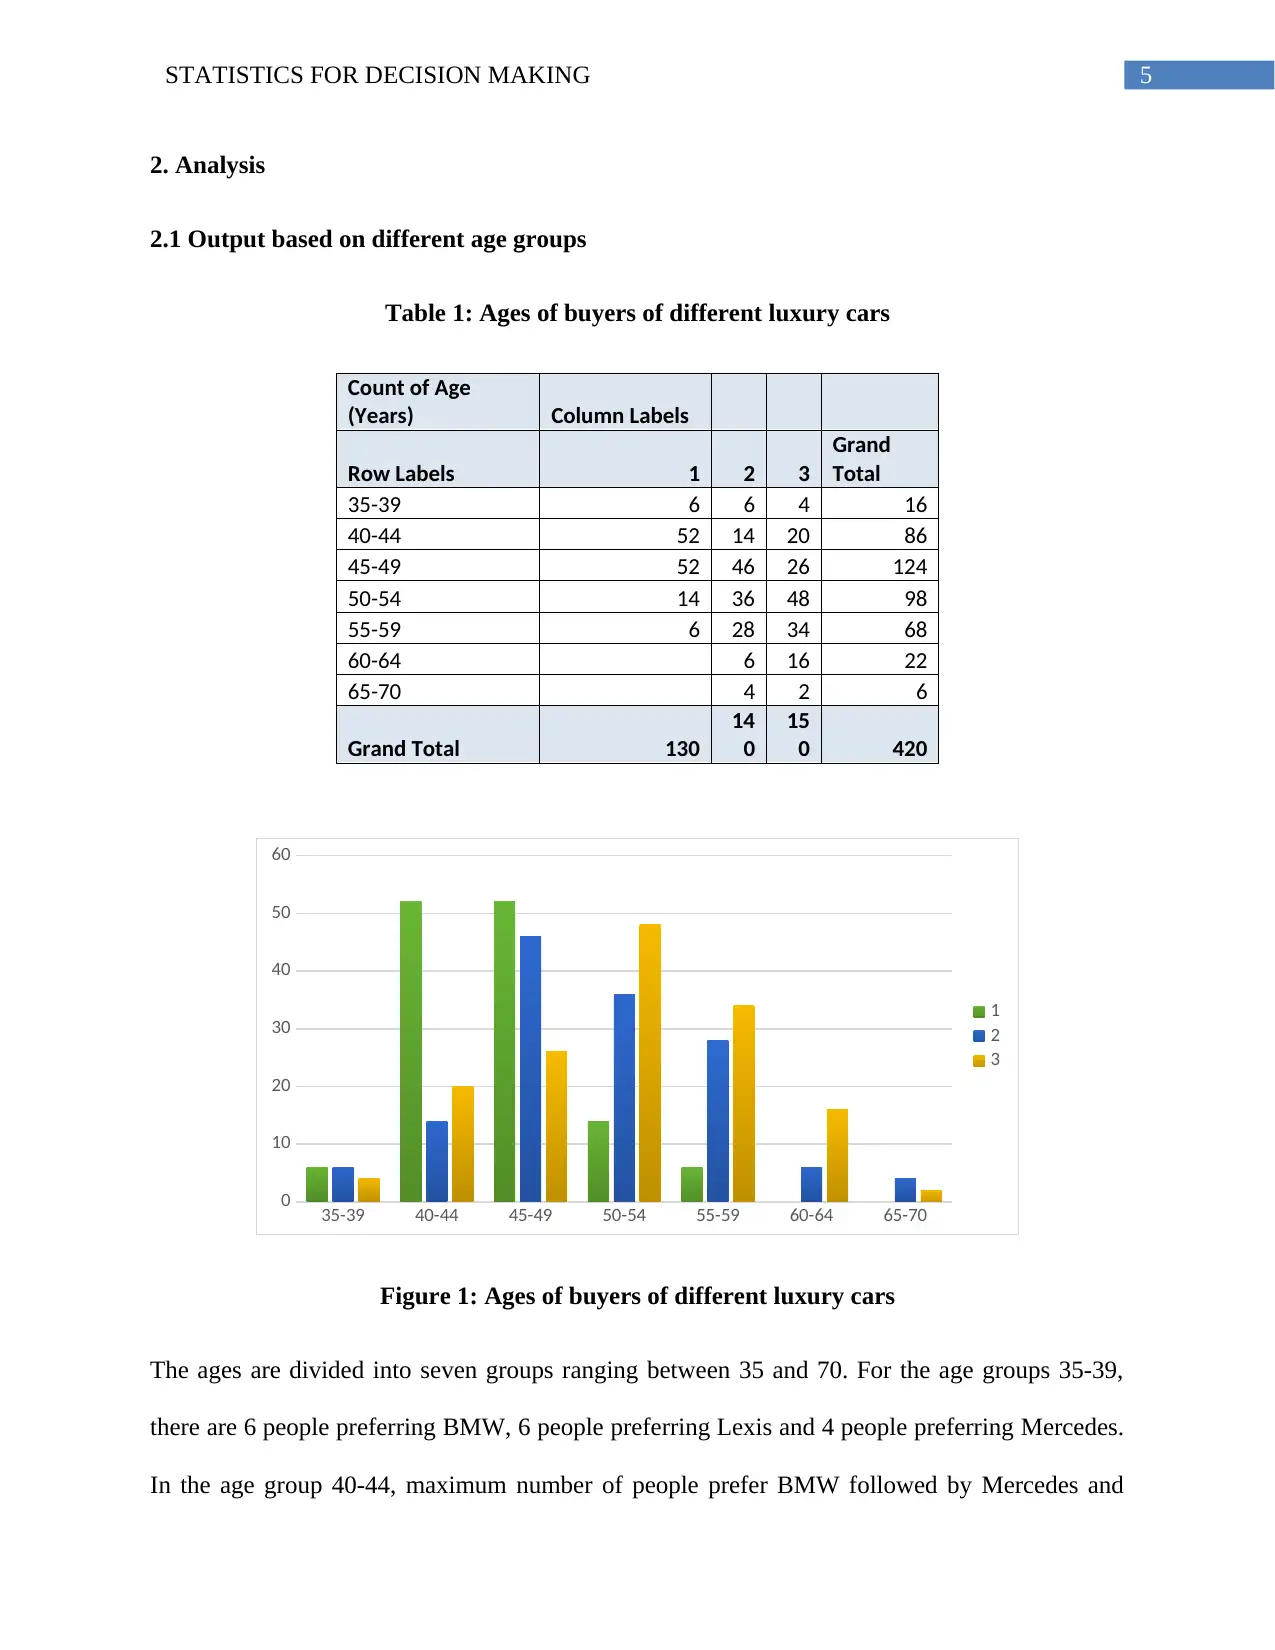
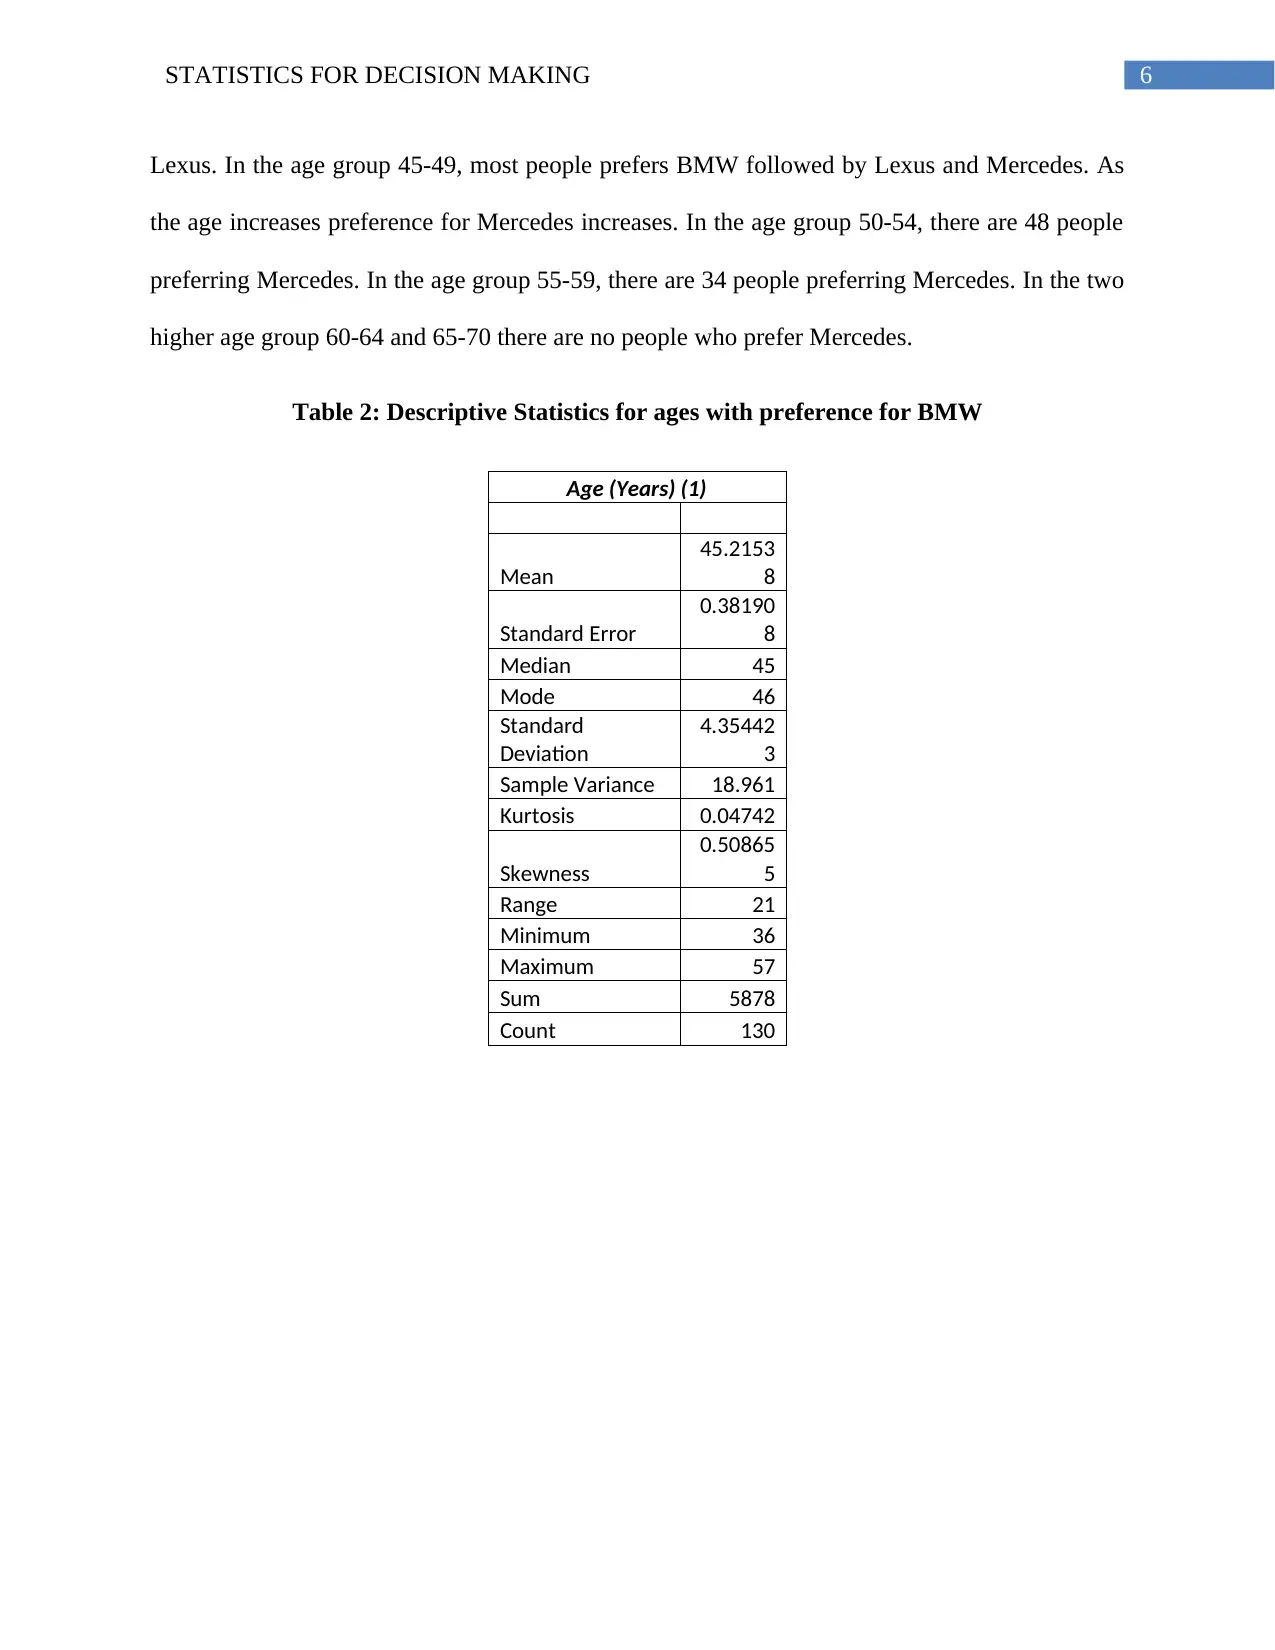
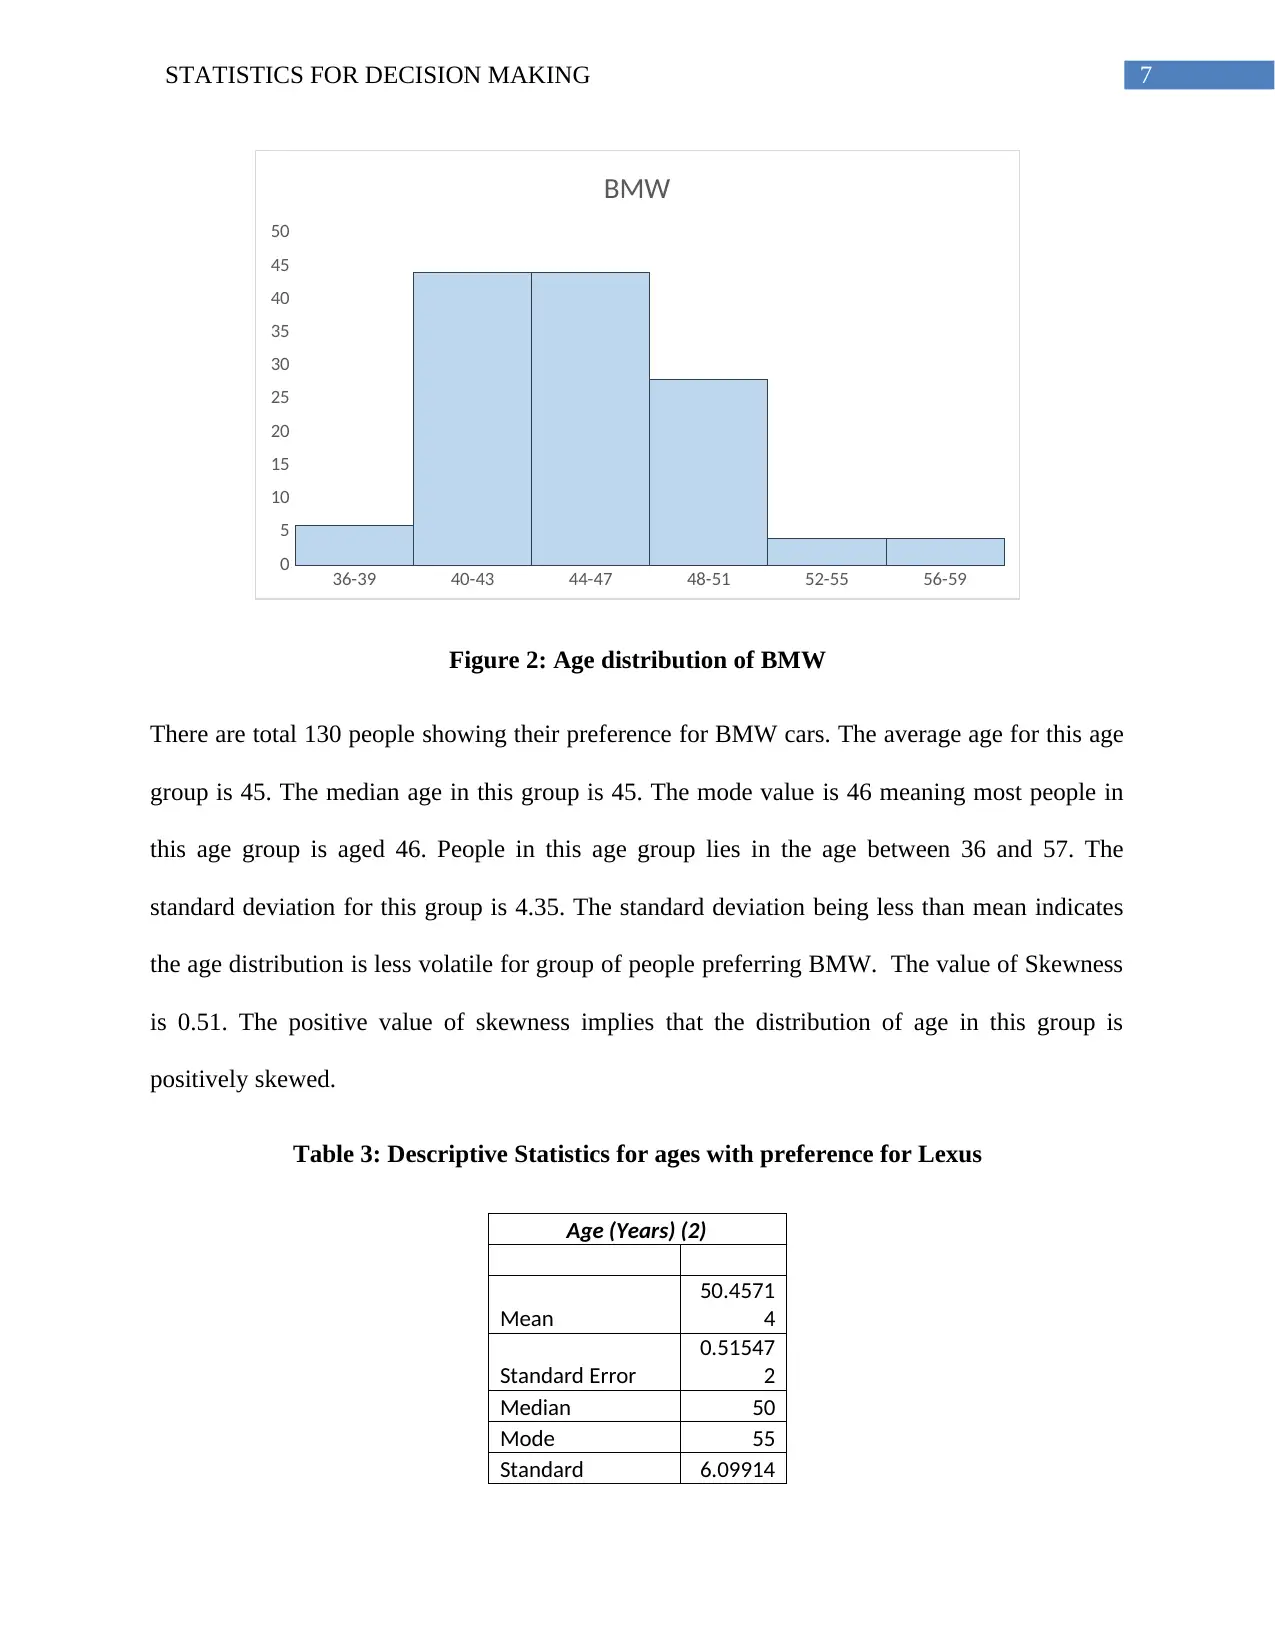
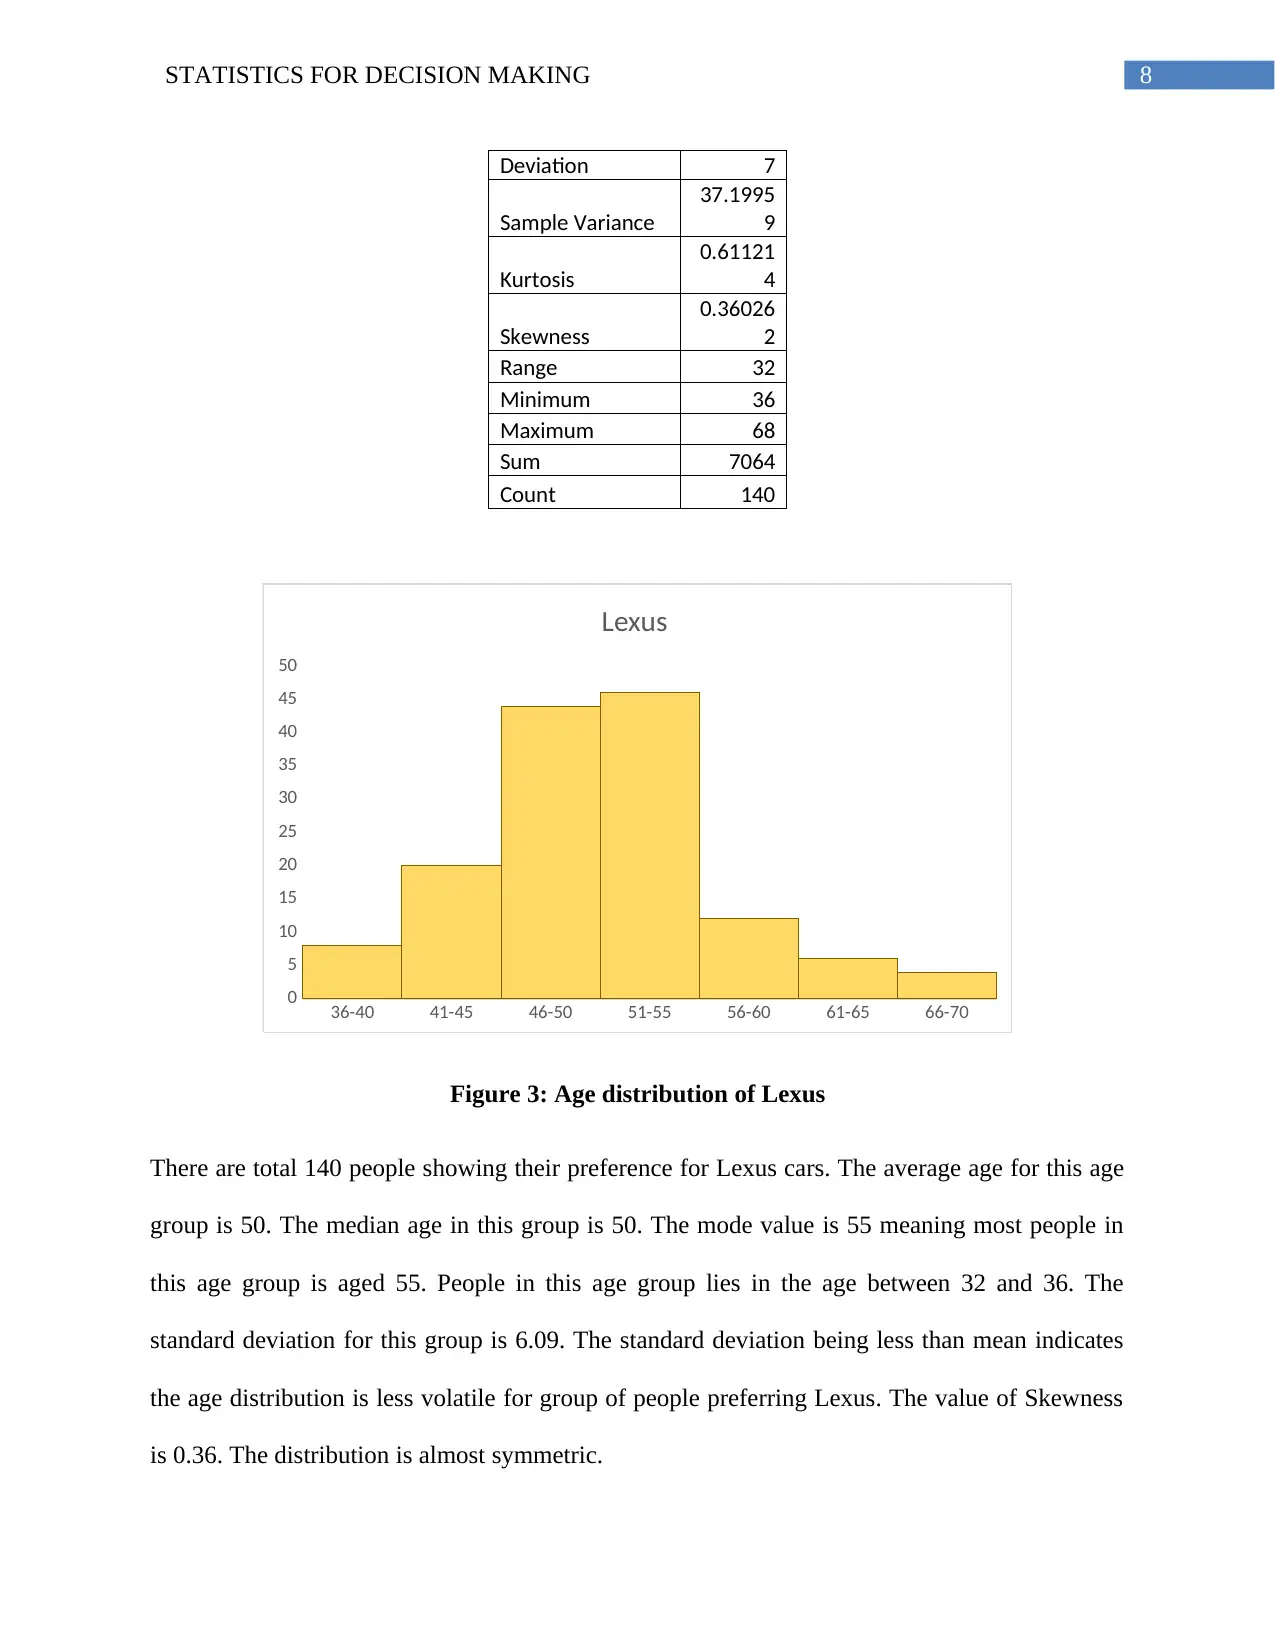
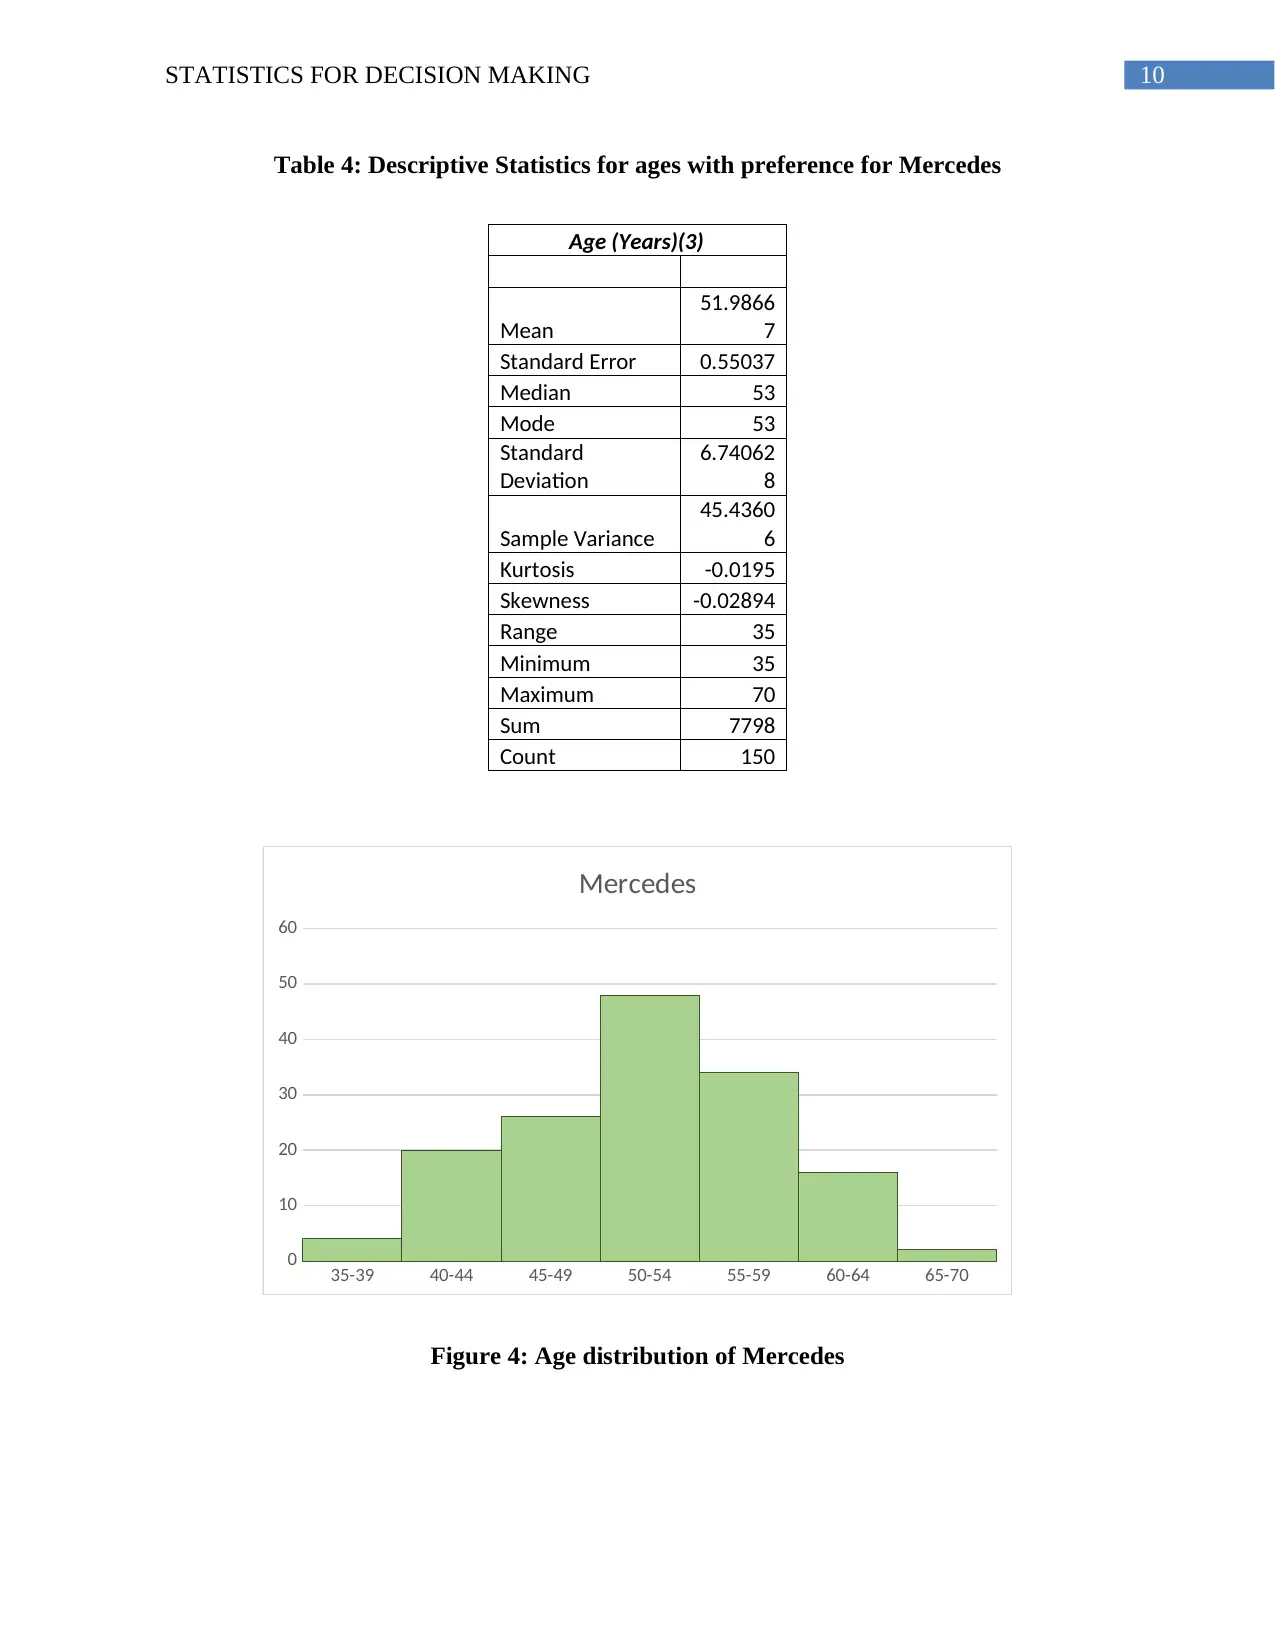
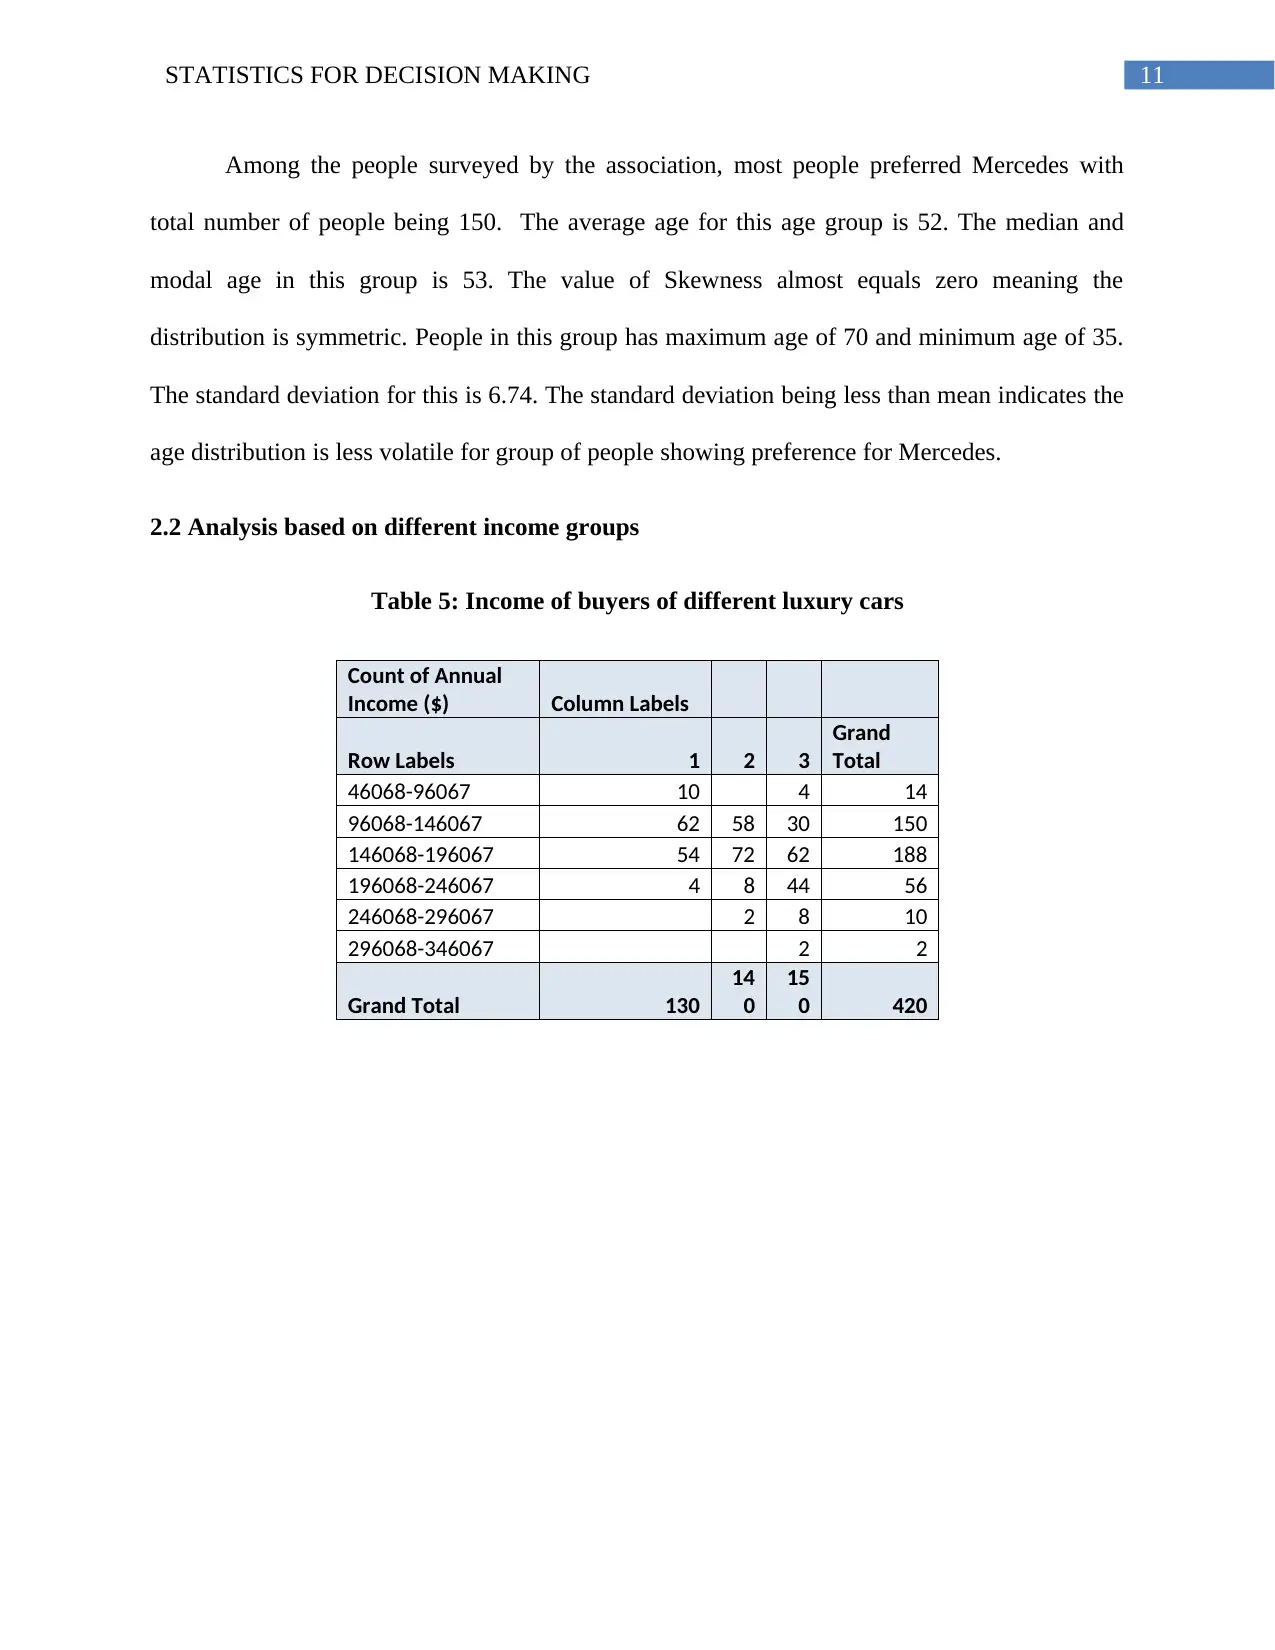
This report analyzes the factors influencing the demand for luxury cars, specifically BMW, Lexus, and Mercedes, based on customer age, income, and education levels. A survey of 420 people reveals that Mercedes is the most preferred, followed by Lexus and BMW. BMW buyers tend to be younger with lower incomes and fewer years of education, while Mercedes buyers are older with higher incomes and more education. The report uses statistical measures to analyze the distribution of age, income, and education years for each car model, finding significant differences in average age (45 for BMW, 50 for Lexus, 52 for Mercedes) and income ($139271 for BMW, $154186 for Lexus, $184423 for Mercedes). Regression analysis supports the conclusion that older individuals with higher incomes and more education are more likely to prefer Mercedes over BMW or Lexus.

Running Head: STATISTICS FOR DECISION MAKING
Statistics for Decision Making
Name of the Student
Name of the University
Course ID
Statistics for Decision Making
Name of the Student
Name of the University
Course ID
Paraphrase This Document
Need a fresh take? Get an instant paraphrase of this document with our AI Paraphraser

1STATISTICS FOR DECISION MAKING
Executive Summary
In general, there are different factors that influence demand of a particular good. When it comes
to luxury cars, the choice of specific cars depends on specific taste and preferences of customers.
Despite having almost same price with same features choices differ based on preferences. Sellers
often face problems in determining particular targeted group of buyers for a particular model.
The report analyzes the business problem related to designing marketing strategy of different
luxury cars. The three chosen car models are BMW, Lexus and Mercedes. Along with choice of
cars, customers’ profiles are considered in terms of age, income and education years. Total 420
people are surveyed to have an idea regarding choices of three different models. In the sample
surveyed maximum number of people prefer Mercedes followed by Lexus and BMW. In case of
BMW buyers are relatively younger with a relatively lower income and lesser education years.
Buyers of Mercedes are mostly older people with a relatively higher income and higher
education years. The business problem is again analyzed in reference statistical problem like
finding out the location, shape and variability of the distribution of age, income and years of
education. The distribution of three different variables differs for the three different car models.
The average age for buyers of BMW cars is 45 years while that for Lexus and Mercedes are 50
and 52 years respectively. Buyers of BMW, Lexus and Mercedes have a respective income of
139271 dollars, 154186 dollars and 184423 dollars. The average education years for BMW,
Lexus and Mercedes car are almost same and is equal to 16 years. Average age, income and
education years differs significantly among the three chosen group of buyers. The regression
model confirms that older with having a higher income and higher education years prefers
Mercedes to BMW or Lexus.

2STATISTICS FOR DECISION MAKING
⊘ This is a preview!⊘
Do you want full access?
Subscribe today to unlock all pages.

Trusted by 1+ million students worldwide

3STATISTICS FOR DECISION MAKING
Table of Contents
1. Introduction..................................................................................................................................3
1.1 Business Problem...................................................................................................................3
1.2 Statistical Problem.................................................................................................................3
2. Analysis.......................................................................................................................................4
2.1 Output based on different age groups....................................................................................4
2.2 Analysis based on different income groups...........................................................................9
2.3 Output based on various education years............................................................................14
2.4 Hypothesis testing 4.............................................................................................................19
2.5 Hypothesis testing 5.............................................................................................................20
2.6 Hypothesis testing 6.............................................................................................................21
2.7 Hypothesis testing 7.............................................................................................................22
3. Conclusion and Recommendation.............................................................................................24
Paraphrase This Document
Need a fresh take? Get an instant paraphrase of this document with our AI Paraphraser

4STATISTICS FOR DECISION MAKING
1. Introduction
1.1 Business Problem
The Automobile Association attempts to analyze demand for different luxury cars.
Demand are analyzed among households having different ages, incomes and education years.
The business aims to find out preferences for BMW, Lexus and Mercedes among different
households. The business problem is to understand how age, income and education years’
influence the purchasing decision of different luxury cars. More specifically, the objective is to
analyze preference of buyers for the three different car models based on their age, income and
education. The information regarding customers’ profile of specific car model is helpful for
Automobile businesses to determine specific strategy.
1.2 Statistical Problem
The business problem is to be evaluated in light of statistical knowledge and
interpretation. In order to determine specific form of distribution for age, income and education
years including location and shape of the distribution various measures of central tendency and
dispersions have been used. The association is willing to know whether buyers if BMW, Lexus
and Mercedes have different average ages, average income and average education years.
Hypothesis testing is done to find out whether average age, income and education years differ
significantly among three different group of buyers. Logistic regression is conducted to test the
claim that older people with higher income and higher education mostly prefer Mercedes over
BMW and Lexus.

5STATISTICS FOR DECISION MAKING
2. Analysis
2.1 Output based on different age groups
Table 1: Ages of buyers of different luxury cars
Count of Age
(Years) Column Labels
Row Labels 1 2 3
Grand
Total
35-39 6 6 4 16
40-44 52 14 20 86
45-49 52 46 26 124
50-54 14 36 48 98
55-59 6 28 34 68
60-64 6 16 22
65-70 4 2 6
Grand Total 130
14
0
15
0 420
35-39 40-44 45-49 50-54 55-59 60-64 65-70
0
10
20
30
40
50
60
1
2
3
Figure 1: Ages of buyers of different luxury cars
The ages are divided into seven groups ranging between 35 and 70. For the age groups 35-39,
there are 6 people preferring BMW, 6 people preferring Lexis and 4 people preferring Mercedes.
In the age group 40-44, maximum number of people prefer BMW followed by Mercedes and
⊘ This is a preview!⊘
Do you want full access?
Subscribe today to unlock all pages.

Trusted by 1+ million students worldwide

6STATISTICS FOR DECISION MAKING
Lexus. In the age group 45-49, most people prefers BMW followed by Lexus and Mercedes. As
the age increases preference for Mercedes increases. In the age group 50-54, there are 48 people
preferring Mercedes. In the age group 55-59, there are 34 people preferring Mercedes. In the two
higher age group 60-64 and 65-70 there are no people who prefer Mercedes.
Table 2: Descriptive Statistics for ages with preference for BMW
Age (Years) (1)
Mean
45.2153
8
Standard Error
0.38190
8
Median 45
Mode 46
Standard
Deviation
4.35442
3
Sample Variance 18.961
Kurtosis 0.04742
Skewness
0.50865
5
Range 21
Minimum 36
Maximum 57
Sum 5878
Count 130
Paraphrase This Document
Need a fresh take? Get an instant paraphrase of this document with our AI Paraphraser

7STATISTICS FOR DECISION MAKING
36-39 40-43 44-47 48-51 52-55 56-59
0
5
10
15
20
25
30
35
40
45
50
BMW
Figure 2: Age distribution of BMW
There are total 130 people showing their preference for BMW cars. The average age for this age
group is 45. The median age in this group is 45. The mode value is 46 meaning most people in
this age group is aged 46. People in this age group lies in the age between 36 and 57. The
standard deviation for this group is 4.35. The standard deviation being less than mean indicates
the age distribution is less volatile for group of people preferring BMW. The value of Skewness
is 0.51. The positive value of skewness implies that the distribution of age in this group is
positively skewed.
Table 3: Descriptive Statistics for ages with preference for Lexus
Age (Years) (2)
Mean
50.4571
4
Standard Error
0.51547
2
Median 50
Mode 55
Standard 6.09914

8STATISTICS FOR DECISION MAKING
Deviation 7
Sample Variance
37.1995
9
Kurtosis
0.61121
4
Skewness
0.36026
2
Range 32
Minimum 36
Maximum 68
Sum 7064
Count 140
36-40 41-45 46-50 51-55 56-60 61-65 66-70
0
5
10
15
20
25
30
35
40
45
50
Lexus
Figure 3: Age distribution of Lexus
There are total 140 people showing their preference for Lexus cars. The average age for this age
group is 50. The median age in this group is 50. The mode value is 55 meaning most people in
this age group is aged 55. People in this age group lies in the age between 32 and 36. The
standard deviation for this group is 6.09. The standard deviation being less than mean indicates
the age distribution is less volatile for group of people preferring Lexus. The value of Skewness
is 0.36. The distribution is almost symmetric.
⊘ This is a preview!⊘
Do you want full access?
Subscribe today to unlock all pages.

Trusted by 1+ million students worldwide

9STATISTICS FOR DECISION MAKING
Paraphrase This Document
Need a fresh take? Get an instant paraphrase of this document with our AI Paraphraser

10STATISTICS FOR DECISION MAKING
Table 4: Descriptive Statistics for ages with preference for Mercedes
Age (Years)(3)
Mean
51.9866
7
Standard Error 0.55037
Median 53
Mode 53
Standard
Deviation
6.74062
8
Sample Variance
45.4360
6
Kurtosis -0.0195
Skewness -0.02894
Range 35
Minimum 35
Maximum 70
Sum 7798
Count 150
35-39 40-44 45-49 50-54 55-59 60-64 65-70
0
10
20
30
40
50
60
Mercedes
Figure 4: Age distribution of Mercedes

11STATISTICS FOR DECISION MAKING
Among the people surveyed by the association, most people preferred Mercedes with
total number of people being 150. The average age for this age group is 52. The median and
modal age in this group is 53. The value of Skewness almost equals zero meaning the
distribution is symmetric. People in this group has maximum age of 70 and minimum age of 35.
The standard deviation for this is 6.74. The standard deviation being less than mean indicates the
age distribution is less volatile for group of people showing preference for Mercedes.
2.2 Analysis based on different income groups
Table 5: Income of buyers of different luxury cars
Count of Annual
Income ($) Column Labels
Row Labels 1 2 3
Grand
Total
46068-96067 10 4 14
96068-146067 62 58 30 150
146068-196067 54 72 62 188
196068-246067 4 8 44 56
246068-296067 2 8 10
296068-346067 2 2
Grand Total 130
14
0
15
0 420
⊘ This is a preview!⊘
Do you want full access?
Subscribe today to unlock all pages.

Trusted by 1+ million students worldwide
1 out of 29
Related Documents

Your All-in-One AI-Powered Toolkit for Academic Success.
 +13062052269
info@desklib.com
Available 24*7 on WhatsApp / Email
Unlock your academic potential
Copyright © 2020–2025 A2Z Services. All Rights Reserved. Developed and managed by ZUCOL.