MA508 Business Statistics: Analyzing Sales & Profitability at ABZ Corp
VerifiedAdded on 2023/06/04
|9
|1569
|173
Report
AI Summary
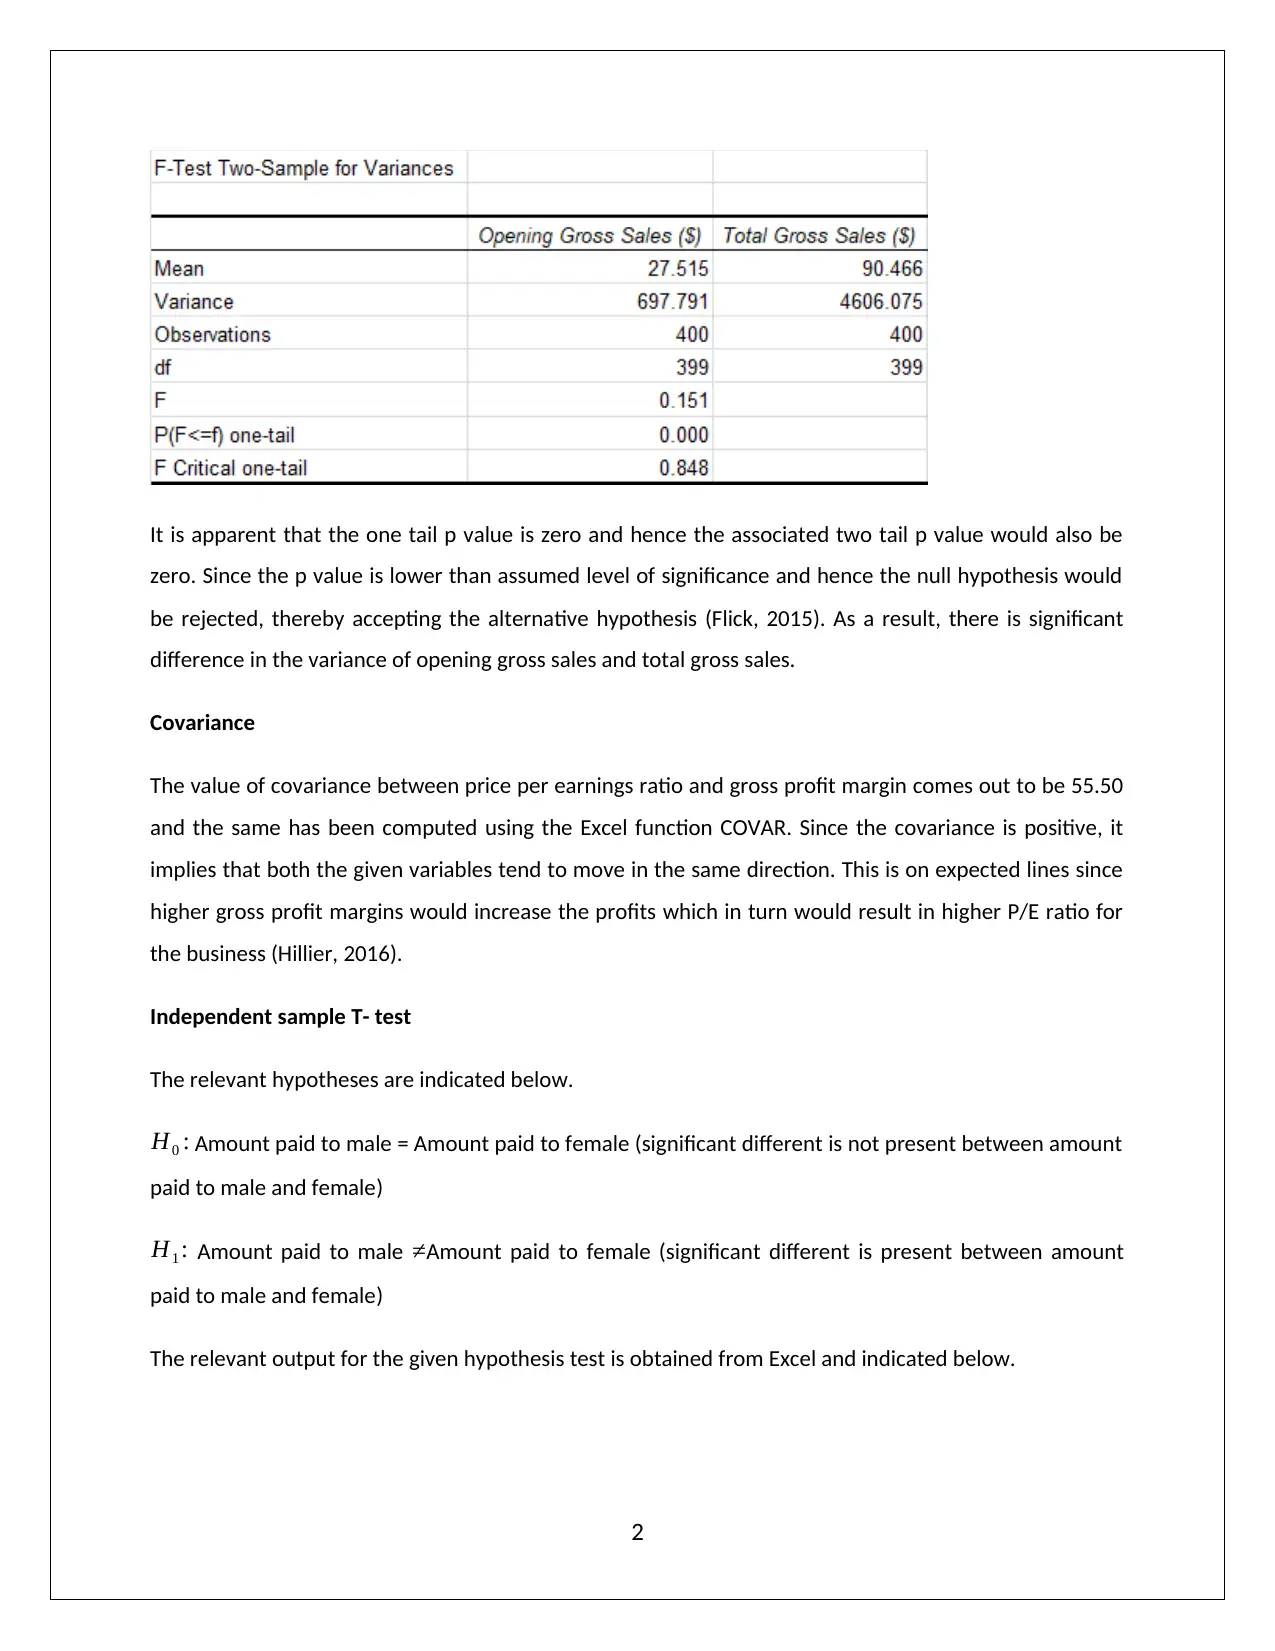
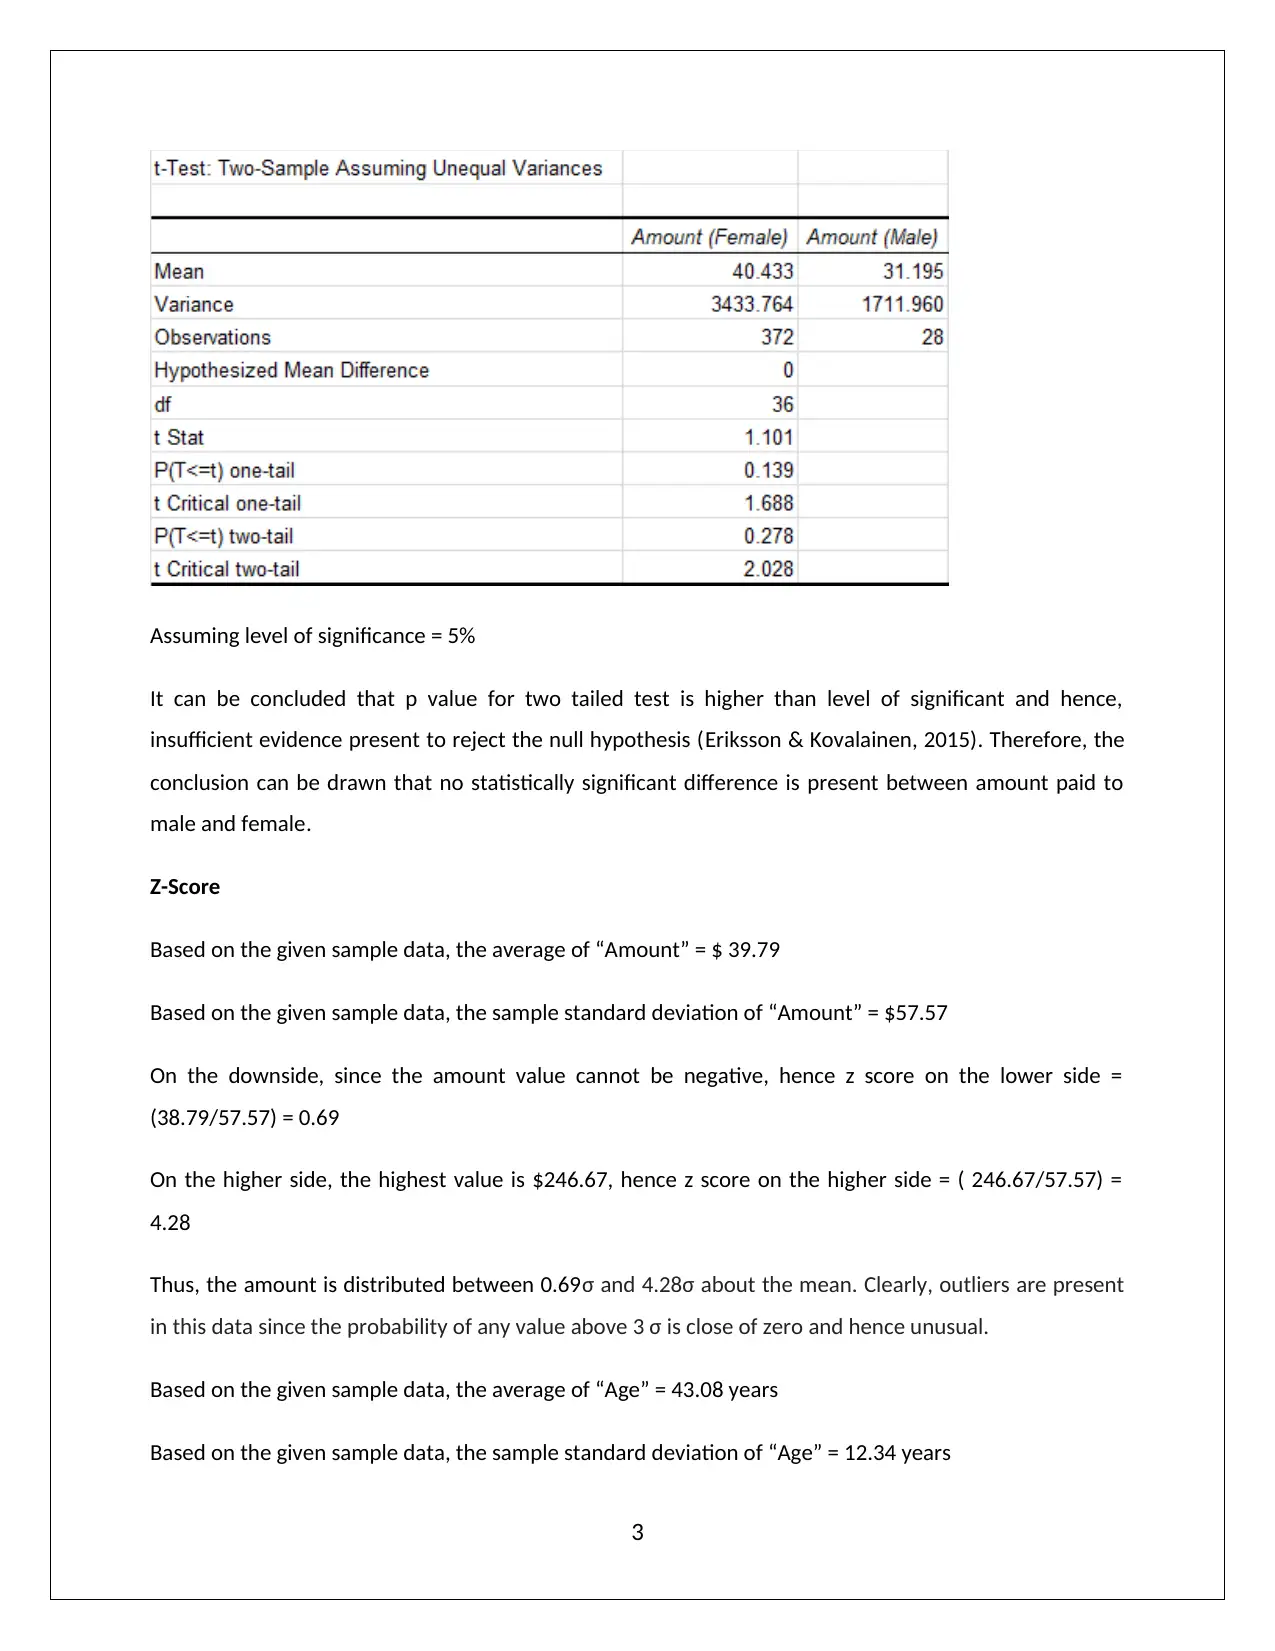
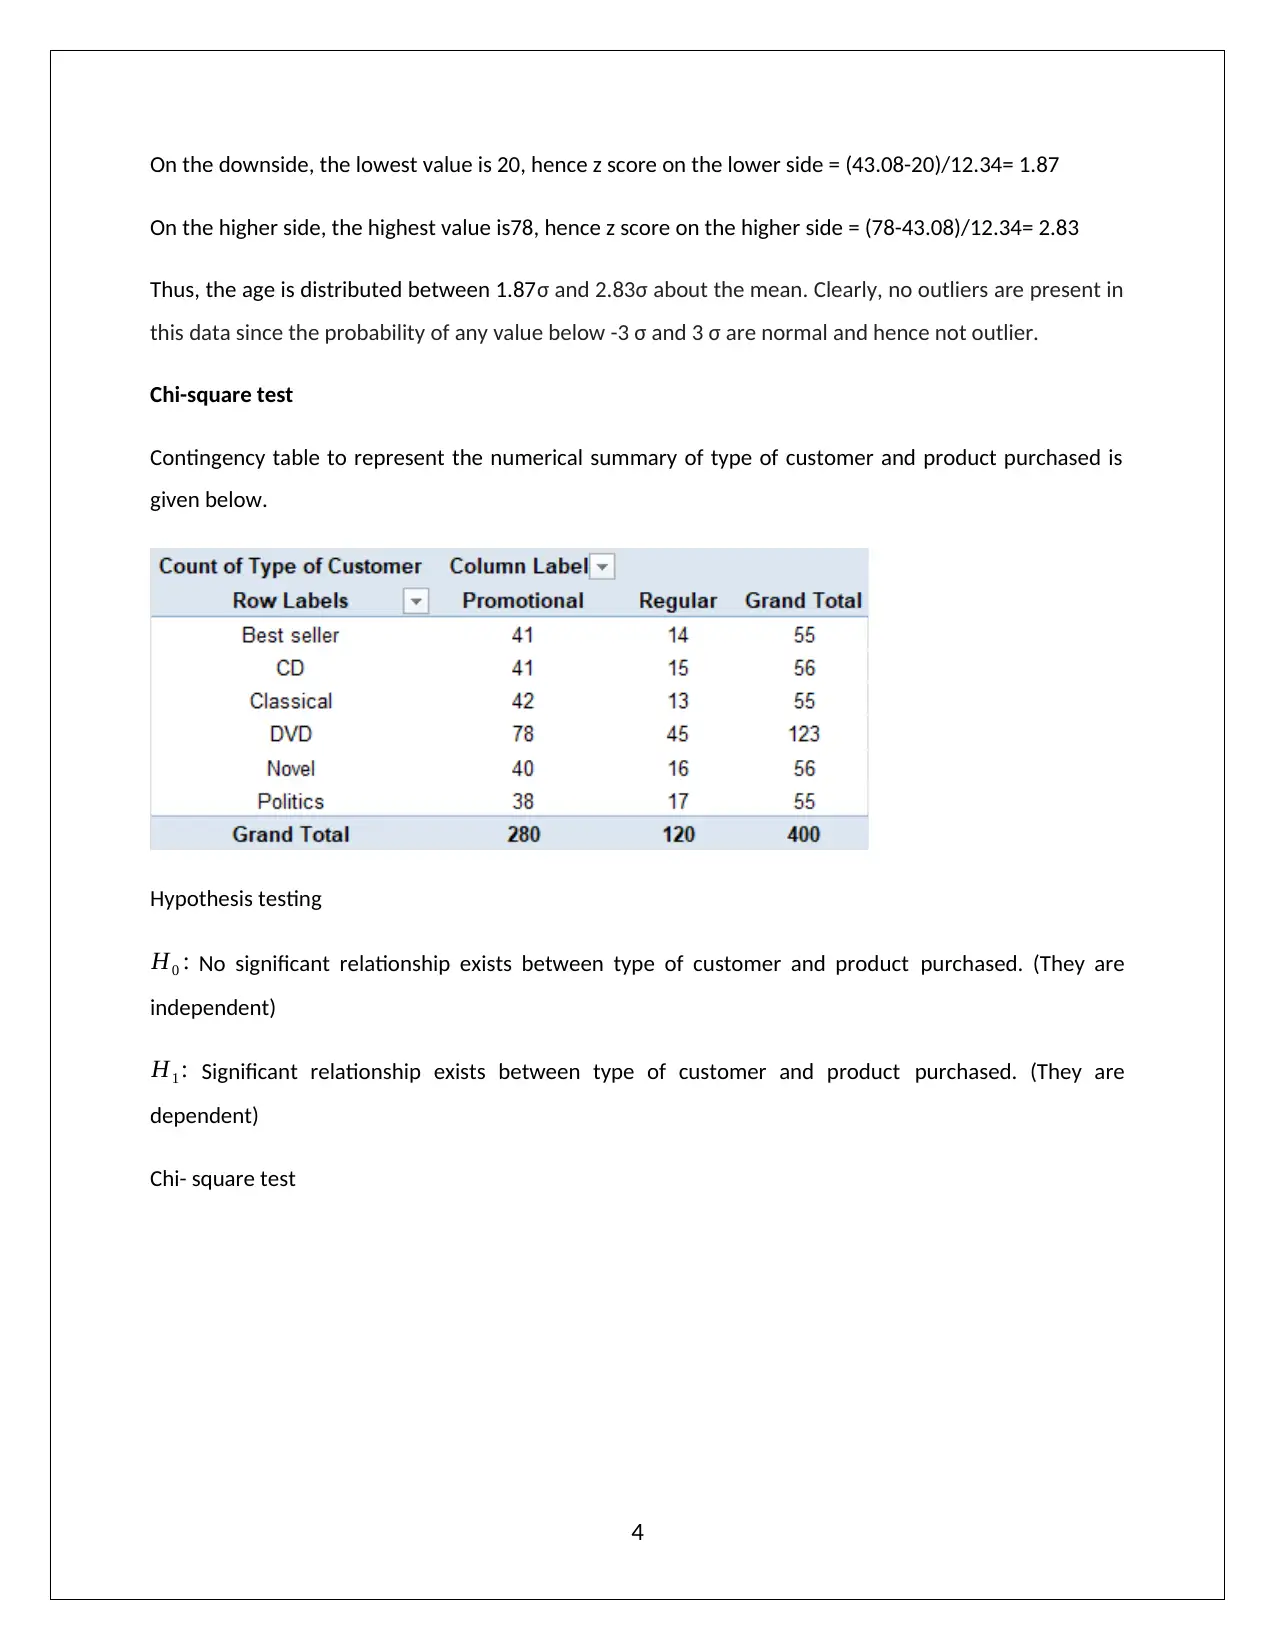
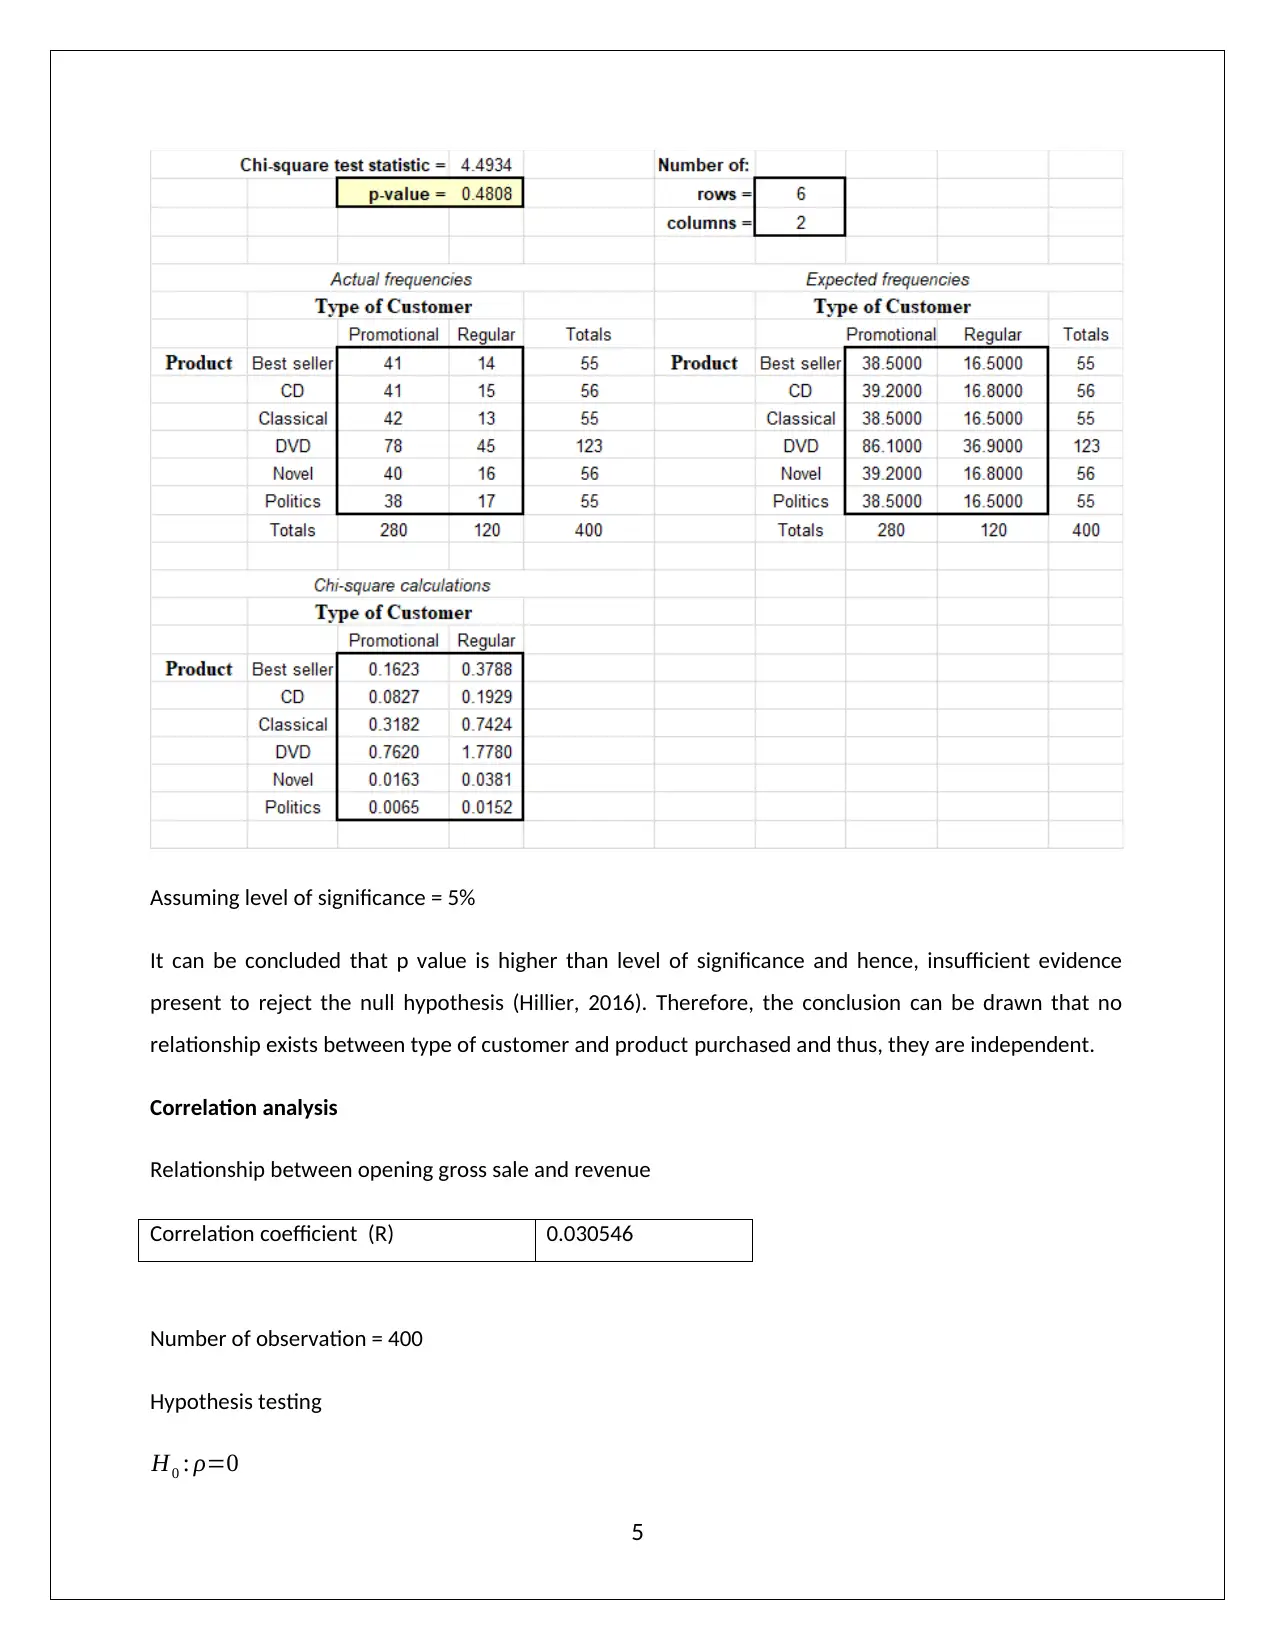
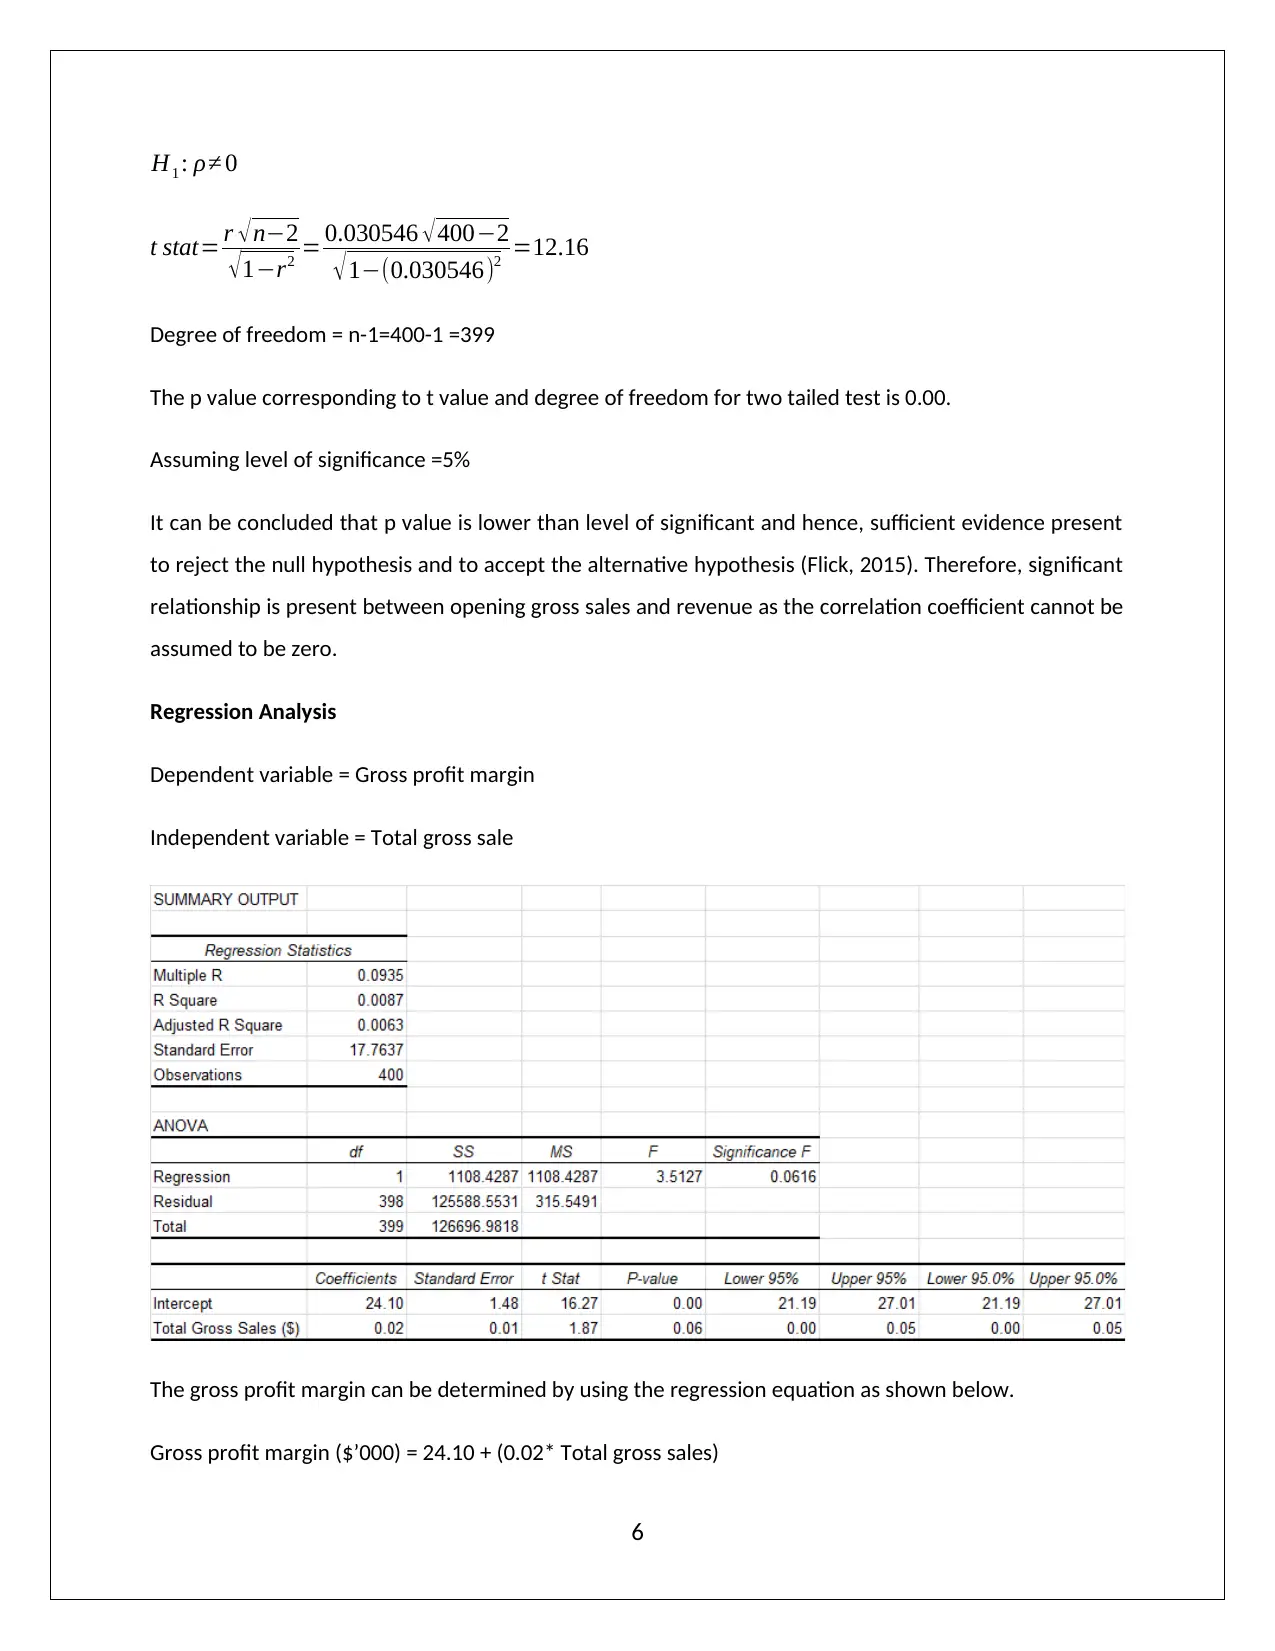
This report addresses declining sales and profit margins at ABZ Corporation by conducting a statistical analysis of customer data. It uses F-tests to compare variance in opening and total gross sales, covariance to relate gross profit margin and P/E ratio, independent sample T-tests to assess gender spending differences, Chi-square tests to determine relationships between customer type and product purchase, correlation analysis to link opening gross sales and revenue, and regression analysis to evaluate the impact of gross sales on gross margins. The findings suggest that sales and profit margins are linked, customer type and purchase are independent, and there are no significant gender spending differences. The report recommends improving sales to boost margins and profitability, highlighting the importance of sales on revenue. The complete report is available on Desklib, where students can access a range of study tools and resources.

BUSINESS STATISTICS
Student ID:
[Pick the date]
Student ID:
[Pick the date]
Paraphrase This Document
Need a fresh take? Get an instant paraphrase of this document with our AI Paraphraser

Introduction
The given scenario pertains to a global corporation i.e. ABZ which is into sales of various products such
as CD/DVD, books.In recent times, the company is facing challenges with regards to falling sales and
reducing profit margins. In order to analyse these problems and provide suggestions, sample data has
been provided with regards to the customer data. This report presents the findings in this regards.
Problem Definition
It is apaprenr that there are two key issues which are faced by the company namely the falling sales and
the falling margins. As a result, statistical test has been condcuted for ascertaining the dioffrence in
variance of opening gross sales and total gross sales. Besides, the relationship between gross profit
margin and P/E ratio is also compared to highlight the nature of their respective movement. Also, in
order to understand the gender implications of amount spent, hypothesis test has been conducted to
reflect whether a particualr gender is a higher spender than the other. Additionally, hypothesis test has
also been ocnducted to ascertain if the product pruchase is related to the type of customer or not. Also,
the relaitonship of opening gross sale and revenue has been critically analysed with suitable hypothesis
test. Finally, the impact of gross sales on gross margins has been analysed through the use of regression.
Variance/Standard deviation
For comparing the variances across the opening gross sales and total gross sales, the F test based
hypothesis test needs to be conducted.
H0: σ²Opening = σ²Total
H1: σ²Opening ≠ σ²Total
The relevant output of the F test obtained from excel for the given data is shown below.
1

It is apparent that the one tail p value is zero and hence the associated two tail p value would also be
zero. Since the p value is lower than assumed level of significance and hence the null hypothesis would
be rejected, thereby accepting the alternative hypothesis (Flick, 2015). As a result, there is significant
difference in the variance of opening gross sales and total gross sales.
Covariance
The value of covariance between price per earnings ratio and gross profit margin comes out to be 55.50
and the same has been computed using the Excel function COVAR. Since the covariance is positive, it
implies that both the given variables tend to move in the same direction. This is on expected lines since
higher gross profit margins would increase the profits which in turn would result in higher P/E ratio for
the business (Hillier, 2016).
Independent sample T- test
The relevant hypotheses are indicated below.
H0 : Amount paid to male = Amount paid to female (significant different is not present between amount
paid to male and female)
H1 : Amount paid to male ≠Amount paid to female (significant different is present between amount
paid to male and female)
The relevant output for the given hypothesis test is obtained from Excel and indicated below.
2
⊘ This is a preview!⊘
Do you want full access?
Subscribe today to unlock all pages.

Trusted by 1+ million students worldwide

Assuming level of significance = 5%
It can be concluded that p value for two tailed test is higher than level of significant and hence,
insufficient evidence present to reject the null hypothesis (Eriksson & Kovalainen, 2015). Therefore, the
conclusion can be drawn that no statistically significant difference is present between amount paid to
male and female.
Z-Score
Based on the given sample data, the average of “Amount” = $ 39.79
Based on the given sample data, the sample standard deviation of “Amount” = $57.57
On the downside, since the amount value cannot be negative, hence z score on the lower side =
(38.79/57.57) = 0.69
On the higher side, the highest value is $246.67, hence z score on the higher side = ( 246.67/57.57) =
4.28
Thus, the amount is distributed between 0.69σ and 4.28σ about the mean. Clearly, outliers are present
in this data since the probability of any value above 3 σ is close of zero and hence unusual.
Based on the given sample data, the average of “Age” = 43.08 years
Based on the given sample data, the sample standard deviation of “Age” = 12.34 years
3
Paraphrase This Document
Need a fresh take? Get an instant paraphrase of this document with our AI Paraphraser

On the downside, the lowest value is 20, hence z score on the lower side = (43.08-20)/12.34= 1.87
On the higher side, the highest value is78, hence z score on the higher side = (78-43.08)/12.34= 2.83
Thus, the age is distributed between 1.87σ and 2.83σ about the mean. Clearly, no outliers are present in
this data since the probability of any value below -3 σ and 3 σ are normal and hence not outlier.
Chi-square test
Contingency table to represent the numerical summary of type of customer and product purchased is
given below.
Hypothesis testing
H0 : No significant relationship exists between type of customer and product purchased. (They are
independent)
H1 : Significant relationship exists between type of customer and product purchased. (They are
dependent)
Chi- square test
4

Assuming level of significance = 5%
It can be concluded that p value is higher than level of significance and hence, insufficient evidence
present to reject the null hypothesis (Hillier, 2016). Therefore, the conclusion can be drawn that no
relationship exists between type of customer and product purchased and thus, they are independent.
Correlation analysis
Relationship between opening gross sale and revenue
Correlation coefficient (R) 0.030546
Number of observation = 400
Hypothesis testing
H0 : ρ=0
5
⊘ This is a preview!⊘
Do you want full access?
Subscribe today to unlock all pages.

Trusted by 1+ million students worldwide

H1 : ρ≠ 0
t stat= r √n−2
√1−r2 = 0.030546 √400−2
√1−(0.030546)2 =12.16
Degree of freedom = n-1=400-1 =399
The p value corresponding to t value and degree of freedom for two tailed test is 0.00.
Assuming level of significance =5%
It can be concluded that p value is lower than level of significant and hence, sufficient evidence present
to reject the null hypothesis and to accept the alternative hypothesis (Flick, 2015). Therefore, significant
relationship is present between opening gross sales and revenue as the correlation coefficient cannot be
assumed to be zero.
Regression Analysis
Dependent variable = Gross profit margin
Independent variable = Total gross sale
The gross profit margin can be determined by using the regression equation as shown below.
Gross profit margin ($’000) = 24.10 + (0.02* Total gross sales)
6
Paraphrase This Document
Need a fresh take? Get an instant paraphrase of this document with our AI Paraphraser

In order to determine if the linear relationship between the two variables is significant or not, the
significance of slope needs to be tested.
H0: β = 0
H1: β ≠0
The t statistic corresponding to the slope of the independent variable is 1.87 with a corresponding p
value of 0.06. Assuming that the significance level is assumed at 10%, it is apparent that the p value
related to the slope coefficient is lower than 0.1 and hence the given evidence is sufficient to reject the
null hypothesis (Hair, Wolfinbarger, Money, Samouel & Page, 2015). As a result, it may be concluded
that the slope coefficient cannot be assumed zero which implies that the total gross sales can be sued to
estimate the gross margins.
Results and Recommendations
Based on the above, it may be concluded that the sales and profit margins are interlinked. Hence, if the
sales are increased, there would higher profit margin. Also, the type of customer and the purchase are
not dependent on each other. Further, there are no significant gender differences with regards to
amount spent and hence the company should not aim to prefer a particular gender over other.
However, there is higher variation in total gross sales as compared to opening gross sales. Besides, the
gross sale has a significant impact on revenue. Hence, it is essential that going forward, the company
must aim to improve the sales as it would lead to higher margins and improve profitability.
7

References
Eriksson, P. & Kovalainen, A. (2015) Quantitative methods in business research 3rd ed. London: Sage
Publications.
Flick, U. (2015) Introducing research methodology: A beginner's guide to doing a research project. 4th
ed. New York: Sage Publications.
Hair, J. F., Wolfinbarger, M., Money, A. H., Samouel, P., & Page, M. J. (2015) Essentials of business
research methods. 2nd ed. New York: Routledge.
Hillier, F. (2016) Introduction to Operations Research 6th ed. New York: McGraw Hill Publications.
8
⊘ This is a preview!⊘
Do you want full access?
Subscribe today to unlock all pages.

Trusted by 1+ million students worldwide
1 out of 9
Related Documents
Your All-in-One AI-Powered Toolkit for Academic Success.
+13062052269
info@desklib.com
Available 24*7 on WhatsApp / Email
Unlock your academic potential
Copyright © 2020–2025 A2Z Services. All Rights Reserved. Developed and managed by ZUCOL.


