MA514 Business Finance: Comprehensive Sydney Housing Market Report
VerifiedAdded on 2023/06/11
|11
|2303
|411
Report
AI Summary
This report provides a comprehensive analysis of the Sydney housing market, focusing on affordability and financial planning for a client aiming to purchase a home. It includes predictions of housing price increases and income growth, based on data from the ABS website. The report details calculations related to savings, tax payments, and loan requirements, considering scenarios with and without insurance premiums. It examines the impact of interest rate changes on mortgage payments and assesses the feasibility of achieving the client's goal of owning a house in Sydney, while also acknowledging potential risks and policy changes that could affect the financial plan. Desklib offers a range of resources including past papers and solved assignments to support students in their studies.
Running head: MASTER OF PROFESSIONAL ACCOUNTING
Master of Professional Accounting
Name of the Student:
Name of the University:
Authors Note:
Master of Professional Accounting
Name of the Student:
Name of the University:
Authors Note:
Paraphrase This Document
Need a fresh take? Get an instant paraphrase of this document with our AI Paraphraser

MASTER OF PROFESSIONAL ACCOUNTING
1
Table of Contents
Answer to question 1:.................................................................................................................2
Answer to question 2:.................................................................................................................3
Answer to question 3:.................................................................................................................4
Answer to question 4:.................................................................................................................5
Answer to question 5:.................................................................................................................6
Answer to question 6:.................................................................................................................7
Answer to question 7:.................................................................................................................8
References:.................................................................................................................................9
MASTER OF PROFESSIONAL ACCOUNTING
2
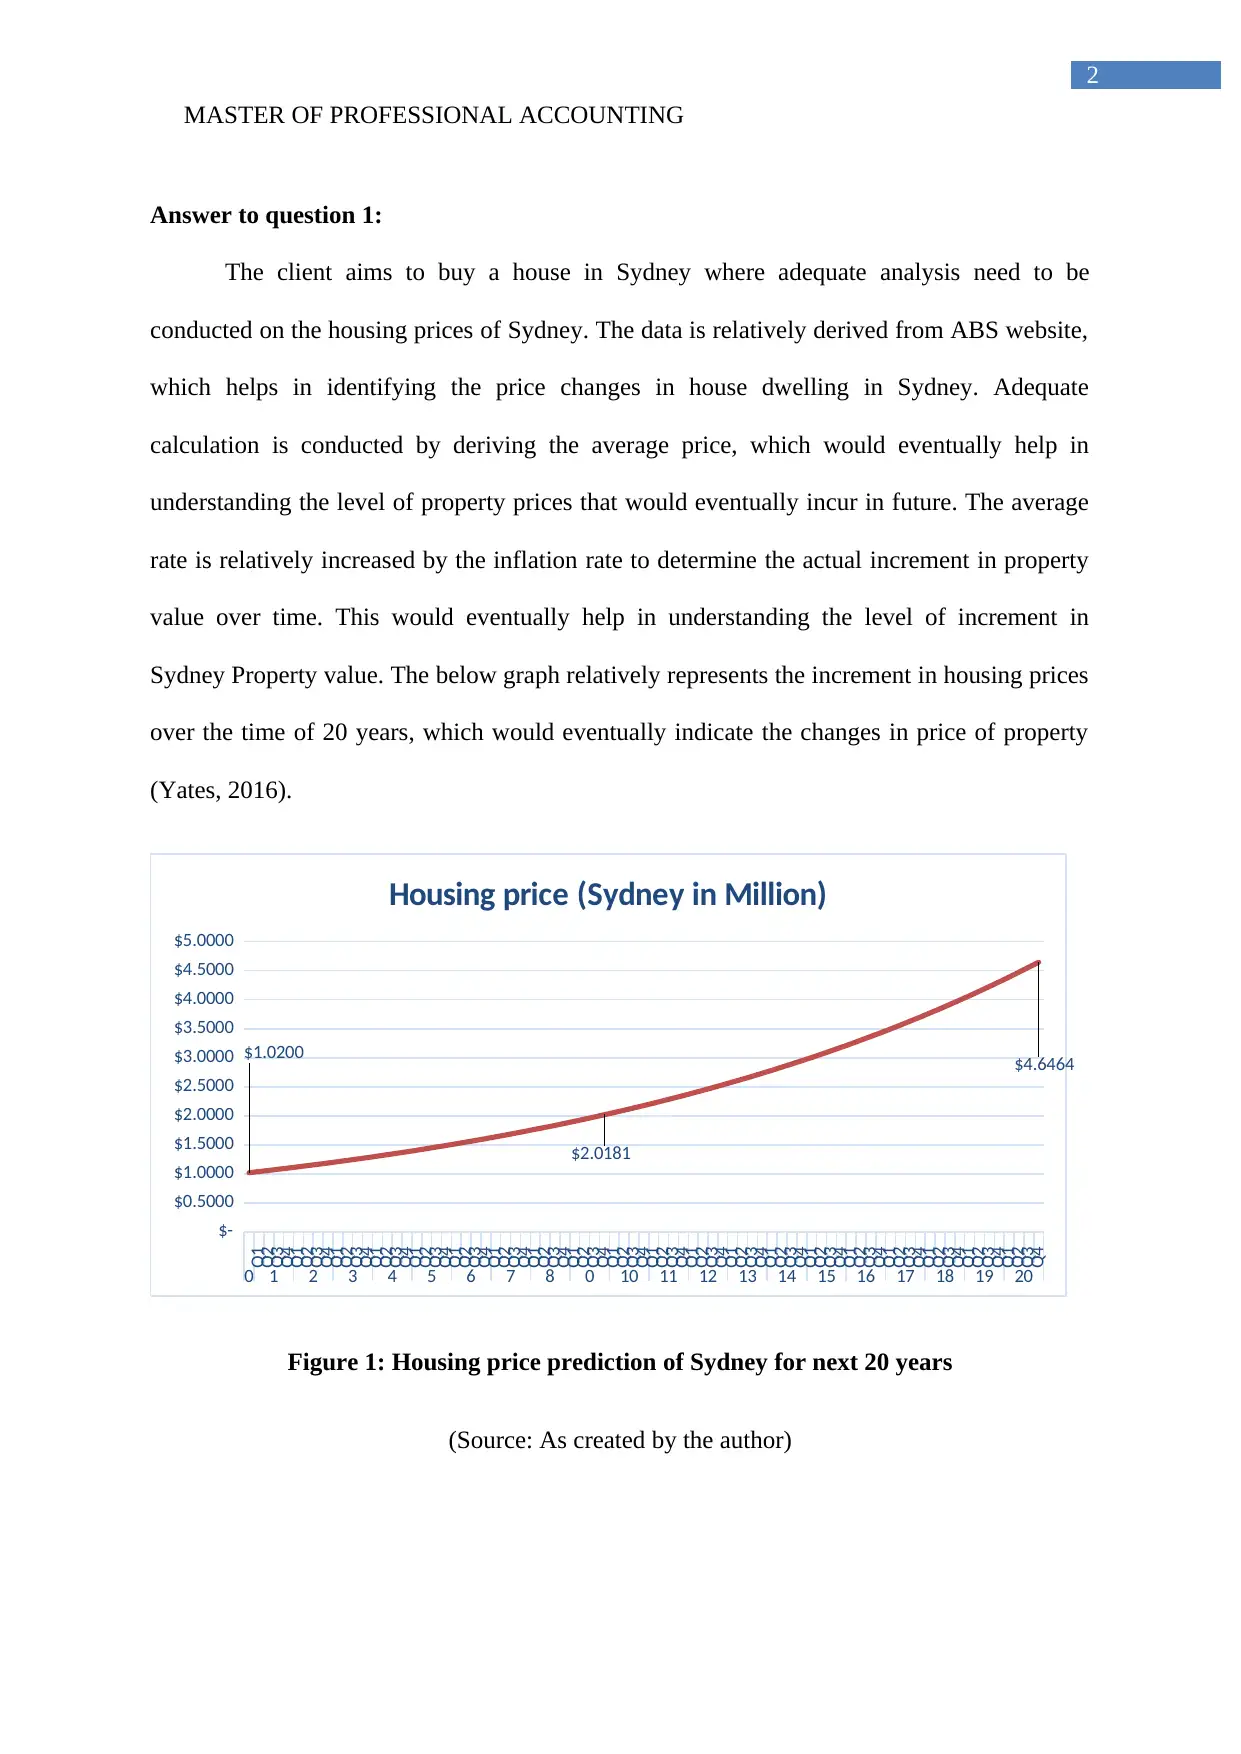
Answer to question 1:
The client aims to buy a house in Sydney where adequate analysis need to be
conducted on the housing prices of Sydney. The data is relatively derived from ABS website,
which helps in identifying the price changes in house dwelling in Sydney. Adequate
calculation is conducted by deriving the average price, which would eventually help in
understanding the level of property prices that would eventually incur in future. The average
rate is relatively increased by the inflation rate to determine the actual increment in property
value over time. This would eventually help in understanding the level of increment in
Sydney Property value. The below graph relatively represents the increment in housing prices
over the time of 20 years, which would eventually indicate the changes in price of property
(Yates, 2016).
Q1
Q2
Q3
Q4
Q1
Q2
Q3
Q4
Q1
Q2
Q3
Q4
Q1
Q2
Q3
Q4
Q1
Q2
Q3
Q4
Q1
Q2
Q3
Q4
Q1
Q2
Q3
Q4
Q1
Q2
Q3
Q4
Q1
Q2
Q3
Q4
Q1
Q2
Q3
Q4
Q1
Q2
Q3
Q4
Q1
Q2
Q3
Q4
Q1
Q2
Q3
Q4
Q1
Q2
Q3
Q4
Q1
Q2
Q3
Q4
Q1
Q2
Q3
Q4
Q1
Q2
Q3
Q4
Q1
Q2
Q3
Q4
Q1
Q2
Q3
Q4
Q1
Q2
Q3
Q4
0 1 2 3 4 5 6 7 8 0 10 11 12 13 14 15 16 17 18 19 20
$-
$0.5000
$1.0000
$1.5000
$2.0000
$2.5000
$3.0000
$3.5000
$4.0000
$4.5000
$5.0000
$1.0200
$2.0181
$4.6464
Housing price (Sydney in Million)
Figure 1: Housing price prediction of Sydney for next 20 years
(Source: As created by the author)
2
Answer to question 1:
The client aims to buy a house in Sydney where adequate analysis need to be
conducted on the housing prices of Sydney. The data is relatively derived from ABS website,
which helps in identifying the price changes in house dwelling in Sydney. Adequate
calculation is conducted by deriving the average price, which would eventually help in
understanding the level of property prices that would eventually incur in future. The average
rate is relatively increased by the inflation rate to determine the actual increment in property
value over time. This would eventually help in understanding the level of increment in
Sydney Property value. The below graph relatively represents the increment in housing prices
over the time of 20 years, which would eventually indicate the changes in price of property
(Yates, 2016).
Q1
Q2
Q3
Q4
Q1
Q2
Q3
Q4
Q1
Q2
Q3
Q4
Q1
Q2
Q3
Q4
Q1
Q2
Q3
Q4
Q1
Q2
Q3
Q4
Q1
Q2
Q3
Q4
Q1
Q2
Q3
Q4
Q1
Q2
Q3
Q4
Q1
Q2
Q3
Q4
Q1
Q2
Q3
Q4
Q1
Q2
Q3
Q4
Q1
Q2
Q3
Q4
Q1
Q2
Q3
Q4
Q1
Q2
Q3
Q4
Q1
Q2
Q3
Q4
Q1
Q2
Q3
Q4
Q1
Q2
Q3
Q4
Q1
Q2
Q3
Q4
Q1
Q2
Q3
Q4
0 1 2 3 4 5 6 7 8 0 10 11 12 13 14 15 16 17 18 19 20
$-
$0.5000
$1.0000
$1.5000
$2.0000
$2.5000
$3.0000
$3.5000
$4.0000
$4.5000
$5.0000
$1.0200
$2.0181
$4.6464
Housing price (Sydney in Million)
Figure 1: Housing price prediction of Sydney for next 20 years
(Source: As created by the author)
⊘ This is a preview!⊘
Do you want full access?
Subscribe today to unlock all pages.
Trusted by 1+ million students worldwide

MASTER OF PROFESSIONAL ACCOUNTING
3
Answer to question 2:
The client relatively gets annual salary of $80,000 which will increase over time to
supporter Austrian dreams. The dream of the client is to buy a house in Australia rather in
Sydney where she is working currently. The estimation of the rising income group in Sydney
is a relatively conducted with the help of data derived from ABS website. The data relatively
helped in detecting the level of income growth which will be obtained by the citizens in
Sydney. This would also imply to the client where her income will grow exponentially over
the period of next 10 years. The calculation is a relatively derived from the per week income
increment over the past 20 years, where adequate to your average is taken, while the
increment in income growth is average to identify the overall growth in income that will be
achieved in Sydney. The below table relatively represents the calculation for income growth
and the graph represents the 20-year predicted income growth of the client (Shi et al., 2016).
Time Income Yearly Income Two Year Avg Income Growth
1994–95 $ 642.0 $ 33,384.0
1995–96 $ 626.0 $ 32,552.0 $ 32,968.0
1996–97 $ 648.0 $ 33,696.0 $ 33,124.0 0.5%
1997–98 $ 664.0 $ 34,528.0 $ 34,112.0 3.0%
1999–2000 $ 692.0 $ 35,984.0 $ 35,256.0 3.4%
2000–01 $ 709.0 $ 36,868.0 $ 36,426.0 3.3%
2002–03 $ 726.0 $ 37,752.0 $ 37,310.0 2.4%
2003–04(a) $ 806.0 $ 41,912.0 $ 39,832.0 6.8%
2005–06(a) $ 870.0 $ 45,240.0 $ 43,576.0 9.4%
2007–08(a) $ 994.0 $ 51,688.0 $ 48,464.0 11.2%
2009–10(a) $ 981.0 $ 51,012.0 $ 51,350.0 6.0%
2011–12(a) $ 1,015.0 $ 52,780.0 $ 51,896.0 1.1%
2013–14(a) $ 1,046.0 $ 54,392.0 $ 53,586.0 3.3%
2015–16(a) $ 1,070.0 $ 55,640.0 $ 55,016.0 2.7%
Paraphrase This Document
Need a fresh take? Get an instant paraphrase of this document with our AI Paraphraser
MASTER OF PROFESSIONAL ACCOUNTING
4
$-
$50,000.0
$100,000.0
$150,000.0
$200,000.0
$250,000.0
$80,000.0
$125,885.1
$193,748.3
Income growth in 20 years
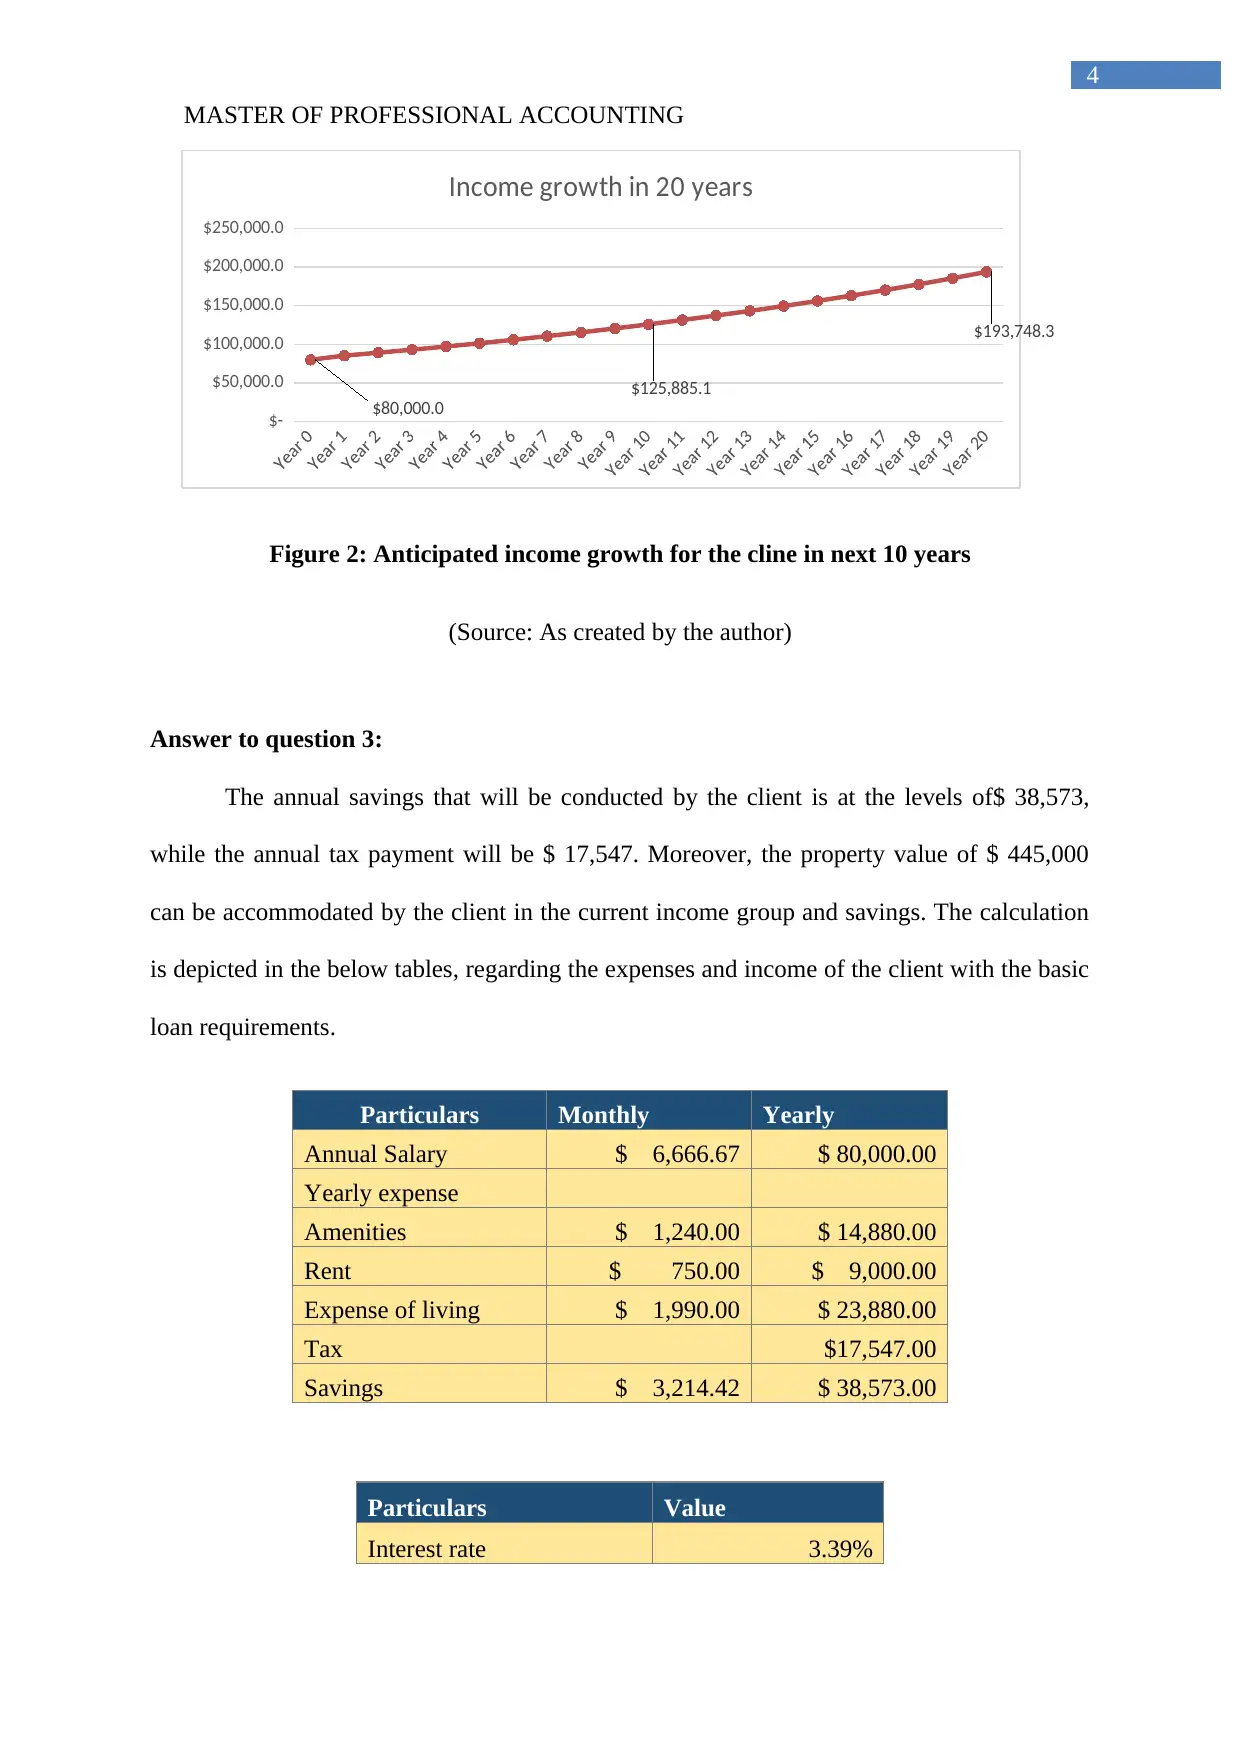
Figure 2: Anticipated income growth for the cline in next 10 years
(Source: As created by the author)
Answer to question 3:
The annual savings that will be conducted by the client is at the levels of$ 38,573,
while the annual tax payment will be $ 17,547. Moreover, the property value of $ 445,000
can be accommodated by the client in the current income group and savings. The calculation
is depicted in the below tables, regarding the expenses and income of the client with the basic
loan requirements.
Particulars Monthly Yearly
Annual Salary $ 6,666.67 $ 80,000.00
Yearly expense
Amenities $ 1,240.00 $ 14,880.00
Rent $ 750.00 $ 9,000.00
Expense of living $ 1,990.00 $ 23,880.00
Tax $17,547.00
Savings $ 3,214.42 $ 38,573.00
Particulars Value
Interest rate 3.39%
4
$-
$50,000.0
$100,000.0
$150,000.0
$200,000.0
$250,000.0
$80,000.0
$125,885.1
$193,748.3
Income growth in 20 years
Figure 2: Anticipated income growth for the cline in next 10 years
(Source: As created by the author)
Answer to question 3:
The annual savings that will be conducted by the client is at the levels of$ 38,573,
while the annual tax payment will be $ 17,547. Moreover, the property value of $ 445,000
can be accommodated by the client in the current income group and savings. The calculation
is depicted in the below tables, regarding the expenses and income of the client with the basic
loan requirements.
Particulars Monthly Yearly
Annual Salary $ 6,666.67 $ 80,000.00
Yearly expense
Amenities $ 1,240.00 $ 14,880.00
Rent $ 750.00 $ 9,000.00
Expense of living $ 1,990.00 $ 23,880.00
Tax $17,547.00
Savings $ 3,214.42 $ 38,573.00
Particulars Value
Interest rate 3.39%
MASTER OF PROFESSIONAL ACCOUNTING
5
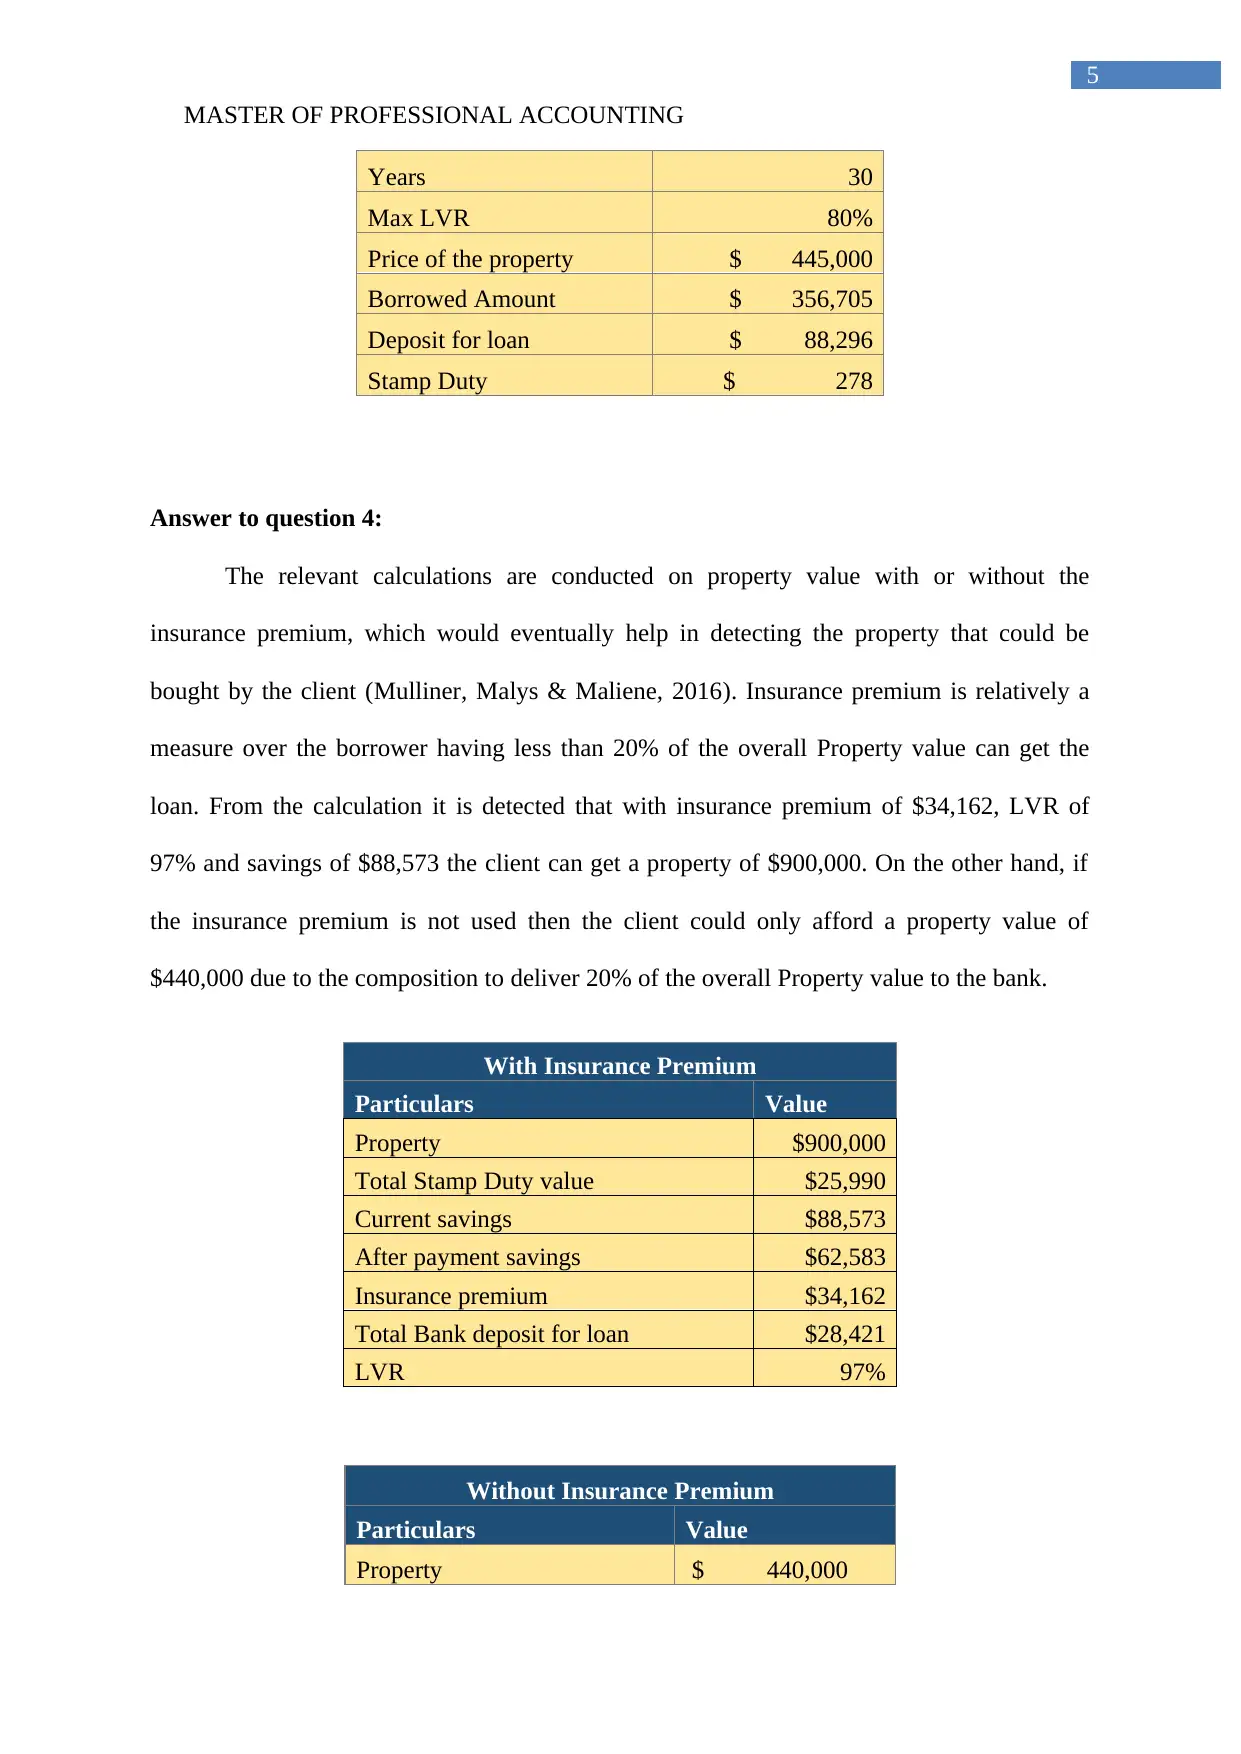
Years 30
Max LVR 80%
Price of the property $ 445,000
Borrowed Amount $ 356,705
Deposit for loan $ 88,296
Stamp Duty $ 278
Answer to question 4:
The relevant calculations are conducted on property value with or without the
insurance premium, which would eventually help in detecting the property that could be
bought by the client (Mulliner, Malys & Maliene, 2016). Insurance premium is relatively a
measure over the borrower having less than 20% of the overall Property value can get the
loan. From the calculation it is detected that with insurance premium of $34,162, LVR of
97% and savings of $88,573 the client can get a property of $900,000. On the other hand, if
the insurance premium is not used then the client could only afford a property value of
$440,000 due to the composition to deliver 20% of the overall Property value to the bank.
With Insurance Premium
Particulars Value
Property $900,000
Total Stamp Duty value $25,990
Current savings $88,573
After payment savings $62,583
Insurance premium $34,162
Total Bank deposit for loan $28,421
LVR 97%
Without Insurance Premium
Particulars Value
Property $ 440,000
5
Years 30
Max LVR 80%
Price of the property $ 445,000
Borrowed Amount $ 356,705
Deposit for loan $ 88,296
Stamp Duty $ 278
Answer to question 4:
The relevant calculations are conducted on property value with or without the
insurance premium, which would eventually help in detecting the property that could be
bought by the client (Mulliner, Malys & Maliene, 2016). Insurance premium is relatively a
measure over the borrower having less than 20% of the overall Property value can get the
loan. From the calculation it is detected that with insurance premium of $34,162, LVR of
97% and savings of $88,573 the client can get a property of $900,000. On the other hand, if
the insurance premium is not used then the client could only afford a property value of
$440,000 due to the composition to deliver 20% of the overall Property value to the bank.
With Insurance Premium
Particulars Value
Property $900,000
Total Stamp Duty value $25,990
Current savings $88,573
After payment savings $62,583
Insurance premium $34,162
Total Bank deposit for loan $28,421
LVR 97%
Without Insurance Premium
Particulars Value
Property $ 440,000
⊘ This is a preview!⊘
Do you want full access?
Subscribe today to unlock all pages.
Trusted by 1+ million students worldwide

MASTER OF PROFESSIONAL ACCOUNTING
6
Total Stamp Duty value $ 278
Total cost $ 440,278
Deposit for loan $ 88,000
Savings $ 88,573
Extra amount $ 573
Answer to question 5:
The tables below relatively represent the overall calculation for upfront payment of
20% and upfront payment of 5% that could be conducted by the client. The tables relatively
represent the mid value in which the client could buy the property with adequate savings.
From the valuation it could be identified that with the 5% of friend payment declined could
effectively by the house in 3rd year. On the other hand, the calculations are relatively
representing that due to low saving the client can obtain the property with an upfront payment
of 20% during 6th year.
Ye
ar
Property
price
Savings
Target
5%
upfront
Insurance
premium
Stamp
duty Amount
0
$
1,020,000
$
88,573
$
51,000
$
44,454
$
31,868
$
(38,749)
1
$
1,069,735
$
130,318
$
53,487
$
46,622
$
33,909
$
(3,700)
2
$
1,153,990
$
174,124
$
57,700
$
50,294
$
37,368
$
28,762
3
$
1,244,882
$
219,818
$
62,244
$
54,255
$
41,099
$
62,220
4
$
1,342,932
$
267,597
$
67,147
$
58,529
$
45,123
$
96,799
5
$
1,448,704
$
317,565
$
72,435
$
63,138
$
49,465
$
132,527
6
$
1,562,808
$
369,832
$
78,140
$
68,111
$
54,149
$
169,432
7
$
1,685,899
$
424,511
$
84,295
$
73,476
$
59,201
$
207,539
Yea
r
Property
price
Savings
Target 20% upfront Stamp duty Difference
6
Total Stamp Duty value $ 278
Total cost $ 440,278
Deposit for loan $ 88,000
Savings $ 88,573
Extra amount $ 573
Answer to question 5:
The tables below relatively represent the overall calculation for upfront payment of
20% and upfront payment of 5% that could be conducted by the client. The tables relatively
represent the mid value in which the client could buy the property with adequate savings.
From the valuation it could be identified that with the 5% of friend payment declined could
effectively by the house in 3rd year. On the other hand, the calculations are relatively
representing that due to low saving the client can obtain the property with an upfront payment
of 20% during 6th year.
Ye
ar
Property
price
Savings
Target
5%
upfront
Insurance
premium
Stamp
duty Amount
0
$
1,020,000
$
88,573
$
51,000
$
44,454
$
31,868
$
(38,749)
1
$
1,069,735
$
130,318
$
53,487
$
46,622
$
33,909
$
(3,700)
2
$
1,153,990
$
174,124
$
57,700
$
50,294
$
37,368
$
28,762
3
$
1,244,882
$
219,818
$
62,244
$
54,255
$
41,099
$
62,220
4
$
1,342,932
$
267,597
$
67,147
$
58,529
$
45,123
$
96,799
5
$
1,448,704
$
317,565
$
72,435
$
63,138
$
49,465
$
132,527
6
$
1,562,808
$
369,832
$
78,140
$
68,111
$
54,149
$
169,432
7
$
1,685,899
$
424,511
$
84,295
$
73,476
$
59,201
$
207,539
Yea
r
Property
price
Savings
Target 20% upfront Stamp duty Difference
Paraphrase This Document
Need a fresh take? Get an instant paraphrase of this document with our AI Paraphraser
MASTER OF PROFESSIONAL ACCOUNTING
7
0
$
1,020,000
$
88,573
$
204,000
$
31,868
$
(147,295)
1
$
1,069,735
$
130,318
$
213,947
$
33,909
$
(117,538)
2
$
1,153,990
$
174,124
$
230,798
$
37,368
$
(94,042)
3
$
1,244,882
$
219,818
$
248,976
$
41,099
$
(70,257)
4
$
1,342,932
$
267,597
$
268,586
$
45,123
$
(46,113)
5
$
1,448,704
$
317,565
$
289,741
$
49,465
$
(21,640)
6
$
1,562,808
$
369,832
$
312,562
$
54,149
$
3,122
7
$
1,685,899
$
424,511
$
337,180
$
59,201
$
28,130
8
$
1,818,685
$
481,721
$
363,737
$
64,652
$
53,332
9
$
1,961,929
$
541,586
$
392,386
$
70,531
$
78,669
10
$
2,116,455
$
604,238
$
423,291
$
76,874
$
104,073
11
$
2,283,153
$
669,813
$
456,631
$
83,717
$
129,465
12
$
2,462,980
$
738,453
$
492,596
$
91,098
$
154,759
13
$
2,656,970
$
810,307
$
531,394
$
99,061
$
179,852
14
$
2,866,240
$
885,533
$
573,248
$
107,651
$
204,634
15
$
3,091,992
$
964,292
$
618,398
$
116,917
$
228,977
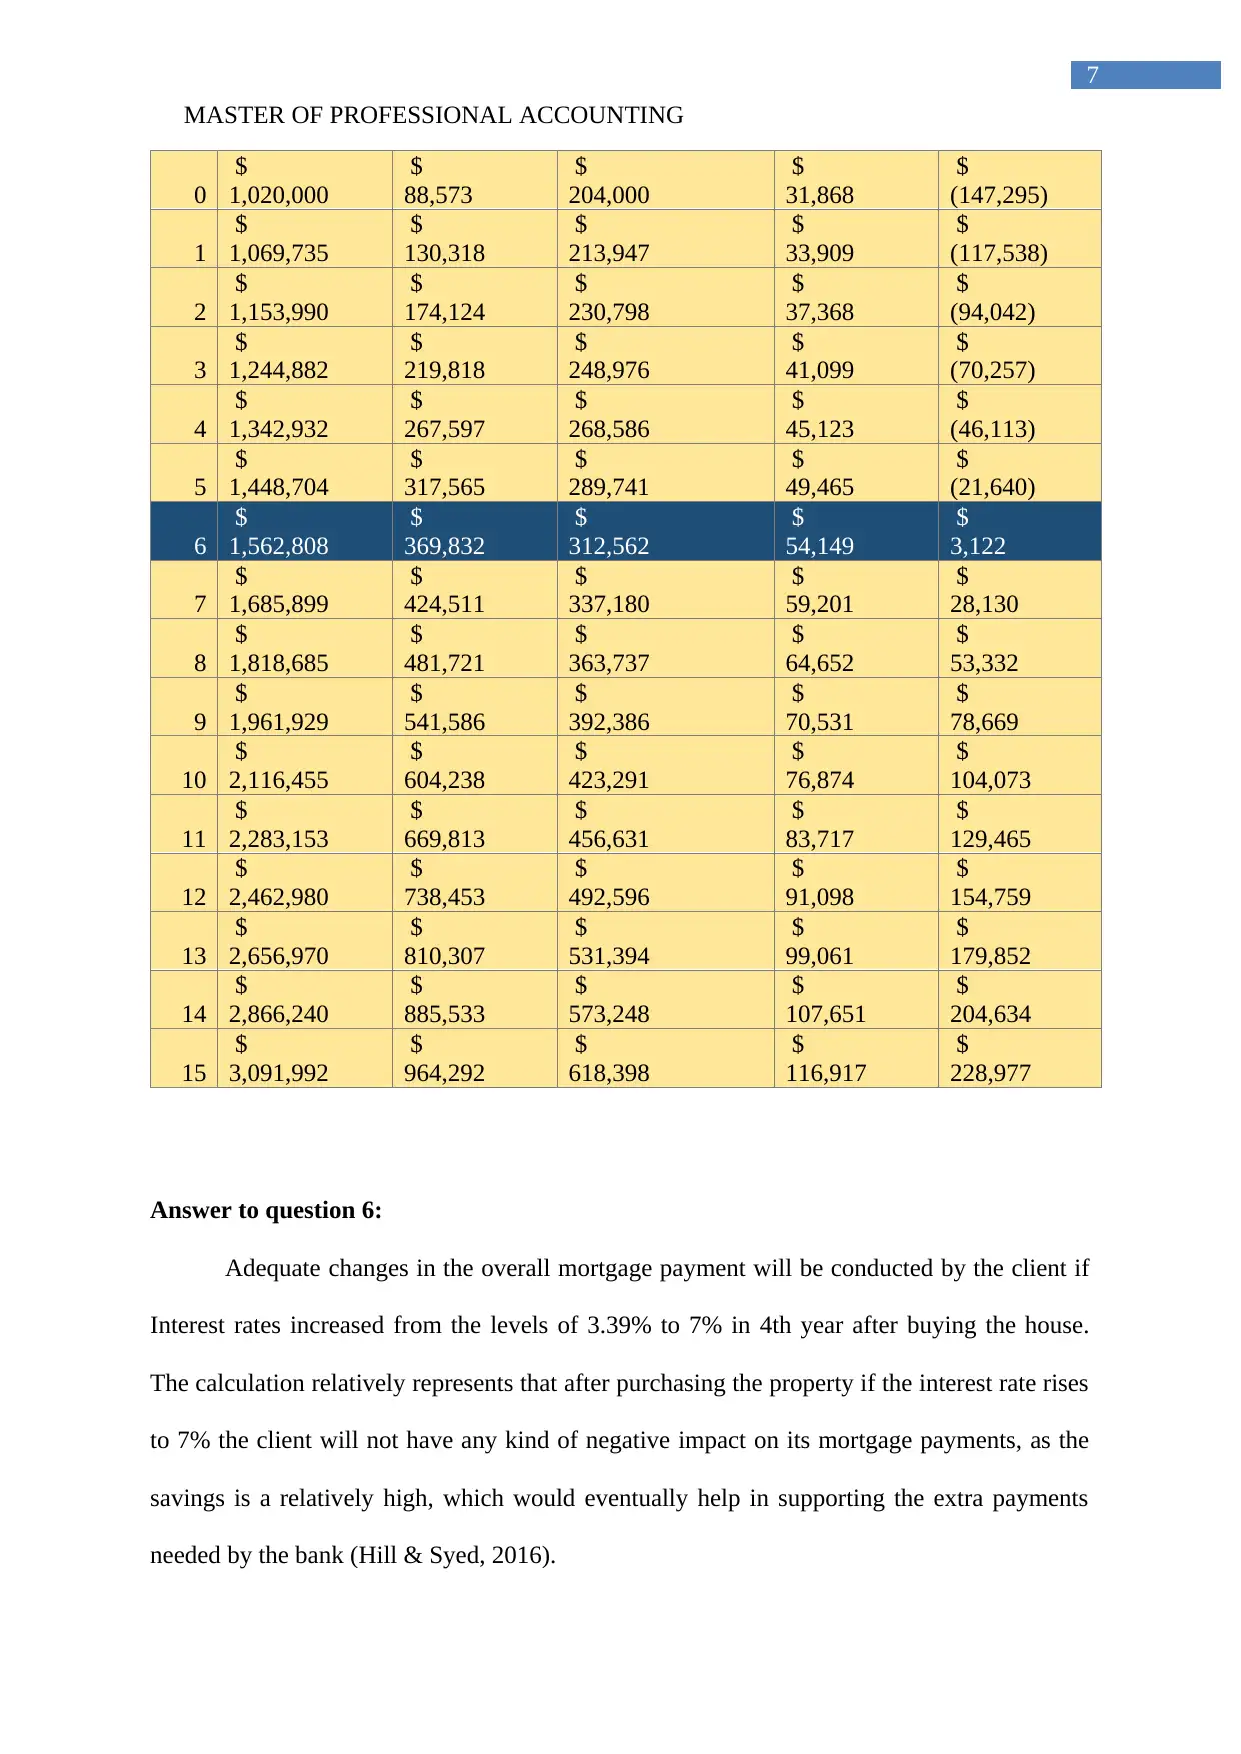
Answer to question 6:
Adequate changes in the overall mortgage payment will be conducted by the client if
Interest rates increased from the levels of 3.39% to 7% in 4th year after buying the house.
The calculation relatively represents that after purchasing the property if the interest rate rises
to 7% the client will not have any kind of negative impact on its mortgage payments, as the
savings is a relatively high, which would eventually help in supporting the extra payments
needed by the bank (Hill & Syed, 2016).
7
0
$
1,020,000
$
88,573
$
204,000
$
31,868
$
(147,295)
1
$
1,069,735
$
130,318
$
213,947
$
33,909
$
(117,538)
2
$
1,153,990
$
174,124
$
230,798
$
37,368
$
(94,042)
3
$
1,244,882
$
219,818
$
248,976
$
41,099
$
(70,257)
4
$
1,342,932
$
267,597
$
268,586
$
45,123
$
(46,113)
5
$
1,448,704
$
317,565
$
289,741
$
49,465
$
(21,640)
6
$
1,562,808
$
369,832
$
312,562
$
54,149
$
3,122
7
$
1,685,899
$
424,511
$
337,180
$
59,201
$
28,130
8
$
1,818,685
$
481,721
$
363,737
$
64,652
$
53,332
9
$
1,961,929
$
541,586
$
392,386
$
70,531
$
78,669
10
$
2,116,455
$
604,238
$
423,291
$
76,874
$
104,073
11
$
2,283,153
$
669,813
$
456,631
$
83,717
$
129,465
12
$
2,462,980
$
738,453
$
492,596
$
91,098
$
154,759
13
$
2,656,970
$
810,307
$
531,394
$
99,061
$
179,852
14
$
2,866,240
$
885,533
$
573,248
$
107,651
$
204,634
15
$
3,091,992
$
964,292
$
618,398
$
116,917
$
228,977
Answer to question 6:
Adequate changes in the overall mortgage payment will be conducted by the client if
Interest rates increased from the levels of 3.39% to 7% in 4th year after buying the house.
The calculation relatively represents that after purchasing the property if the interest rate rises
to 7% the client will not have any kind of negative impact on its mortgage payments, as the
savings is a relatively high, which would eventually help in supporting the extra payments
needed by the bank (Hill & Syed, 2016).
MASTER OF PROFESSIONAL ACCOUNTING
8
Year Interest rate Mortgage Payment Saved Savings
4 3.39% $62,859 $ 119,729 $56,871
5 3.39% $62,859 $116,761 $53,903
6 3.39% $62,859 $116,287 $53,428
7 7.00% $94,417 $118,424 $24,006
Property value
$
1,244,882
Loan amount
$
1,182,638
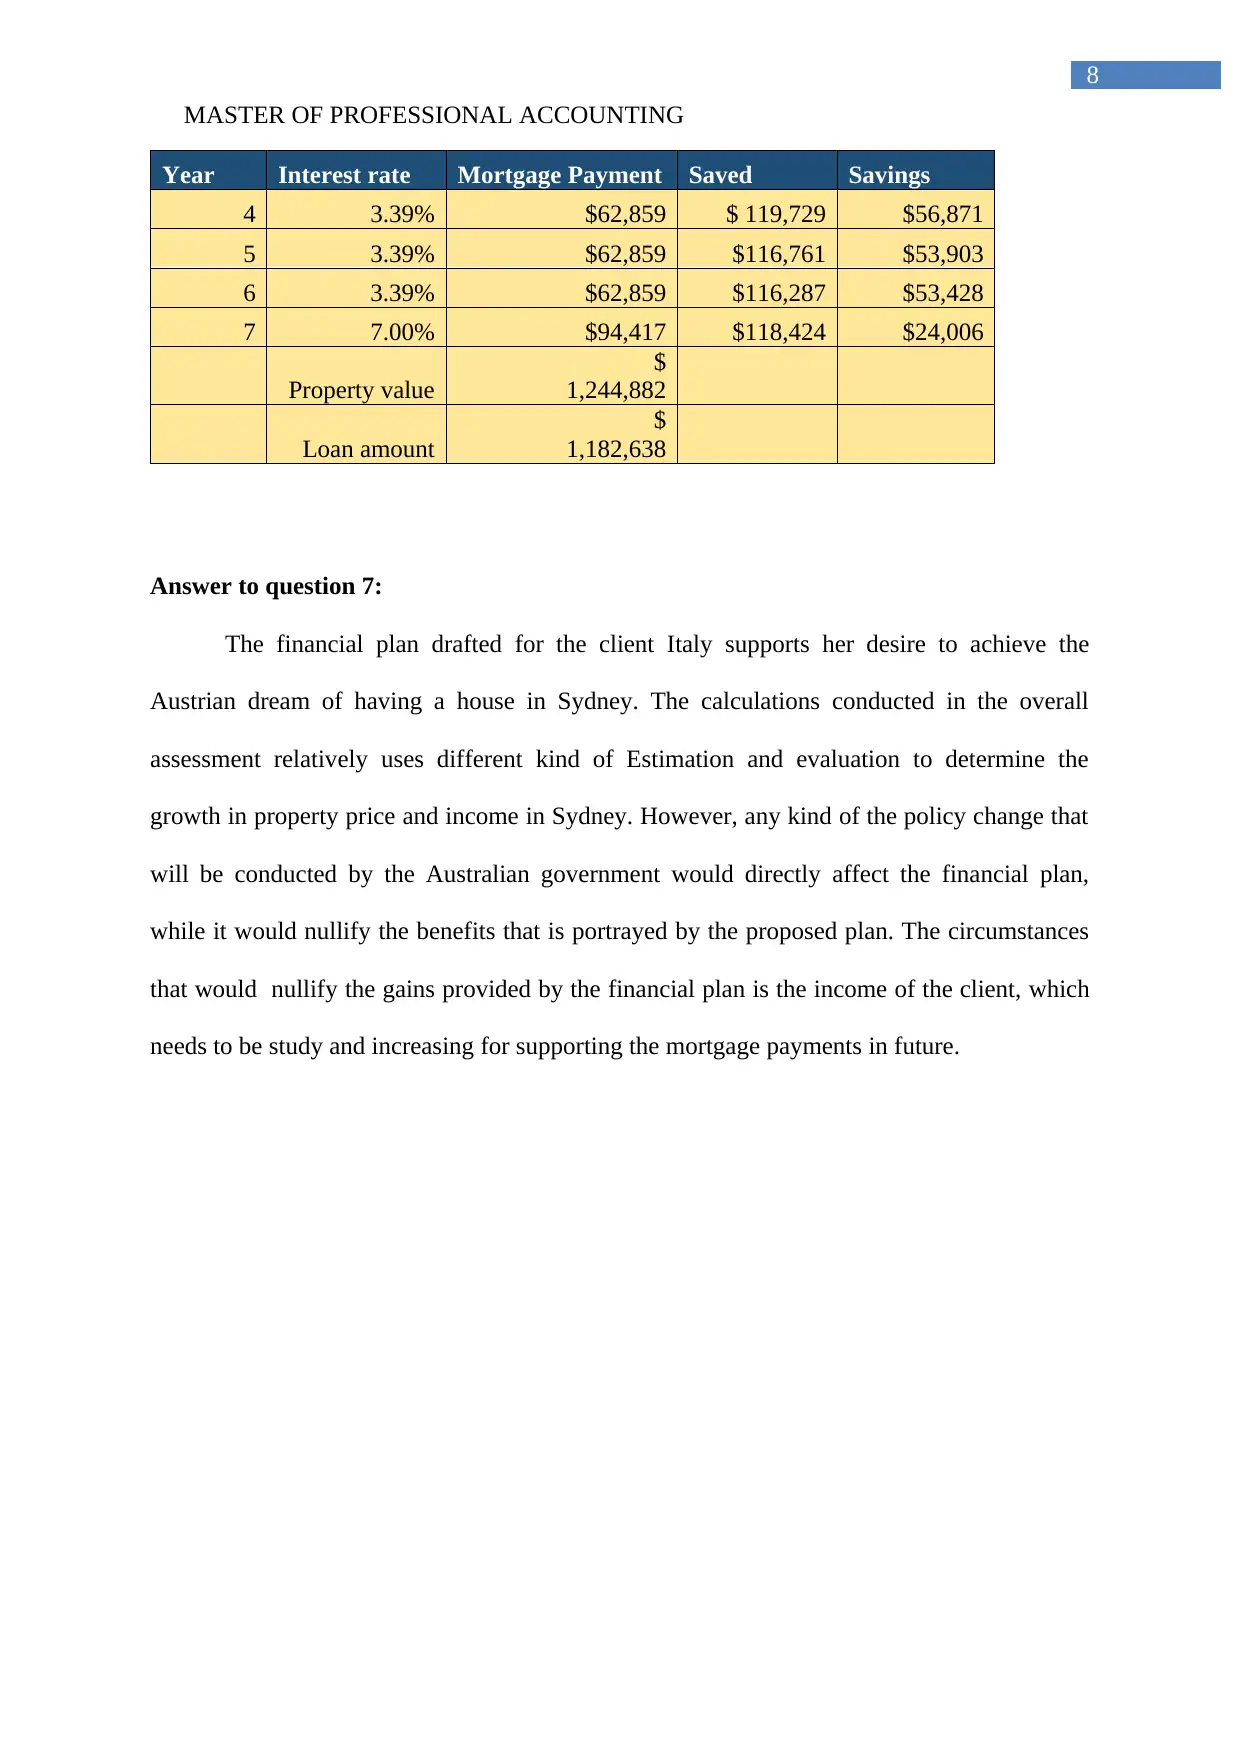
Answer to question 7:
The financial plan drafted for the client Italy supports her desire to achieve the
Austrian dream of having a house in Sydney. The calculations conducted in the overall
assessment relatively uses different kind of Estimation and evaluation to determine the
growth in property price and income in Sydney. However, any kind of the policy change that
will be conducted by the Australian government would directly affect the financial plan,
while it would nullify the benefits that is portrayed by the proposed plan. The circumstances
that would nullify the gains provided by the financial plan is the income of the client, which
needs to be study and increasing for supporting the mortgage payments in future.
8
Year Interest rate Mortgage Payment Saved Savings
4 3.39% $62,859 $ 119,729 $56,871
5 3.39% $62,859 $116,761 $53,903
6 3.39% $62,859 $116,287 $53,428
7 7.00% $94,417 $118,424 $24,006
Property value
$
1,244,882
Loan amount
$
1,182,638
Answer to question 7:
The financial plan drafted for the client Italy supports her desire to achieve the
Austrian dream of having a house in Sydney. The calculations conducted in the overall
assessment relatively uses different kind of Estimation and evaluation to determine the
growth in property price and income in Sydney. However, any kind of the policy change that
will be conducted by the Australian government would directly affect the financial plan,
while it would nullify the benefits that is portrayed by the proposed plan. The circumstances
that would nullify the gains provided by the financial plan is the income of the client, which
needs to be study and increasing for supporting the mortgage payments in future.
⊘ This is a preview!⊘
Do you want full access?
Subscribe today to unlock all pages.
Trusted by 1+ million students worldwide
MASTER OF PROFESSIONAL ACCOUNTING
9
References:
Abs.gov.au. (2018). Ato.gov.au. Retrieved 24 May 2018, from
https://www.ato.gov.au/calculators-and-tools/simple-tax-calculator/
Baker, E., Bentley, R., Lester, L., & Beer, A. (2016). Housing affordability and residential
mobility as drivers of locational inequality. Applied Geography, 72, 65-75.
Beer, A., Bentley, R., Baker, E., Mason, K., Mallett, S., Kavanagh, A., & LaMontagne, T.
(2016). Neoliberalism, economic restructuring and policy change: Precarious housing
and precarious employment in Australia. Urban studies, 53(8), 1542-1558.
Bentley, R. J., Pevalin, D., Baker, E., Mason, K., Reeves, A., & Beer, A. (2016). Housing
affordability, tenure and mental health in Australia and the United Kingdom: a
comparative panel analysis. Housing Studies, 31(2), 208-222.
Hill, R. J., & Syed, I. A. (2016). Hedonic price–rent ratios, user cost, and departures from
equilibrium in the housing market. Regional Science and Urban Economics, 56, 60-
72.
Huisman, C. J. (2016). A silent shift? The precarisation of the Dutch rental housing
market. Journal of Housing and the Built Environment, 31(1), 93-106.
Martin, C. (2016). The Australian housing market is a house of cards. City Futures Blog.
Mulliner, E., Malys, N., & Maliene, V. (2016). Comparative analysis of MCDM methods for
the assessment of sustainable housing affordability. Omega, 59, 146-156.
Shi, S., Valadkhani, A., Smyth, R., & Vahid, F. (2016). Dating the timeline of house price
bubbles in Australian capital cities. Economic Record, 92(299), 590-605.
Paraphrase This Document
Need a fresh take? Get an instant paraphrase of this document with our AI Paraphraser
MASTER OF PROFESSIONAL ACCOUNTING
10
Stampduty.calculatorsaustralia.com.au. (2014). Stamp Duty Calculator. Retrieved 24 May
2018, from https://stampduty.calculatorsaustralia.com.au/
Westpac.com.au. (2018). Westpac.com.au. Retrieved 24 May 2018, from
https://www.westpac.com.au/personal-banking/home-loans/calculator/stamp-duty-
calculator/
Yates, J. (2016). Why does Australia have an affordable housing problem and what can be
done about it?. Australian Economic Review, 49(3), 328-339.
1 out of 11
Related Documents


Your All-in-One AI-Powered Toolkit for Academic Success.
+13062052269
info@desklib.com
Available 24*7 on WhatsApp / Email
![[object Object]](/_next/static/media/star-bottom.7253800d.svg)
Unlock your academic potential
Copyright © 2020–2026 A2Z Services. All Rights Reserved. Developed and managed by ZUCOL.