MA514 Business Finance: Melbourne Housing Market Analysis Report
VerifiedAdded on 2023/06/11
|13
|2263
|495
Report
AI Summary
This report provides a detailed analysis of the Melbourne housing market, focusing on historical price trends, income data, and affordability. It includes calculations and assumptions related to future housing prices and income growth, utilizing data from the ABS and ATO tax calculator. The report examines a client's potential borrowing amount, stamp duty, and financial plans with varying upfront payments (20% and 5%). It also assesses the impact of interest rate increments on a lender's capability and outlines potential risks associated with the financial plan. The analysis aims to determine the feasibility of achieving the 'Australian dream' of homeownership, considering factors like income, expenses, and mortgage payments. Desklib offers a range of resources including past papers and solved assignments for students.

Running head: BUSINESS FINANCE
Business finance
Name of the student
Name of the University
Author Note
Business finance
Name of the student
Name of the University
Author Note
Paraphrase This Document
Need a fresh take? Get an instant paraphrase of this document with our AI Paraphraser
1BUSINESS FINANCE
Table of Contents
1. Detection and justification of the historical prices of houses of Melbourne that indicate
assumptions taken regarding future prices:................................................................................2
2. Evaluation of the historical data of Melbourne to justify the assumptions for the income
data:............................................................................................................................................4
3. Detection of the net income through using ATO calculator to detect the home loan rate and
maximum borrowing amount that a client could receive:..........................................................6
4. Calculation of stamp duty related with property purchase at the time of detecting the
affordability of house prices.......................................................................................................8
5. Calculation and presentation of a financial plan with 20% upfront payment and 5% upfront
payment for the loan:.................................................................................................................9
6. Calculation regarding increment of interest rate payment that can destroy lender’s
capability regarding interest rate payment:..............................................................................10
7. Providing the relevant plan along with detailed risk that the assumption regarding financial
plan has entailed.......................................................................................................................11
References:...............................................................................................................................12
2BUSINESS FINANCE
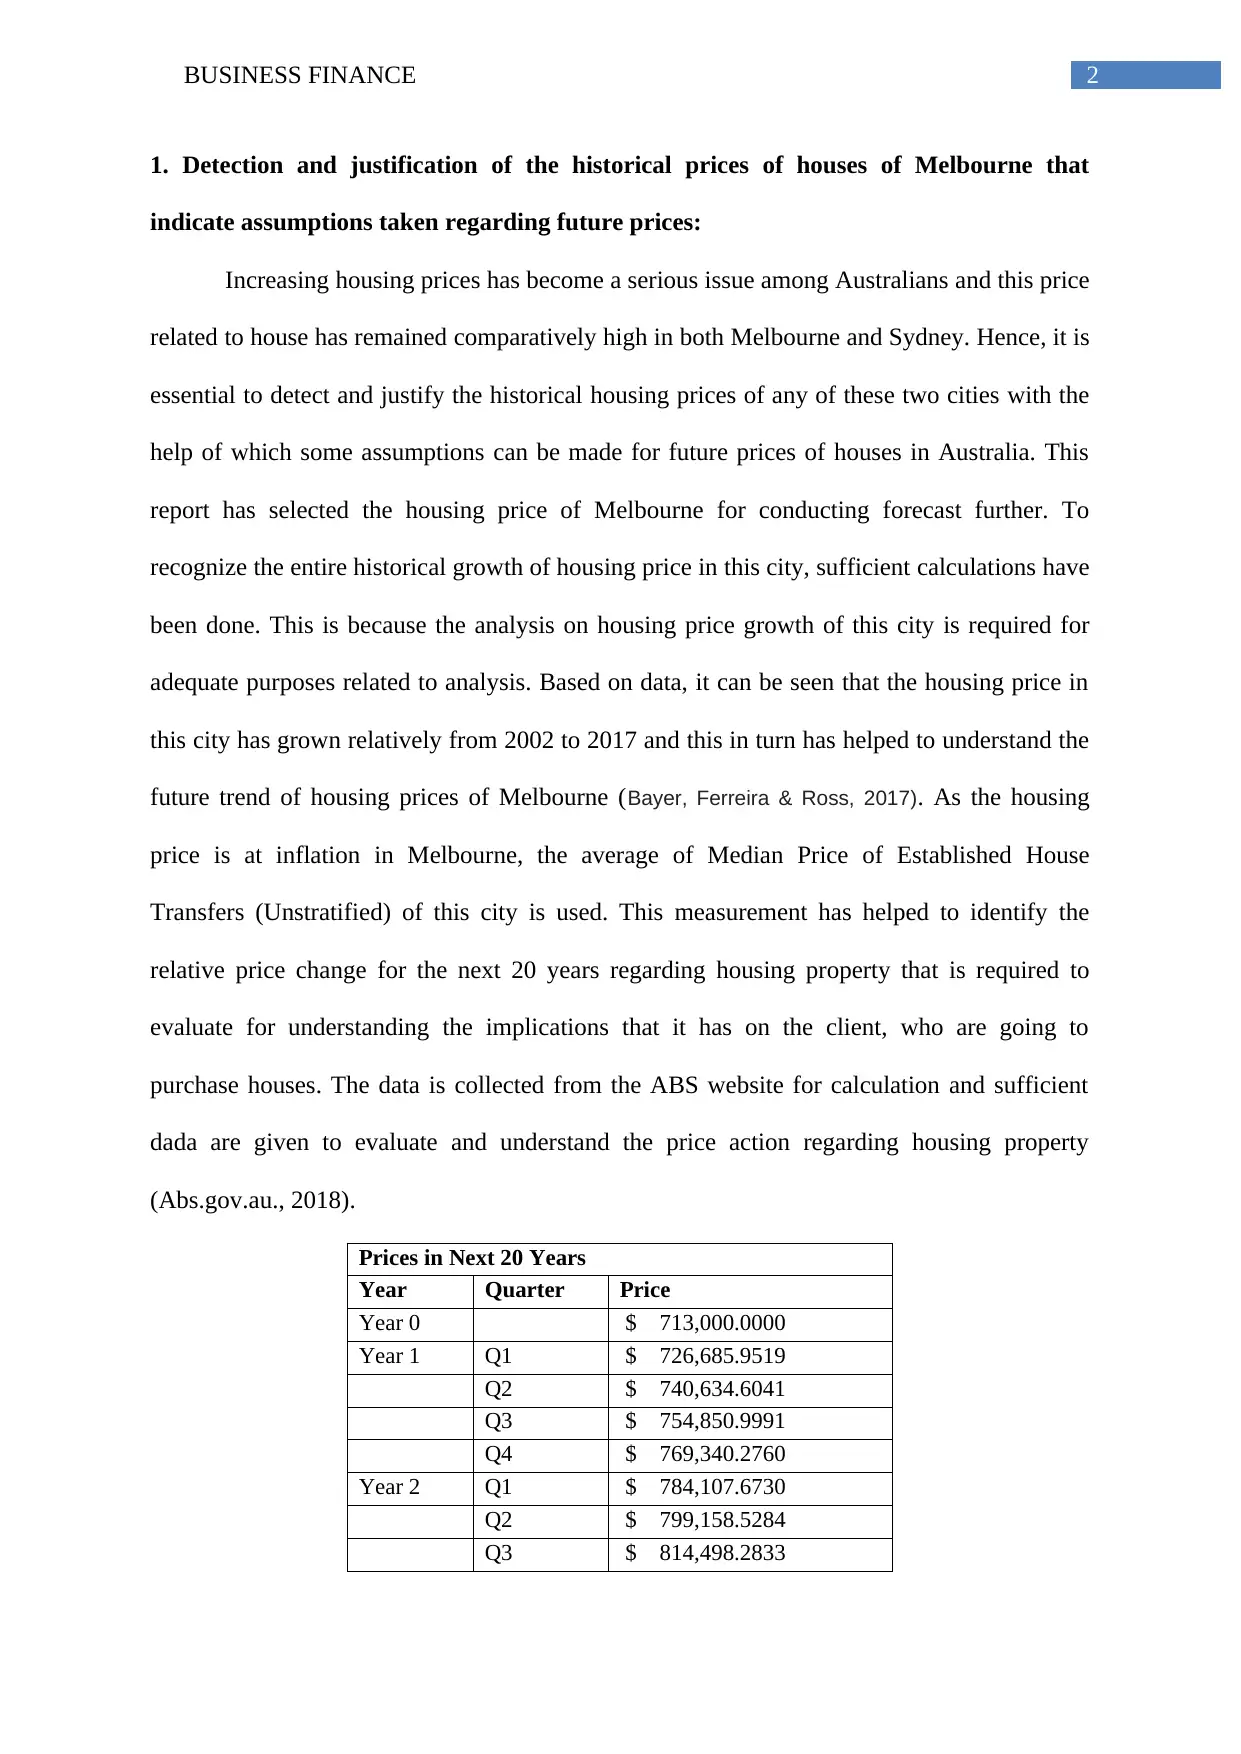
1. Detection and justification of the historical prices of houses of Melbourne that
indicate assumptions taken regarding future prices:
Increasing housing prices has become a serious issue among Australians and this price
related to house has remained comparatively high in both Melbourne and Sydney. Hence, it is
essential to detect and justify the historical housing prices of any of these two cities with the
help of which some assumptions can be made for future prices of houses in Australia. This
report has selected the housing price of Melbourne for conducting forecast further. To
recognize the entire historical growth of housing price in this city, sufficient calculations have
been done. This is because the analysis on housing price growth of this city is required for
adequate purposes related to analysis. Based on data, it can be seen that the housing price in
this city has grown relatively from 2002 to 2017 and this in turn has helped to understand the
future trend of housing prices of Melbourne (Bayer, Ferreira & Ross, 2017). As the housing
price is at inflation in Melbourne, the average of Median Price of Established House
Transfers (Unstratified) of this city is used. This measurement has helped to identify the
relative price change for the next 20 years regarding housing property that is required to
evaluate for understanding the implications that it has on the client, who are going to
purchase houses. The data is collected from the ABS website for calculation and sufficient
dada are given to evaluate and understand the price action regarding housing property
(Abs.gov.au., 2018).
Prices in Next 20 Years
Year Quarter Price
Year 0 $ 713,000.0000
Year 1 Q1 $ 726,685.9519
Q2 $ 740,634.6041
Q3 $ 754,850.9991
Q4 $ 769,340.2760
Year 2 Q1 $ 784,107.6730
Q2 $ 799,158.5284
Q3 $ 814,498.2833
⊘ This is a preview!⊘
Do you want full access?
Subscribe today to unlock all pages.
Trusted by 1+ million students worldwide

3BUSINESS FINANCE
Q4 $ 830,132.4829
Year 3 Q1 $ 846,066.7792
Q2 $ 862,306.9325
Q3 $ 878,858.8136
Q4 $ 895,728.4061
Year 4 Q1 $ 912,921.8085
Q2 $ 930,445.2363
Q3 $ 948,305.0242
Q4 $ 966,507.6286
Year 5 Q1 $ 985,059.6300
Q2 $ 1,003,967.7348
Q3 $ 1,023,238.7785
Q4 $ 1,042,879.7276
Year 6 Q1 $ 1,062,897.6825
Q2 $ 1,083,299.8797
Q3 $ 1,104,093.6947
Q4 $ 1,125,286.6445
Year 7 Q1 $ 1,146,886.3905
Q2 $ 1,168,900.7412
Q3 $ 1,191,337.6547
Q4 $ 1,214,205.2422
Year 8 Q1 $ 1,237,511.7704
Q2 $ 1,261,265.6646
Q3 $ 1,285,475.5121
Q4 $ 1,310,150.0648
Year 9 Q1 $ 1,335,298.2427
Q2 $ 1,360,929.1369
Q3 $ 1,387,052.0131
Q4 $ 1,413,676.3149
Year 10 Q1 $ 1,440,811.6670
Q2 $ 1,468,467.8791
Q3 $ 1,496,654.9490
Q4 $ 1,525,383.0663
Year 11 Q1 $ 1,554,662.6166
Q2 $ 1,584,504.1844
Q3 $ 1,614,918.5576
Q4 $ 1,645,916.7312
Year 12 Q1 $ 1,677,509.9111
Q2 $ 1,709,709.5184
Q3 $ 1,742,527.1934
Q4 $ 1,775,974.7998
Year 13 Q1 $ 1,810,064.4292
Q2 $ 1,844,808.4050
Q3 $ 1,880,219.2874
Paraphrase This Document
Need a fresh take? Get an instant paraphrase of this document with our AI Paraphraser
4BUSINESS FINANCE
Q4 $ 1,916,309.8776
Year 14 Q1 $ 1,953,093.2225
Q2 $ 1,990,582.6193
Q3 $ 2,028,791.6208
Q4 $ 2,067,734.0396
Year 15 Q1 $ 2,107,423.9536
Q2 $ 2,147,875.7108
Q3 $ 2,189,103.9348
Q4 $ 2,231,123.5298
Year 16 Q1 $ 2,273,949.6860
Q2 $ 2,317,597.8853
Q3 $ 2,362,083.9067
Q4 $ 2,407,423.8321
Year 17 Q1 $ 2,453,634.0521
Q2 $ 2,500,731.2719
Q3 $ 2,548,732.5173
Q4 $ 2,597,655.1410
Year 18 Q1 $ 2,647,516.8288
Q2 $ 2,698,335.6059
Q3 $ 2,750,129.8435
Q4 $ 2,802,918.2654
Year 19 Q1 $ 2,856,719.9549
Q2 $ 2,911,554.3616
Q3 $ 2,967,441.3084
Q4 $ 3,024,400.9986
Year 20 Q1 $ 3,082,454.0234
Q2 $ 3,141,621.3693
Q3 $ 3,201,924.4254
Q4 $ 3,263,384.9917
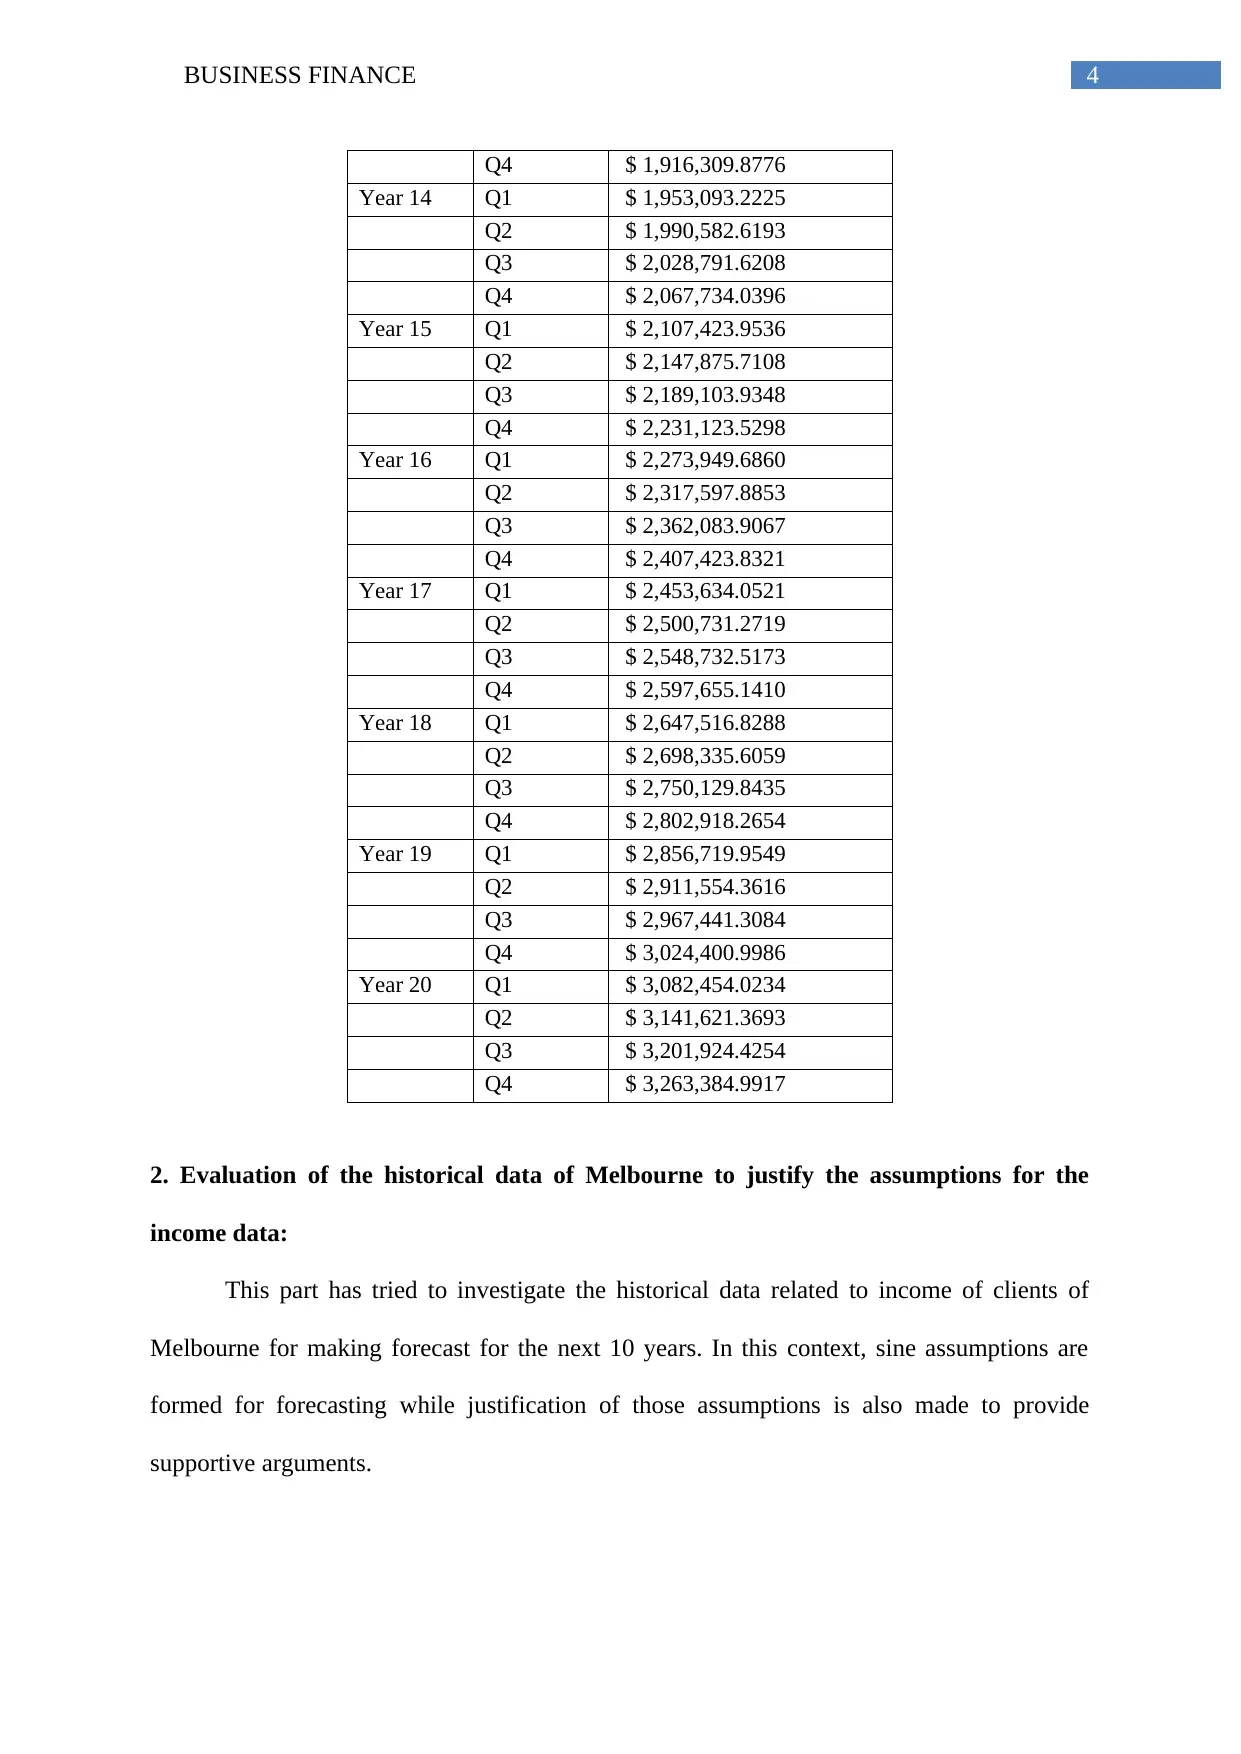
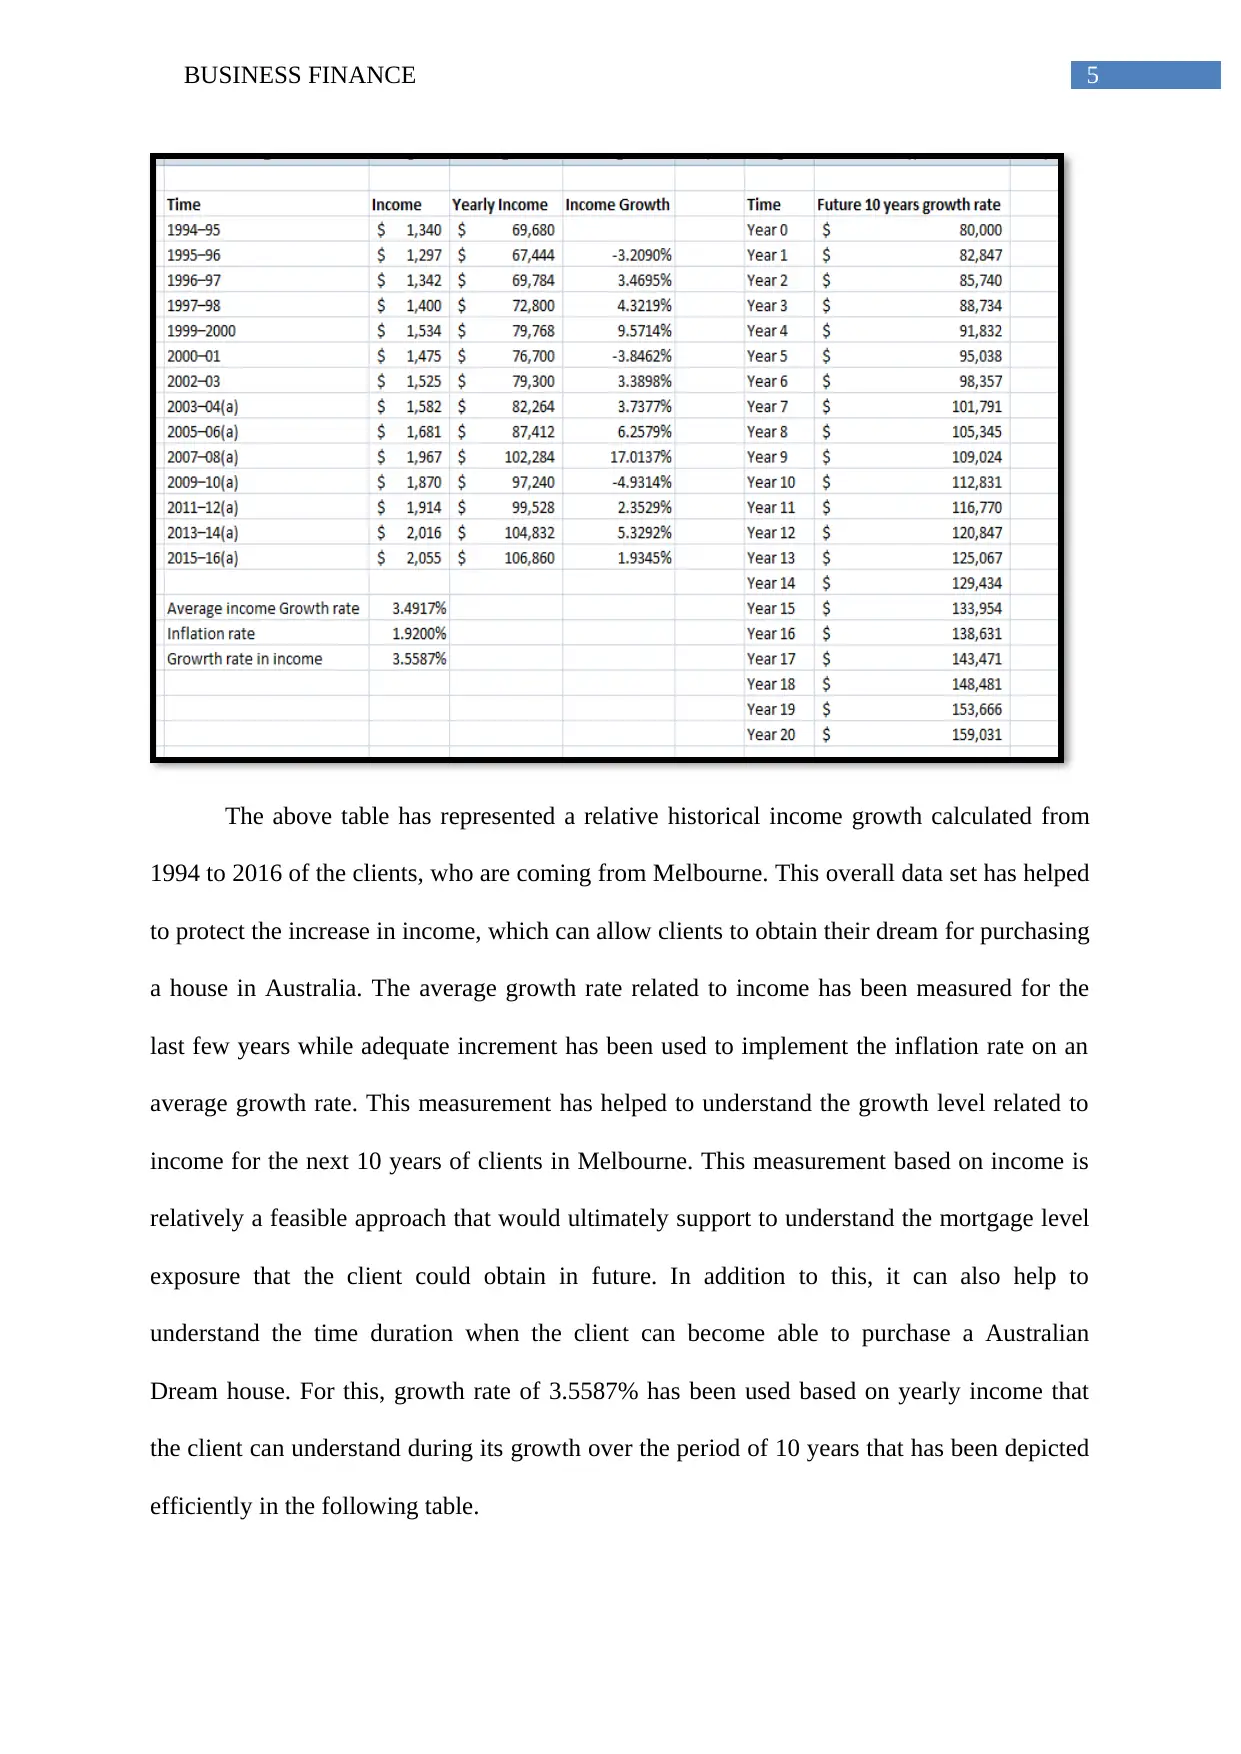
2. Evaluation of the historical data of Melbourne to justify the assumptions for the
income data:
This part has tried to investigate the historical data related to income of clients of
Melbourne for making forecast for the next 10 years. In this context, sine assumptions are
formed for forecasting while justification of those assumptions is also made to provide
supportive arguments.
Q4 $ 1,916,309.8776
Year 14 Q1 $ 1,953,093.2225
Q2 $ 1,990,582.6193
Q3 $ 2,028,791.6208
Q4 $ 2,067,734.0396
Year 15 Q1 $ 2,107,423.9536
Q2 $ 2,147,875.7108
Q3 $ 2,189,103.9348
Q4 $ 2,231,123.5298
Year 16 Q1 $ 2,273,949.6860
Q2 $ 2,317,597.8853
Q3 $ 2,362,083.9067
Q4 $ 2,407,423.8321
Year 17 Q1 $ 2,453,634.0521
Q2 $ 2,500,731.2719
Q3 $ 2,548,732.5173
Q4 $ 2,597,655.1410
Year 18 Q1 $ 2,647,516.8288
Q2 $ 2,698,335.6059
Q3 $ 2,750,129.8435
Q4 $ 2,802,918.2654
Year 19 Q1 $ 2,856,719.9549
Q2 $ 2,911,554.3616
Q3 $ 2,967,441.3084
Q4 $ 3,024,400.9986
Year 20 Q1 $ 3,082,454.0234
Q2 $ 3,141,621.3693
Q3 $ 3,201,924.4254
Q4 $ 3,263,384.9917
2. Evaluation of the historical data of Melbourne to justify the assumptions for the
income data:
This part has tried to investigate the historical data related to income of clients of
Melbourne for making forecast for the next 10 years. In this context, sine assumptions are
formed for forecasting while justification of those assumptions is also made to provide
supportive arguments.
5BUSINESS FINANCE
The above table has represented a relative historical income growth calculated from
1994 to 2016 of the clients, who are coming from Melbourne. This overall data set has helped
to protect the increase in income, which can allow clients to obtain their dream for purchasing
a house in Australia. The average growth rate related to income has been measured for the
last few years while adequate increment has been used to implement the inflation rate on an
average growth rate. This measurement has helped to understand the growth level related to
income for the next 10 years of clients in Melbourne. This measurement based on income is
relatively a feasible approach that would ultimately support to understand the mortgage level
exposure that the client could obtain in future. In addition to this, it can also help to
understand the time duration when the client can become able to purchase a Australian
Dream house. For this, growth rate of 3.5587% has been used based on yearly income that
the client can understand during its growth over the period of 10 years that has been depicted
efficiently in the following table.
⊘ This is a preview!⊘
Do you want full access?
Subscribe today to unlock all pages.
Trusted by 1+ million students worldwide
6BUSINESS FINANCE
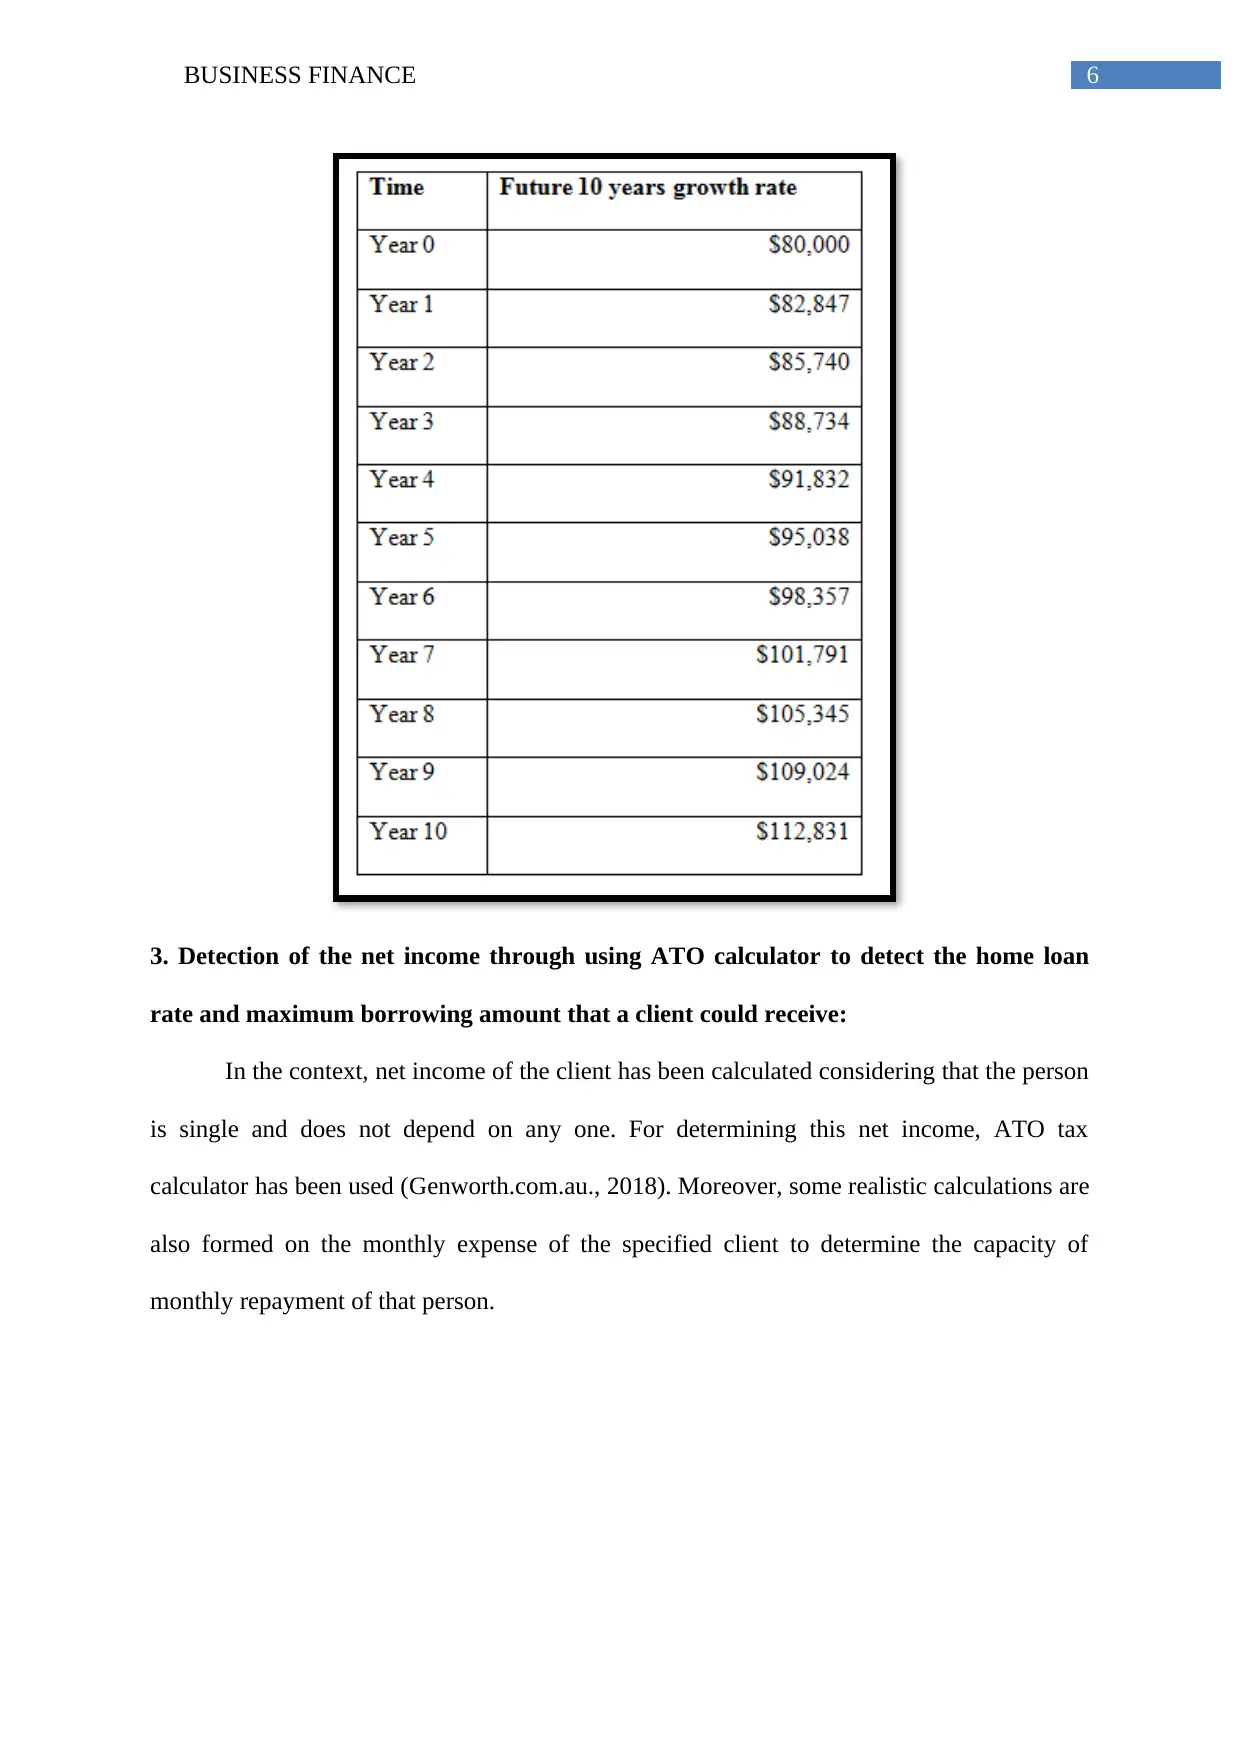
3. Detection of the net income through using ATO calculator to detect the home loan
rate and maximum borrowing amount that a client could receive:
In the context, net income of the client has been calculated considering that the person
is single and does not depend on any one. For determining this net income, ATO tax
calculator has been used (Genworth.com.au., 2018). Moreover, some realistic calculations are
also formed on the monthly expense of the specified client to determine the capacity of
monthly repayment of that person.
Paraphrase This Document
Need a fresh take? Get an instant paraphrase of this document with our AI Paraphraser
7BUSINESS FINANCE
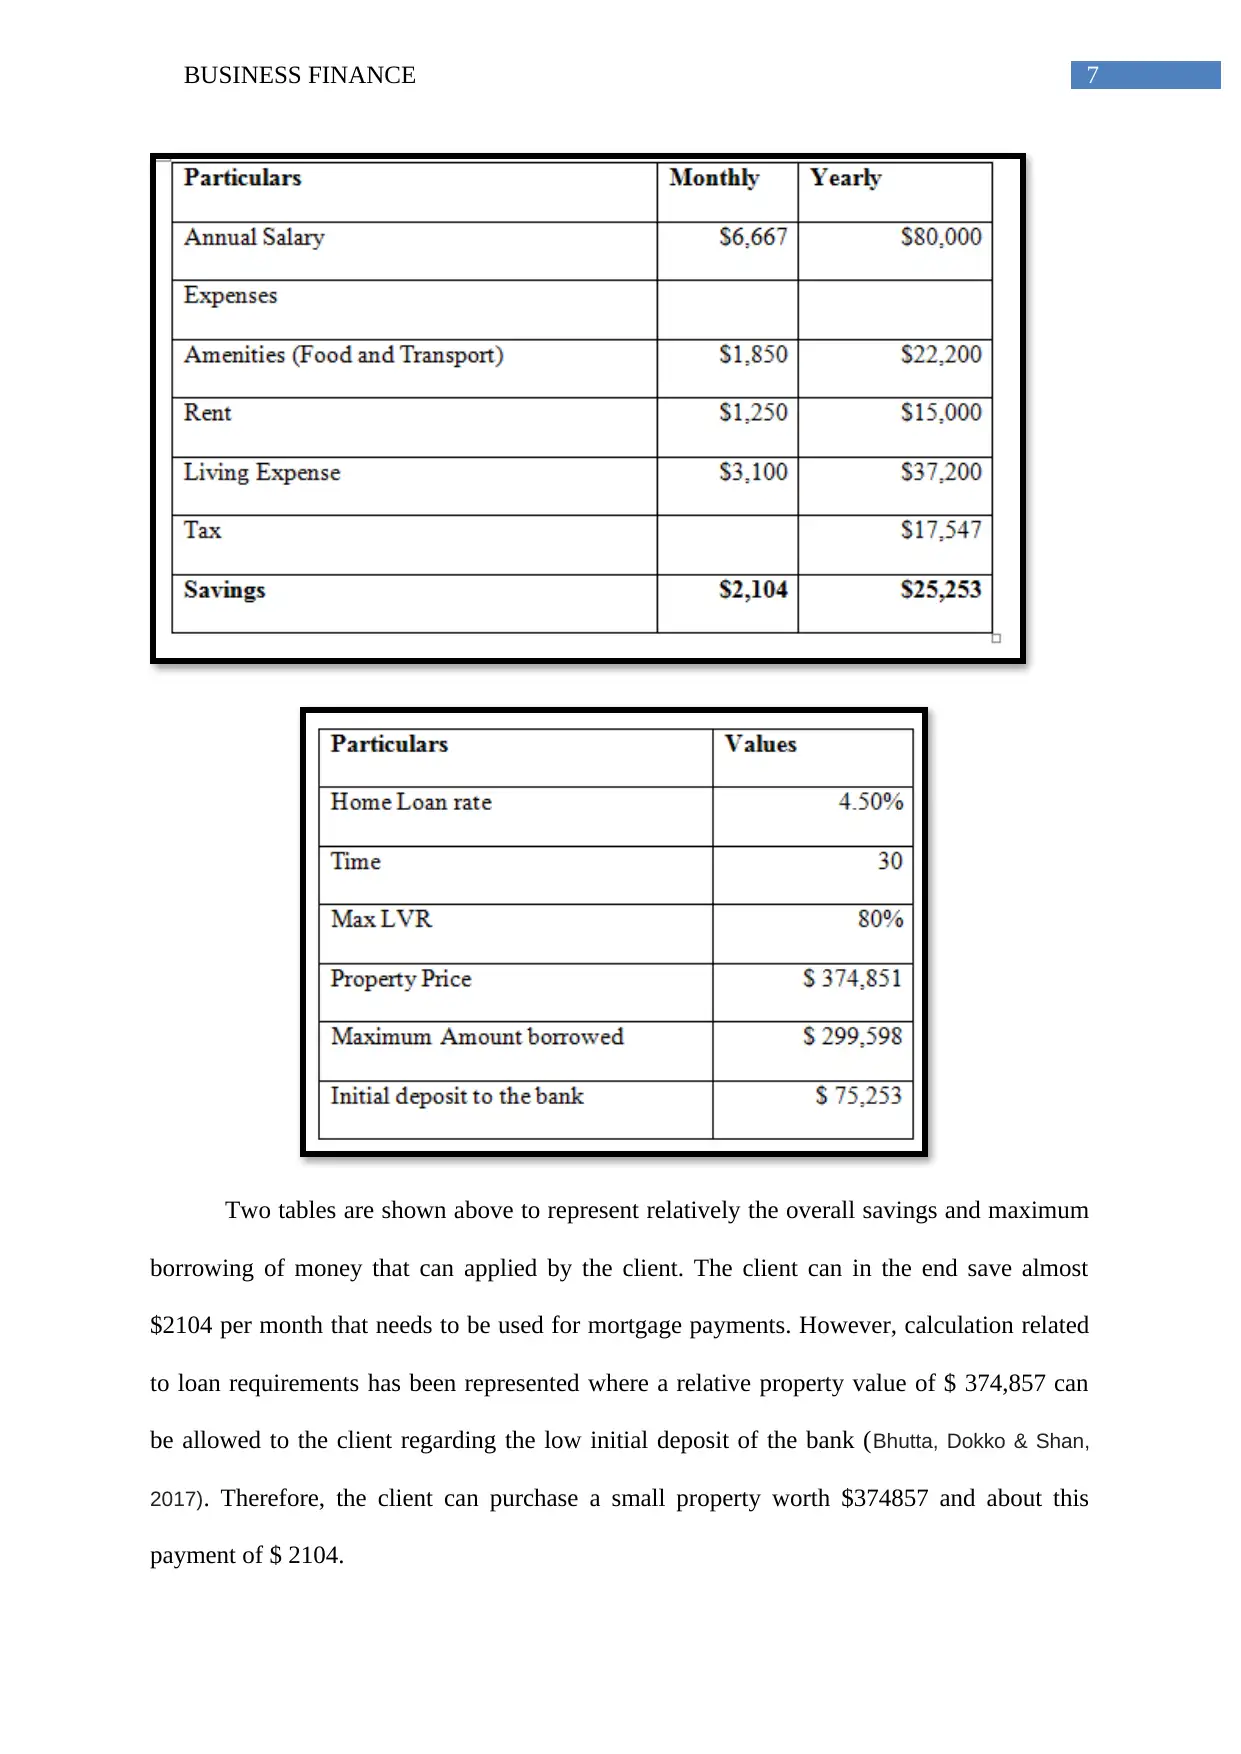
Two tables are shown above to represent relatively the overall savings and maximum
borrowing of money that can applied by the client. The client can in the end save almost
$2104 per month that needs to be used for mortgage payments. However, calculation related
to loan requirements has been represented where a relative property value of $ 374,857 can
be allowed to the client regarding the low initial deposit of the bank (Bhutta, Dokko & Shan,
2017). Therefore, the client can purchase a small property worth $374857 and about this
payment of $ 2104.

8BUSINESS FINANCE
4. Calculation of stamp duty related with property purchase at the time of detecting the
affordability of house prices
The two tables represented above have showed overall property value in a relative sense and
client can provide this value when mortgage premium is used and also when mortgage
premium is not used. Based on valuation, the property value can be obtained worth $370000
by the client while the overall savings has remained at the level of $ 75253. In addition to
⊘ This is a preview!⊘
Do you want full access?
Subscribe today to unlock all pages.
Trusted by 1+ million students worldwide
9BUSINESS FINANCE
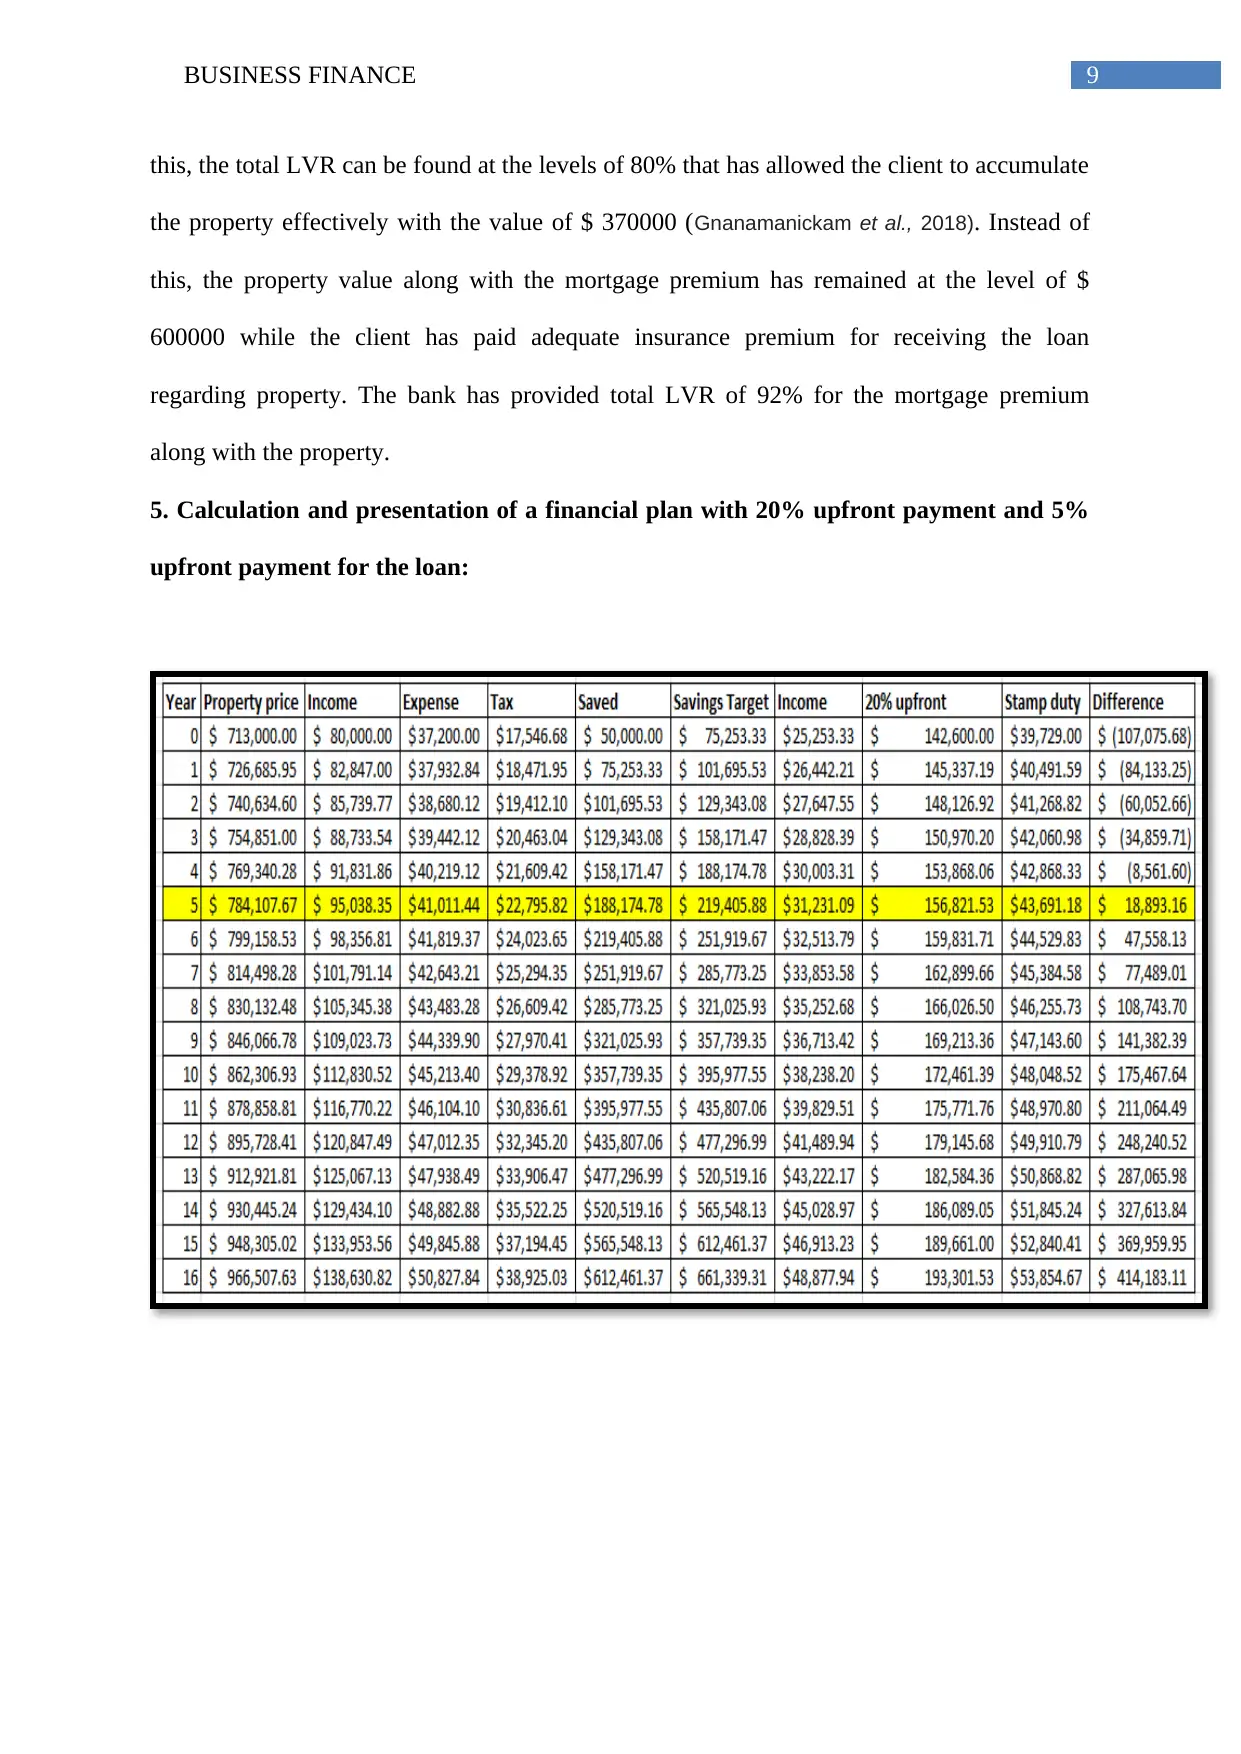
this, the total LVR can be found at the levels of 80% that has allowed the client to accumulate
the property effectively with the value of $ 370000 (Gnanamanickam et al., 2018). Instead of
this, the property value along with the mortgage premium has remained at the level of $
600000 while the client has paid adequate insurance premium for receiving the loan
regarding property. The bank has provided total LVR of 92% for the mortgage premium
along with the property.
5. Calculation and presentation of a financial plan with 20% upfront payment and 5%
upfront payment for the loan:
Paraphrase This Document
Need a fresh take? Get an instant paraphrase of this document with our AI Paraphraser
10BUSINESS FINANCE
Calculation regarding tables has relatively represented the duration, where the client
can measure adequate investments related to property with an upfront payment of 20%. In the
fifth year, equation loan can be obtained, as during this year the difference between income
and expenses has become positive. On the contrary, the given case with upfront payment with
5% has indicted relatively the use of insurance premium in 3rd year, as that can allow the
client to get the property (Bankrate.com., 2018). This phenomenon further can help to
improve the income level, which can be obtained through operation.
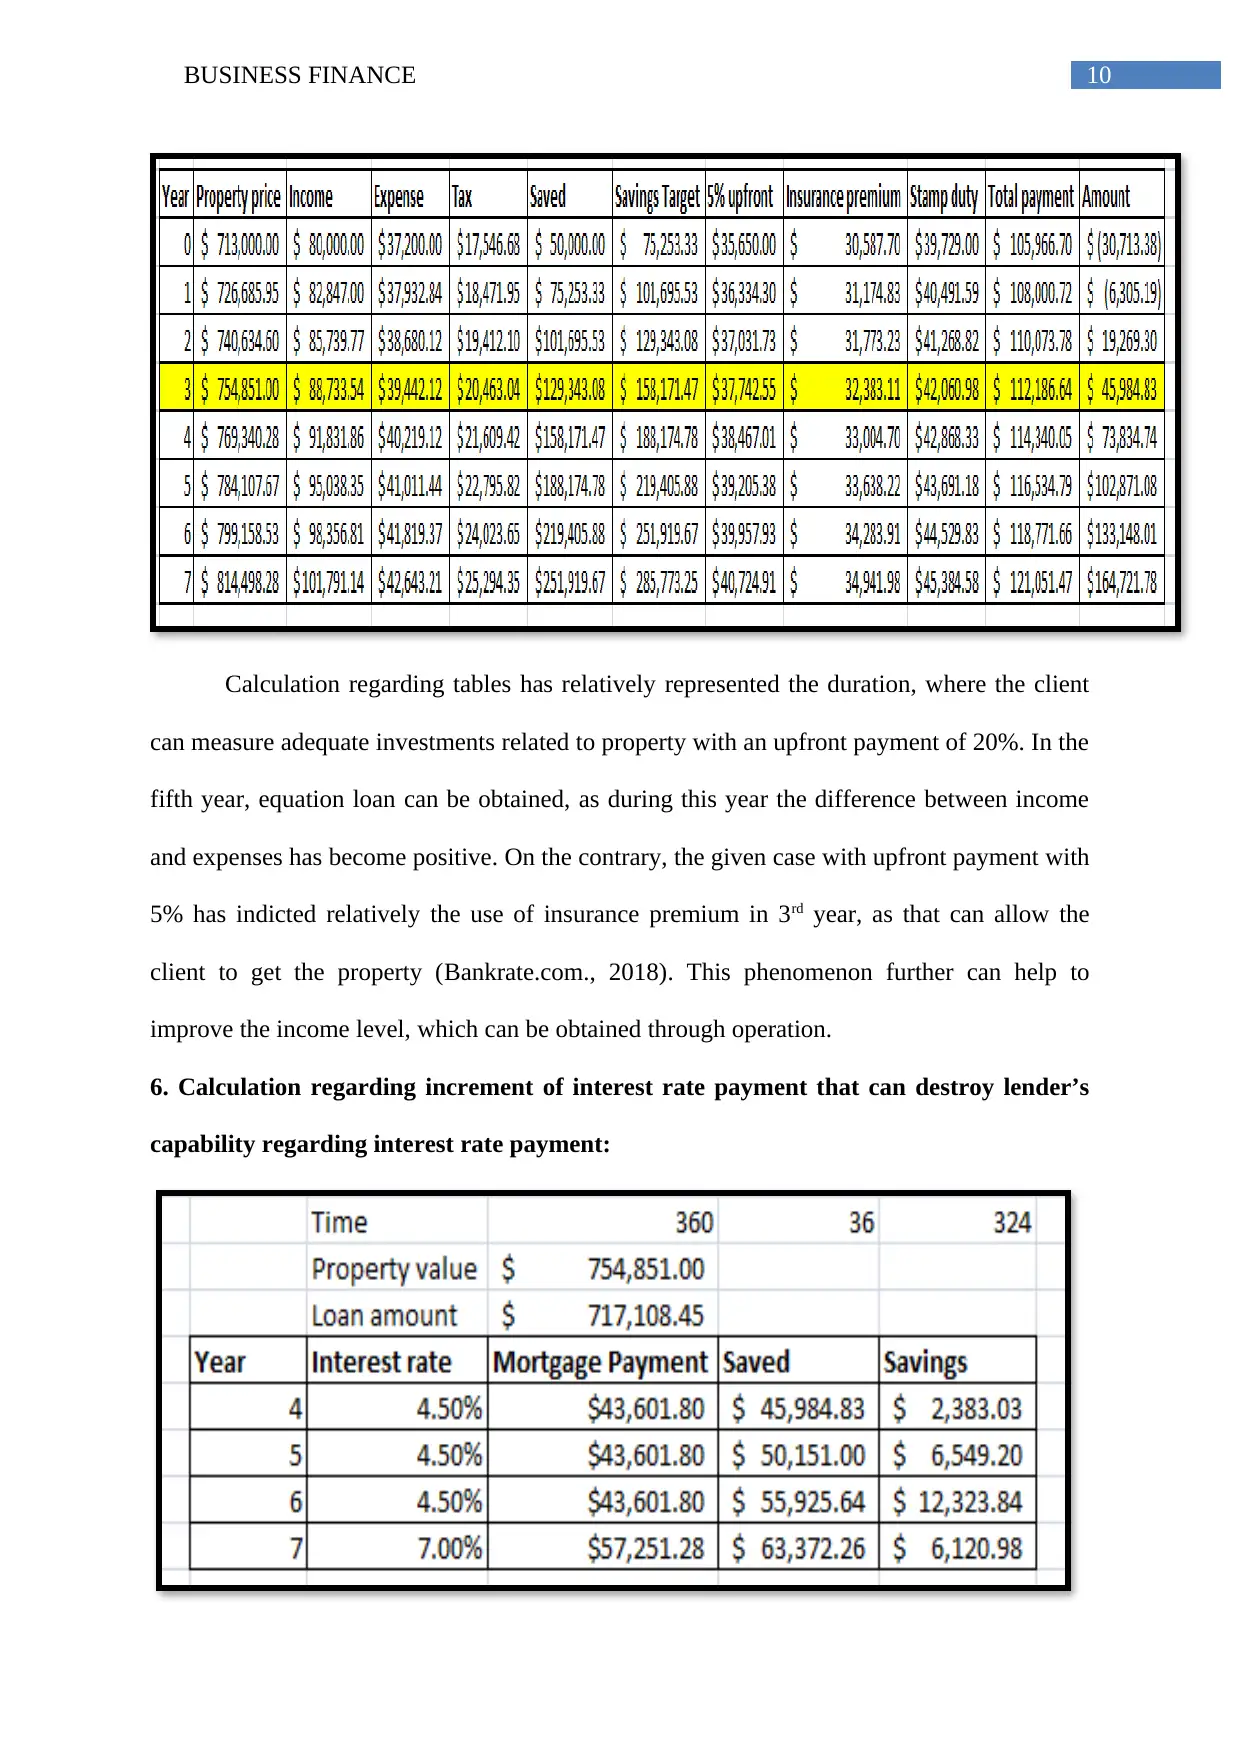
6. Calculation regarding increment of interest rate payment that can destroy lender’s
capability regarding interest rate payment:
Calculation regarding tables has relatively represented the duration, where the client
can measure adequate investments related to property with an upfront payment of 20%. In the
fifth year, equation loan can be obtained, as during this year the difference between income
and expenses has become positive. On the contrary, the given case with upfront payment with
5% has indicted relatively the use of insurance premium in 3rd year, as that can allow the
client to get the property (Bankrate.com., 2018). This phenomenon further can help to
improve the income level, which can be obtained through operation.
6. Calculation regarding increment of interest rate payment that can destroy lender’s
capability regarding interest rate payment:
11BUSINESS FINANCE
From the above table has been represented the entire mortgage payments that the
client is going to conduct after purchasing of the property. However, the interest rate has
changed from 4.50% to 7% during four years and this in turn has slightly influenced the
overall mortgage payments of the concerned client (Kareem, 2017). Hence, during the initial
investment period, the above-mentioned table has represented the overall income and savings
of the client’s mortgage payments. This initial investment related to property can be
conducted over 3 years where interest rate increment can be obtained from year 7
(Stampduty.calculatorsaustralia.com.au., 2014). On the other side, changing mortgage
payments from $ 43601.80 to $ 57251.28 has remained unable to influence the overall
income of the client negatively regarding its continuous savings and increasing income
during the year.
7. Providing the relevant plan along with detailed risk that the assumption regarding
financial plan has entailed
Based on the above analysis, a report has been written with financial plan of the client
for detaining about the assumptions underlying in the financial plan when the “Australian
dream” can be true. Moreover, this section is going to discuss about the potential risks, which
are entailed by the assumptions and the way it is managed in the financial plan.
To achieve the Australian dream, assumptions are made for client, as the person’s
entire income is sufficient for supporting a mortgage regarding the new home. Hence, the
changing income of the client during the period has been represented with the calculations of
the financial planner (Clark, Lusardi & Mitchell, 2017). This calculation may support a new
mortgage. However, it can be seen from the evaluation that clients may lose their jobs and
consequently the entire aim for achieving the Australian dream may remain unfeasible.
Hence, the chief focus on the financial plan has remained only on the income that the client
can generate over the period. This financial plan can support the mortgage plan.
⊘ This is a preview!⊘
Do you want full access?
Subscribe today to unlock all pages.
Trusted by 1+ million students worldwide
1 out of 13
Related Documents


Your All-in-One AI-Powered Toolkit for Academic Success.
+13062052269
info@desklib.com
Available 24*7 on WhatsApp / Email
![[object Object]](/_next/static/media/star-bottom.7253800d.svg)
Unlock your academic potential
Copyright © 2020–2026 A2Z Services. All Rights Reserved. Developed and managed by ZUCOL.