MA611 Auditing Report: Magellan Fin Group Limited Analysis
VerifiedAdded on 2022/12/18
|22
|3796
|31
Report
AI Summary
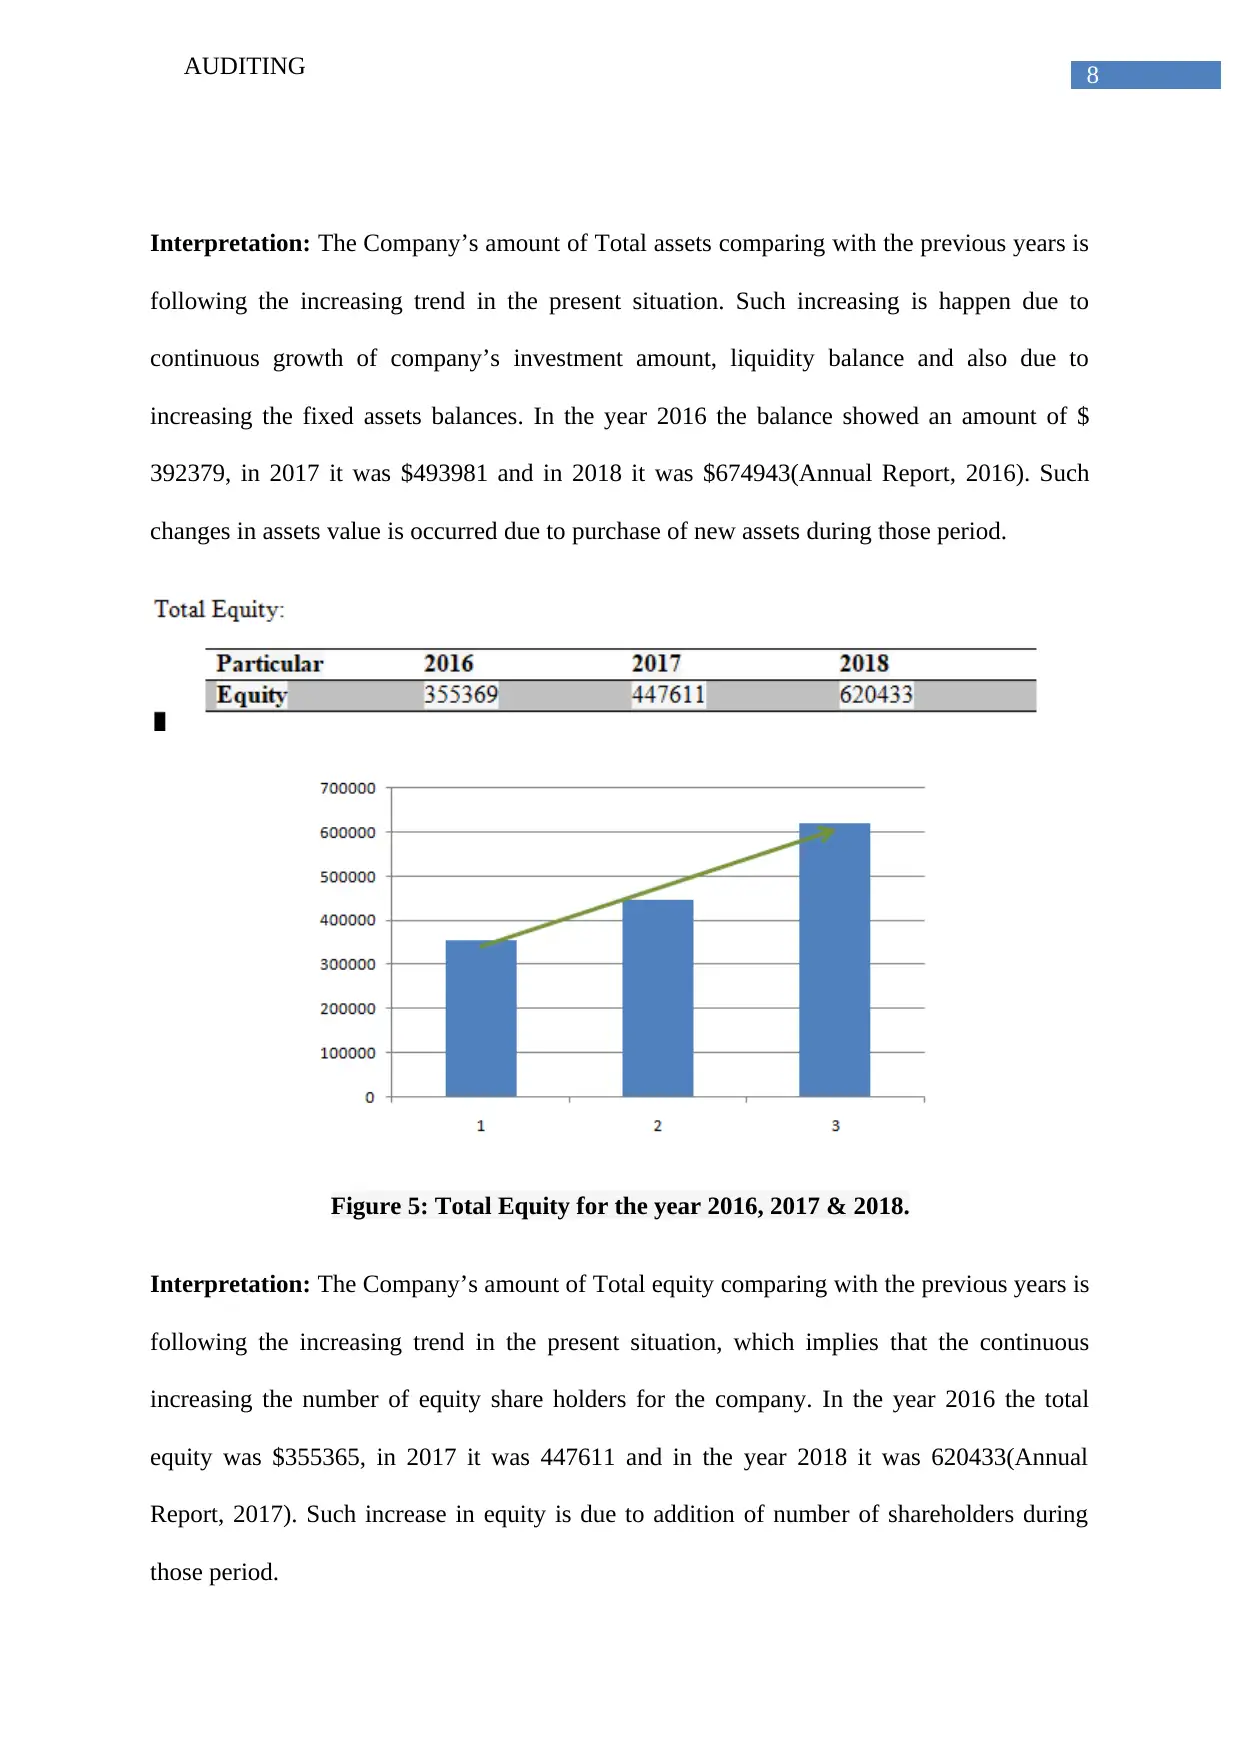
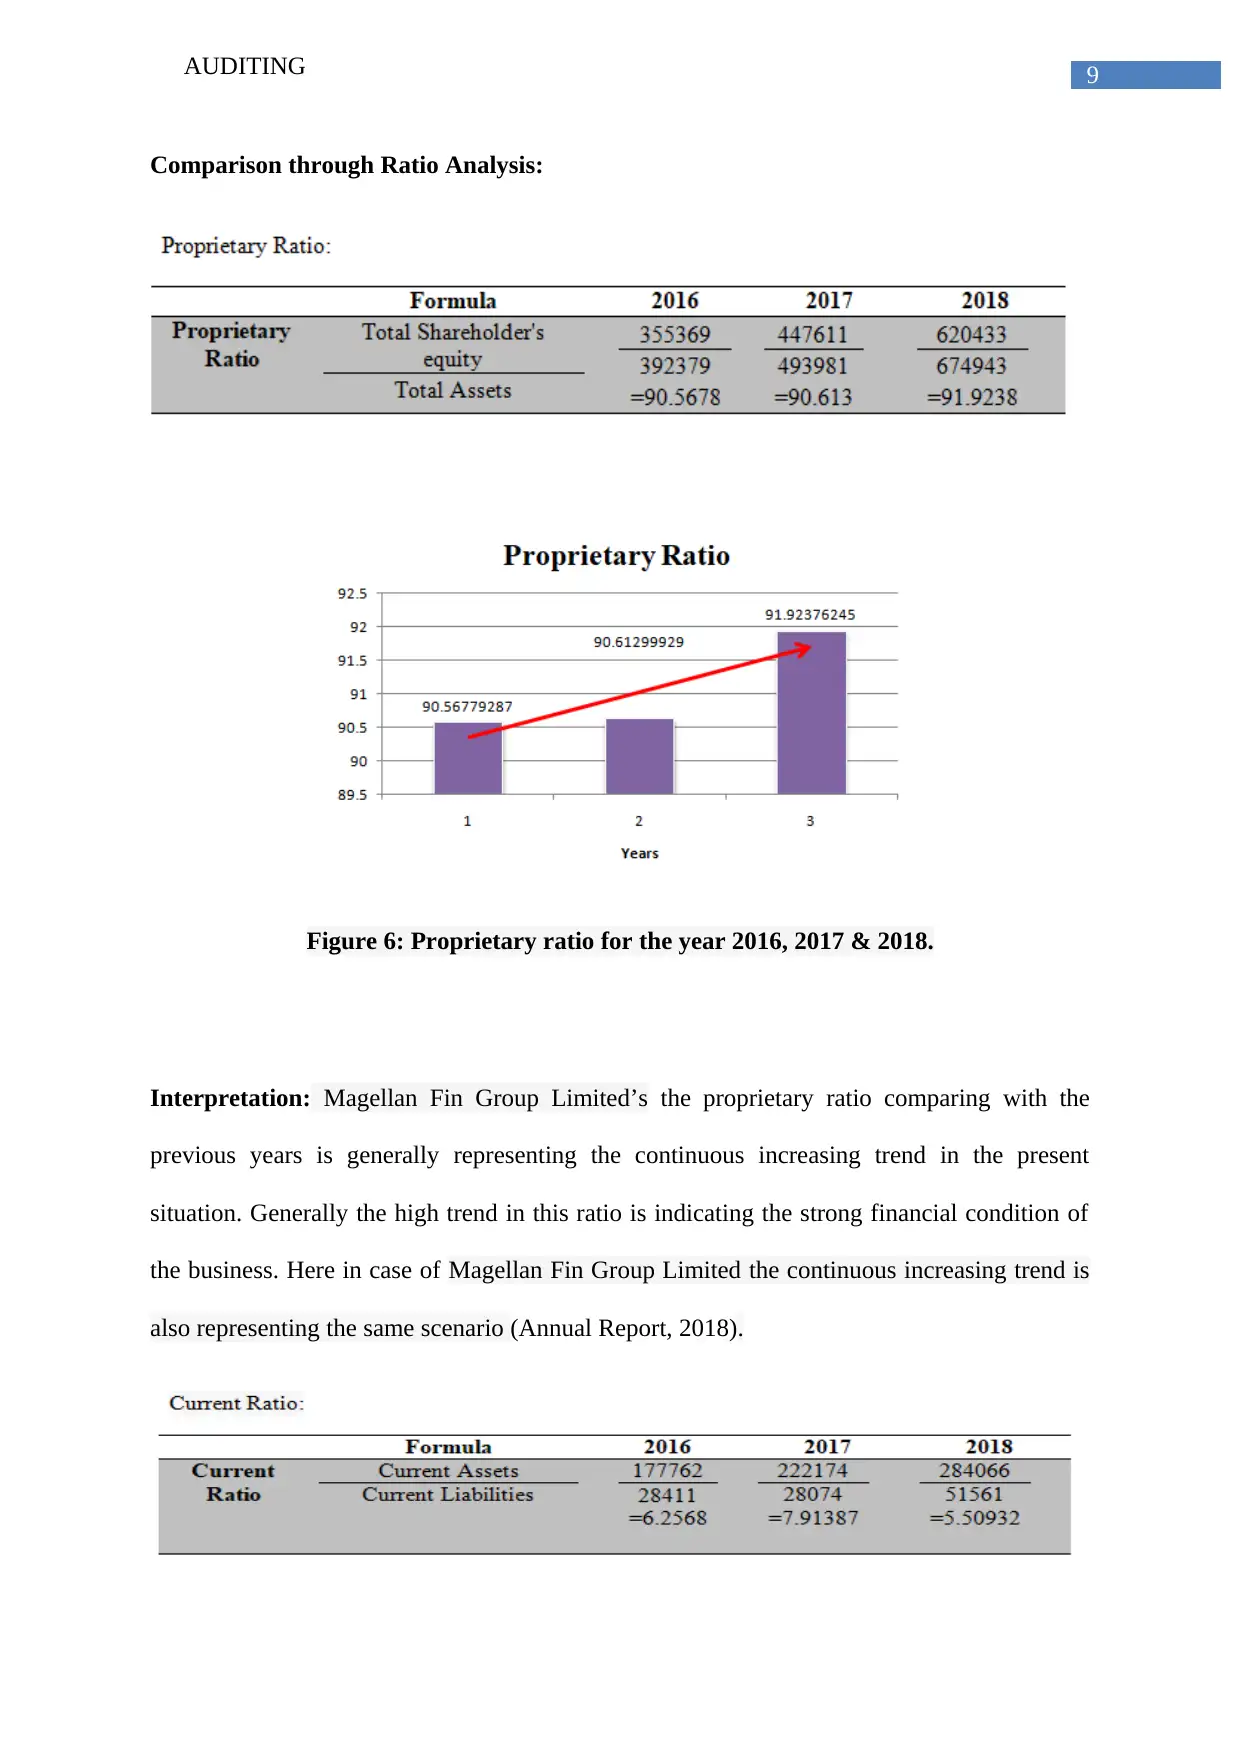
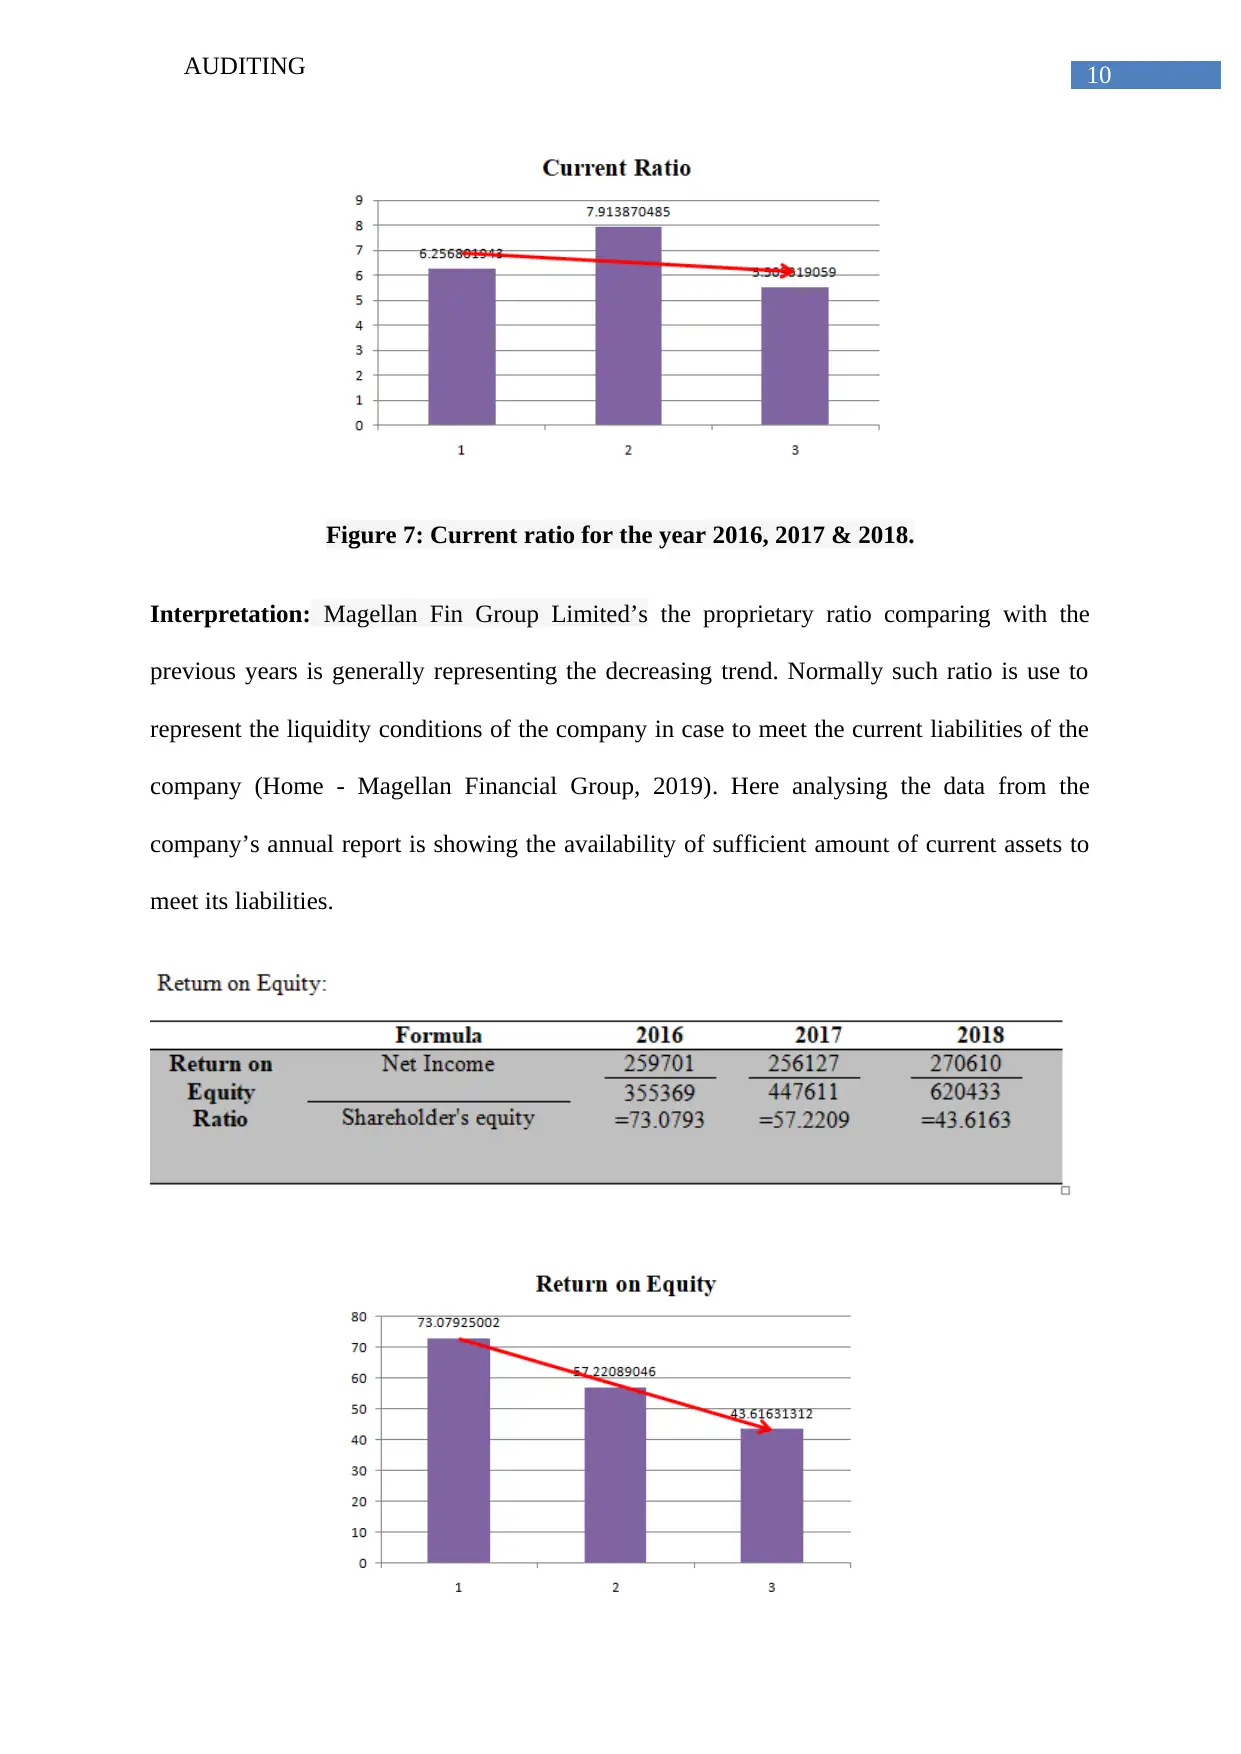
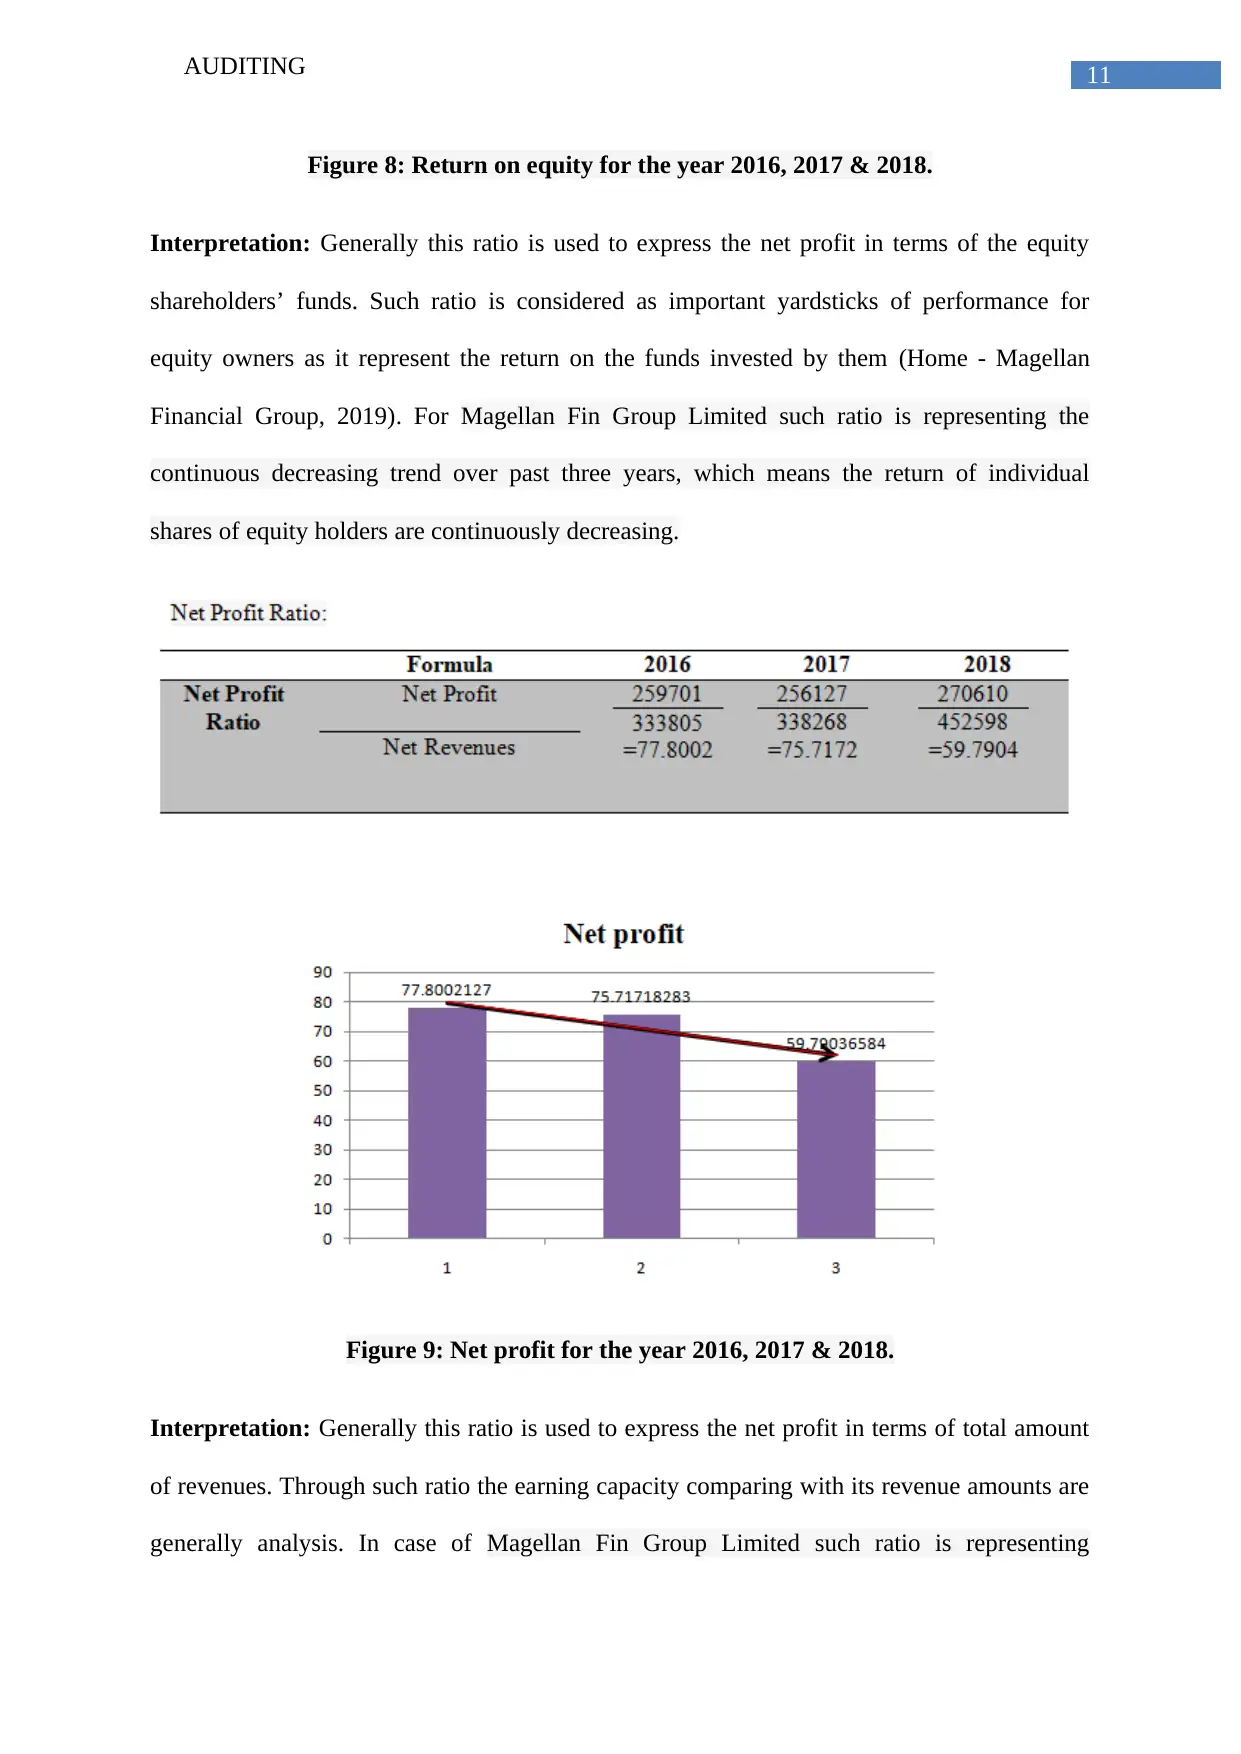
This report presents a detailed analysis of Magellan Fin Group Limited, focusing on its financial performance through simple comparisons and ratio analysis across multiple years. It evaluates the company's revenue, net profit, earnings per share, assets, and equity, identifying trends and potential areas of concern. The report also assesses the risks of material misstatements, considering factors like director integrity, managerial experience, and business nature. Furthermore, it examines inherent risks at the assertion level, providing a comprehensive overview of the company's financial health and potential audit challenges. The analysis includes key financial ratios such as proprietary ratio, current ratio, return on equity and net profit margin, offering insights into the company's liquidity, profitability, and financial stability. The report concludes with recommendations for auditors to ensure a thorough and accurate audit process.

Running head: AUDITING
Auditing
Name of student:
Name of the University
Authors’ note
Auditing
Name of student:
Name of the University
Authors’ note
Paraphrase This Document
Need a fresh take? Get an instant paraphrase of this document with our AI Paraphraser

1AUDITING

2AUDITING
⊘ This is a preview!⊘
Do you want full access?
Subscribe today to unlock all pages.

Trusted by 1+ million students worldwide

3AUDITING
Executive summary:
This report is particularly presenting the simple comparison and ratio analysis of Magellan
Fin Group Limited, a financial corporation for the purpose of evaluating company’s
performance. It is also representing the influences that effecting through the analysis of
companies performances. Next to this report is mentioning the material misstatements
relating to companies audit risks through the analysis of company’s annual report. After this,
the report is presenting some inherent risks at the assertion level in case to evaluate overall
performance of the company.
Paraphrase This Document
Need a fresh take? Get an instant paraphrase of this document with our AI Paraphraser

4AUDITING
Table of Contents
Requirement 1:...........................................................................................................................5
Analysis of different accounting balances and Ratios in current year:..................................5
Conclusion:..........................................................................................................................11
Requirement 2:.........................................................................................................................12
Risk relating to material misstatement (Inherent Risk) according to Magellan Fin Group
Limited’s financial report level:...........................................................................................12
Conclusions:.........................................................................................................................15
Requirement 3:.........................................................................................................................16
Risk relating to material misstatement (Inherent Risk) according to Magellan Fin Group
Limited’s Assertion level:....................................................................................................16
Conclusion:..........................................................................................................................19
References:...............................................................................................................................20

5AUDITING
Requirement 1:
Analysis of different accounting balances and Ratios in current year:
Generally, two different procedures are used in the case of analysing the financial
statement of Magellan Fin Group Limited. One is the using of simple comparison, between
the balances of three years revenues, expenses, net profit, assets balance, current liabilities
and amount of equity and the second one is using through the ratio analysis of three different
years(Home - Magellan Financial Group, 2019).
Simple Comparisons:
Revenues:
Figure 1: Revenues for the year 2016, 2017 & 2018.
Interpretation: The Company’s revenue incomes comparing with the previous years are
following the increasing trend in the present situation. In the year 2016 it was $333805, in
⊘ This is a preview!⊘
Do you want full access?
Subscribe today to unlock all pages.

Trusted by 1+ million students worldwide

6AUDITING
2017 it was 338268 and in 2018 it was 452598 (Annual Report, 2016). Such increase is due
to changes in the investment earrings of the company during those particular period.
Figure 2: Net profit for the year 2016, 2017 & 2018.
Interpretation: The Company’s Net profit comparing with the previous years are following
the increasing trend in the present situation, however it was decreased in the year 2017
followed the year 2016 due to some misconducts. The company earned $259701 in 2016,
$256127 in 2017 and $270610 in the year 2018 (Annual Report, 2017). Such changes in net
profits is occurred due to increase of revenues comparing with total expenses during this
period.
Paraphrase This Document
Need a fresh take? Get an instant paraphrase of this document with our AI Paraphraser

7AUDITING
Figure 3: EPS for the year 2016, 2017 & 2018.
Interpretation: The Company’s amount of earning per share comparing with the previous
years is following the increasing trend in the present situation however it showed the
decreasing trend in the year 2017. In the year 2016 E.P.S. is showed the balance of $123.5, in
2017 it was $116.9 and in 2018 it was $122.0 per share (Annual Report, 2018). Such increase
is occurred due to changes in the total earning comparing with total number of shares.
Figure 4: Assets for the year 2016, 2017 & 2018.

8AUDITING
Interpretation: The Company’s amount of Total assets comparing with the previous years is
following the increasing trend in the present situation. Such increasing is happen due to
continuous growth of company’s investment amount, liquidity balance and also due to
increasing the fixed assets balances. In the year 2016 the balance showed an amount of $
392379, in 2017 it was $493981 and in 2018 it was $674943(Annual Report, 2016). Such
changes in assets value is occurred due to purchase of new assets during those period.
Figure 5: Total Equity for the year 2016, 2017 & 2018.
Interpretation: The Company’s amount of Total equity comparing with the previous years is
following the increasing trend in the present situation, which implies that the continuous
increasing the number of equity share holders for the company. In the year 2016 the total
equity was $355365, in 2017 it was 447611 and in the year 2018 it was 620433(Annual
Report, 2017). Such increase in equity is due to addition of number of shareholders during
those period.
⊘ This is a preview!⊘
Do you want full access?
Subscribe today to unlock all pages.

Trusted by 1+ million students worldwide

9AUDITING
Comparison through Ratio Analysis:
Figure 6: Proprietary ratio for the year 2016, 2017 & 2018.
Interpretation: Magellan Fin Group Limited’s the proprietary ratio comparing with the
previous years is generally representing the continuous increasing trend in the present
situation. Generally the high trend in this ratio is indicating the strong financial condition of
the business. Here in case of Magellan Fin Group Limited the continuous increasing trend is
also representing the same scenario (Annual Report, 2018).
Paraphrase This Document
Need a fresh take? Get an instant paraphrase of this document with our AI Paraphraser

10AUDITING
Figure 7: Current ratio for the year 2016, 2017 & 2018.
Interpretation: Magellan Fin Group Limited’s the proprietary ratio comparing with the
previous years is generally representing the decreasing trend. Normally such ratio is use to
represent the liquidity conditions of the company in case to meet the current liabilities of the
company (Home - Magellan Financial Group, 2019). Here analysing the data from the
company’s annual report is showing the availability of sufficient amount of current assets to
meet its liabilities.

11AUDITING
Figure 8: Return on equity for the year 2016, 2017 & 2018.
Interpretation: Generally this ratio is used to express the net profit in terms of the equity
shareholders’ funds. Such ratio is considered as important yardsticks of performance for
equity owners as it represent the return on the funds invested by them (Home - Magellan
Financial Group, 2019). For Magellan Fin Group Limited such ratio is representing the
continuous decreasing trend over past three years, which means the return of individual
shares of equity holders are continuously decreasing.
Figure 9: Net profit for the year 2016, 2017 & 2018.
Interpretation: Generally this ratio is used to express the net profit in terms of total amount
of revenues. Through such ratio the earning capacity comparing with its revenue amounts are
generally analysis. In case of Magellan Fin Group Limited such ratio is representing
⊘ This is a preview!⊘
Do you want full access?
Subscribe today to unlock all pages.

Trusted by 1+ million students worldwide
1 out of 22
Related Documents
Your All-in-One AI-Powered Toolkit for Academic Success.
+13062052269
info@desklib.com
Available 24*7 on WhatsApp / Email
Unlock your academic potential
Copyright © 2020–2025 A2Z Services. All Rights Reserved. Developed and managed by ZUCOL.


