MA619 Accounting Research: Evaluating Bank Performance Using RPD
VerifiedAdded on 2023/06/11
|38
|7359
|143
Report
AI Summary
This accounting research report investigates the competitive performance and financial positions of four major Australian banks: ANZ, Westpac, Macquarie, and Suncorp. It employs Relative Profit Difference (RPD) analysis to assess the competitive strengths within the Australian banking sector. The report examines key performance indicators derived from the banks' financial statements over several years, focusing on metrics like gross revenue from interests, net interest revenue, earnings from continuous operations before tax, and net income. The analysis aims to determine the relationship between changes in financial performance and the competitive dynamics of the industry. The research methodology involves a detailed evaluation of the banks' accounting and financial reporting practices to understand the impact of competition on their performance.

Running head: ACCOUNTING RESEARCH
Accounting Research
Name of the Student:
Name of the University:
Authors Note:
Accounting Research
Name of the Student:
Name of the University:
Authors Note:
Paraphrase This Document
Need a fresh take? Get an instant paraphrase of this document with our AI Paraphraser
1
ACCOUNTING RESEARCH
Contents
Abstract:...........................................................................................................................................2
Introduction:....................................................................................................................................3
Literature review:.............................................................................................................................4
Relative Profit Difference (RPD):...................................................................................................4
Research question:...........................................................................................................................5
Methodology to be used:.................................................................................................................5
Data analysis:...................................................................................................................................5
Findings of empirical investigation:..............................................................................................28
Conclusion:....................................................................................................................................32
References:....................................................................................................................................33
Appendix:......................................................................................................................................34
2
ACCOUNTING RESEARCH
Abstract:
Banks are the foundations of any Economy. The progress and development of a country’s
Economy is very much dependent on the efficiency of its banking system. Banking system of a
country provides the financial resources to each and every sector of an economy to ensure
efficient operations of these sectors. In Australia, the banks and Banking services are governed
by the provisions of Banking Act, 1959 and Reserve Act, 1959. In addition Australian Securities
and Investments Commission Act, 2001, Australian Prudential Regulation authority Act, 1998
and Anti-Money Laundering and Counter-Terrorism Financing Act 2006 also regulates different
functions of banking system. The purpose of the discussion here is to conduct a detailed
investigation on the competitive performance and position of four well know banks in the
country. The document shall be helpful in providing important information about the financial
performance and position of Australia and New Zealand Banking Group Limited, Westpac
Banking Group, Macquarie Banking Group and Suncorp Banking Group. Conducting Relative
Profit Difference research on the four banks mentioned above to measure the competitive
strengths in banking and financial industry in Australia is explained with significant amount of
emphasis on financial performance of these four banks over the years. The data analysis shall be
conducted by taking into consideration the financial information of these banks provided in the
financial reports. The research shall specifically focus on certain key performance yardsticks and
how these have changed over the last few years to come to a particular assertion about the
findings from the research.
⊘ This is a preview!⊘
Do you want full access?
Subscribe today to unlock all pages.
Trusted by 1+ million students worldwide
3
ACCOUNTING RESEARCH
Introduction:
The Australia and New Zealand Banking Group Limited, here in after to be referred to as
ANZ, is one of the largest banks in Australia. In fact currently it is ranked third after the
Commonwealth and Westpac Banking Corporation in term of market capitalization. It largely
operates in Australia and New Zealand. Westpac Banking Corporation (Westpac) is the second
largest bank in Australia in terms of market capitalization behind Commonwealth Bank of
Australia. Headquarter of Westpac is in Sydney, New South Wales (NSW). Suncorp Group is a
Brisbane based organization that provides services in finance, banking and insurance related
matters. Macquarie is finance and baking organization listed in Australia with operations and
services spreading in different parts of the world. In order to measure the competitive strength in
an industry, different and alternative methods have been suggested. In fact still number of
theories are being developed and empirical work is been conducted to introduce new and
improved methods to measure relative strengths in different industries.
Relative Profit Difference (RPD) analysis is one such method that is used to measure the
competitive strengths in different industry. A detailed analysis of RPD and empirical
investigation on the competition between four above mentioned banks shall be conducted with
the objective of measuring competitive strengths in these banks. Boone (2008) introduced the
approach to the world where the relative profit difference can be used to measure competitive
strengths in an industry. According to Boone (2008) the efficiency of an organization will
determine the profitability of such organization. Even under extreme competitive scenario
business organization will be able to manage its profitability level by improving its efficiency.
Paraphrase This Document
Need a fresh take? Get an instant paraphrase of this document with our AI Paraphraser
4
ACCOUNTING RESEARCH
Kar, A.K. (2016) has defined that the RPD analysis is effective in the context of
Equilibrium market condition where fair number of firs operating under perfect oligopoly
market. Thus, the RPD analysis will not be effective in any other market situation and will not
provide the actual strengths of competition in a market.
Literature review:
Relative Profit Difference (RPD):
RPD approach was developed and suggested by Boone (2008) to measure competition in
an industry. The approach was suggested in the context of an industry where firms can enter and
compete despite differences in efficiency. The RPD approach assumes that initially firms are
unsure about the decision of whether to enter the market or not. However, once the firms decide
to enter the market, they look to maximize their profits. According to the theory an equilibrium
profit is established where the profit of the firms in the industry is directly related to the
efficiency of the firm. Thus, the RPD approach establishes that a firm in an industry where free
competition exists the firm’s profitability will be equal to its efficiency (Abel, Khobai & Le
Roux, 2017).
Relative Profit Difference approach is a technique developed by Boone (2008) for
measurement of competitive strengths of an industry. The approach is definitely effective but
only in equilibrium condition under multi-firm oligopoly market as explained by Kar, K.A.
(2016). In this case the industry is banking and financial sector in Australia. The shortcoming of
the RPD approach in this specific industry is that the banking and financial sector in Australia
can hardly be defined as multi-firm oligopoly market. Neither there is equilibrium condition in
the market place.
5
ACCOUNTING RESEARCH
Since time in memorial scholars are looking to develop better methods to measure the strengths
of competition in an industry with significant results to show their efforts. RPD approach of
Boone (2008) is one of such approach that provide a different scope and measurement technique
to measure the competitive strengths in an industry. This approach definitely helps in assessing
the relative strengths of firms in an industry. However, to measure the competitive strengths of
an entire industry with relative profit difference approach is definitely a challenging task and
requires impeccable methodology to collect data on the basis of which analysis shall be
conducted to form a particular conclusion. Apart from that all underlying variables must be
present and assumption must be correct in order to measure the competitive strengths of an
industry effectively.
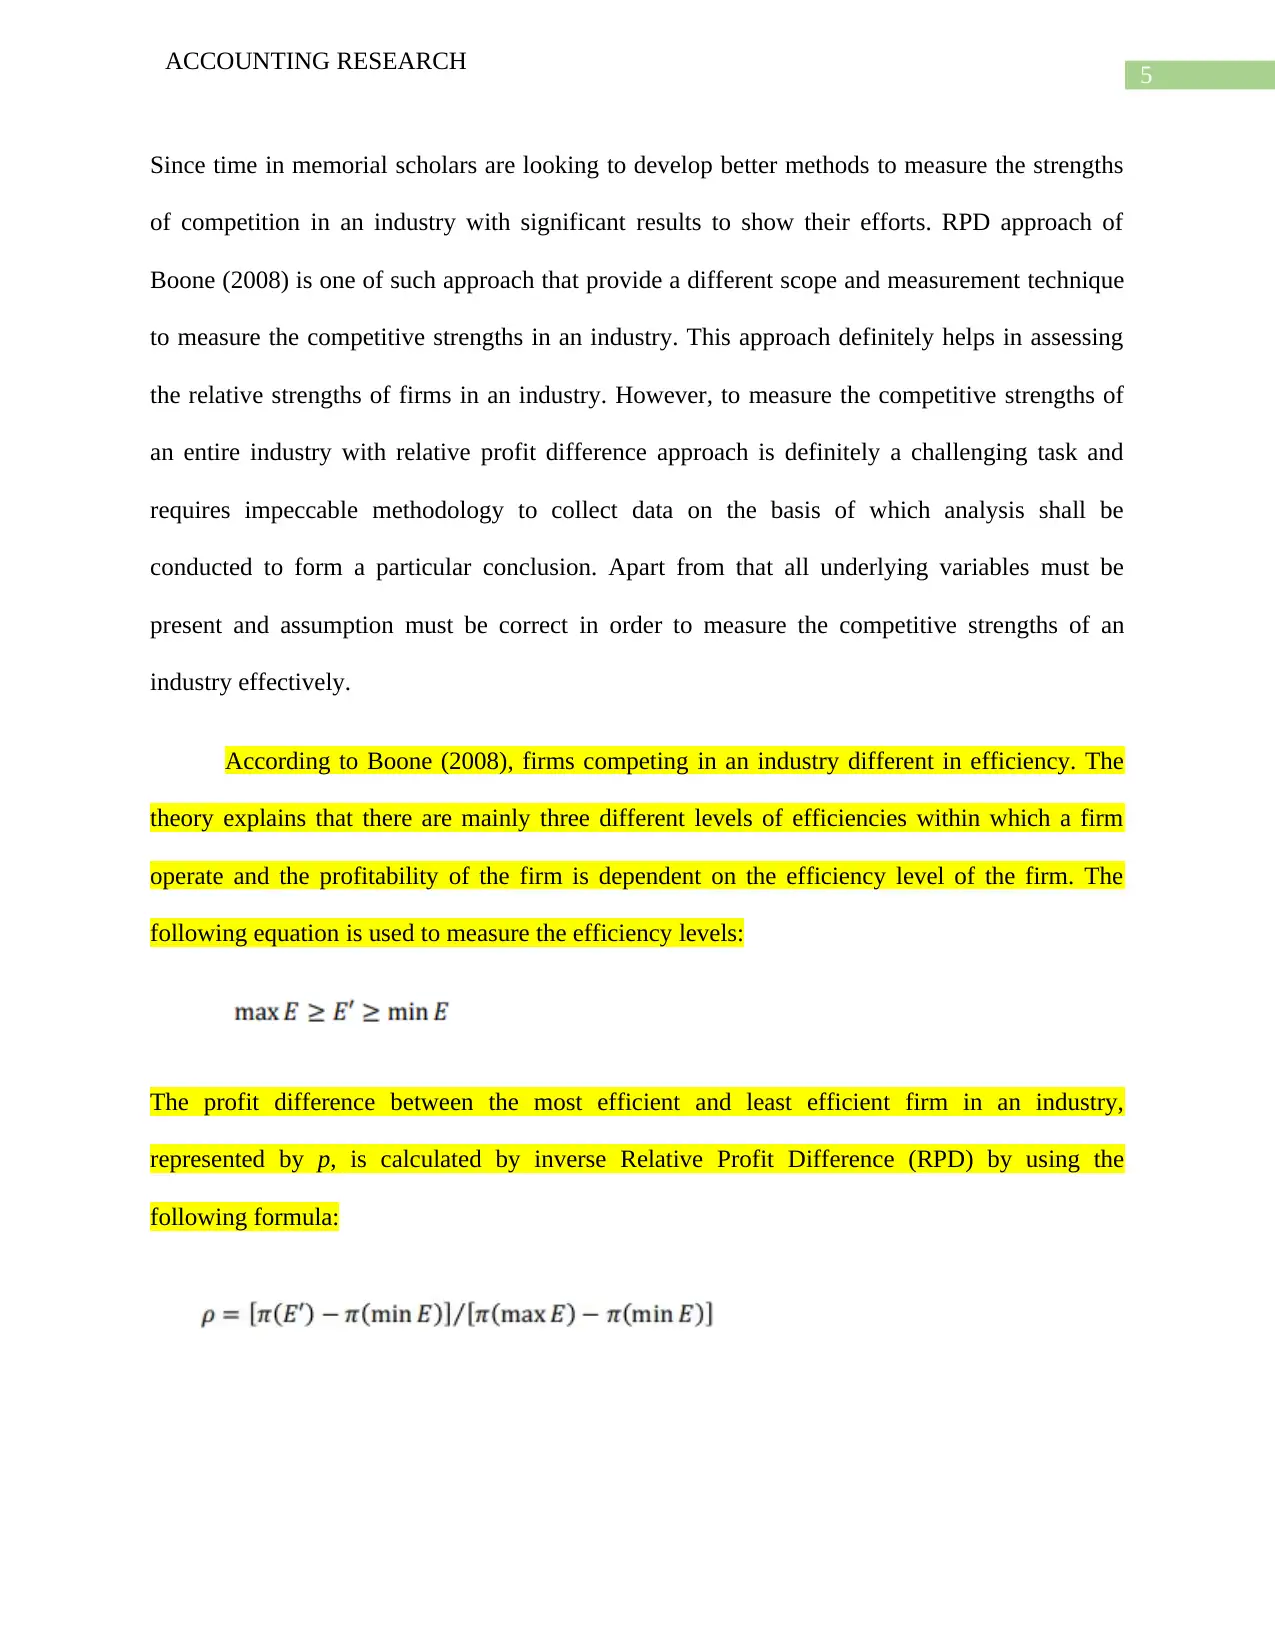
According to Boone (2008), firms competing in an industry different in efficiency. The
theory explains that there are mainly three different levels of efficiencies within which a firm
operate and the profitability of the firm is dependent on the efficiency level of the firm. The
following equation is used to measure the efficiency levels:
The profit difference between the most efficient and least efficient firm in an industry,
represented by p, is calculated by inverse Relative Profit Difference (RPD) by using the
following formula:
ACCOUNTING RESEARCH
Since time in memorial scholars are looking to develop better methods to measure the strengths
of competition in an industry with significant results to show their efforts. RPD approach of
Boone (2008) is one of such approach that provide a different scope and measurement technique
to measure the competitive strengths in an industry. This approach definitely helps in assessing
the relative strengths of firms in an industry. However, to measure the competitive strengths of
an entire industry with relative profit difference approach is definitely a challenging task and
requires impeccable methodology to collect data on the basis of which analysis shall be
conducted to form a particular conclusion. Apart from that all underlying variables must be
present and assumption must be correct in order to measure the competitive strengths of an
industry effectively.
According to Boone (2008), firms competing in an industry different in efficiency. The
theory explains that there are mainly three different levels of efficiencies within which a firm
operate and the profitability of the firm is dependent on the efficiency level of the firm. The
following equation is used to measure the efficiency levels:
The profit difference between the most efficient and least efficient firm in an industry,
represented by p, is calculated by inverse Relative Profit Difference (RPD) by using the
following formula:
⊘ This is a preview!⊘
Do you want full access?
Subscribe today to unlock all pages.
Trusted by 1+ million students worldwide
6
ACCOUNTING RESEARCH
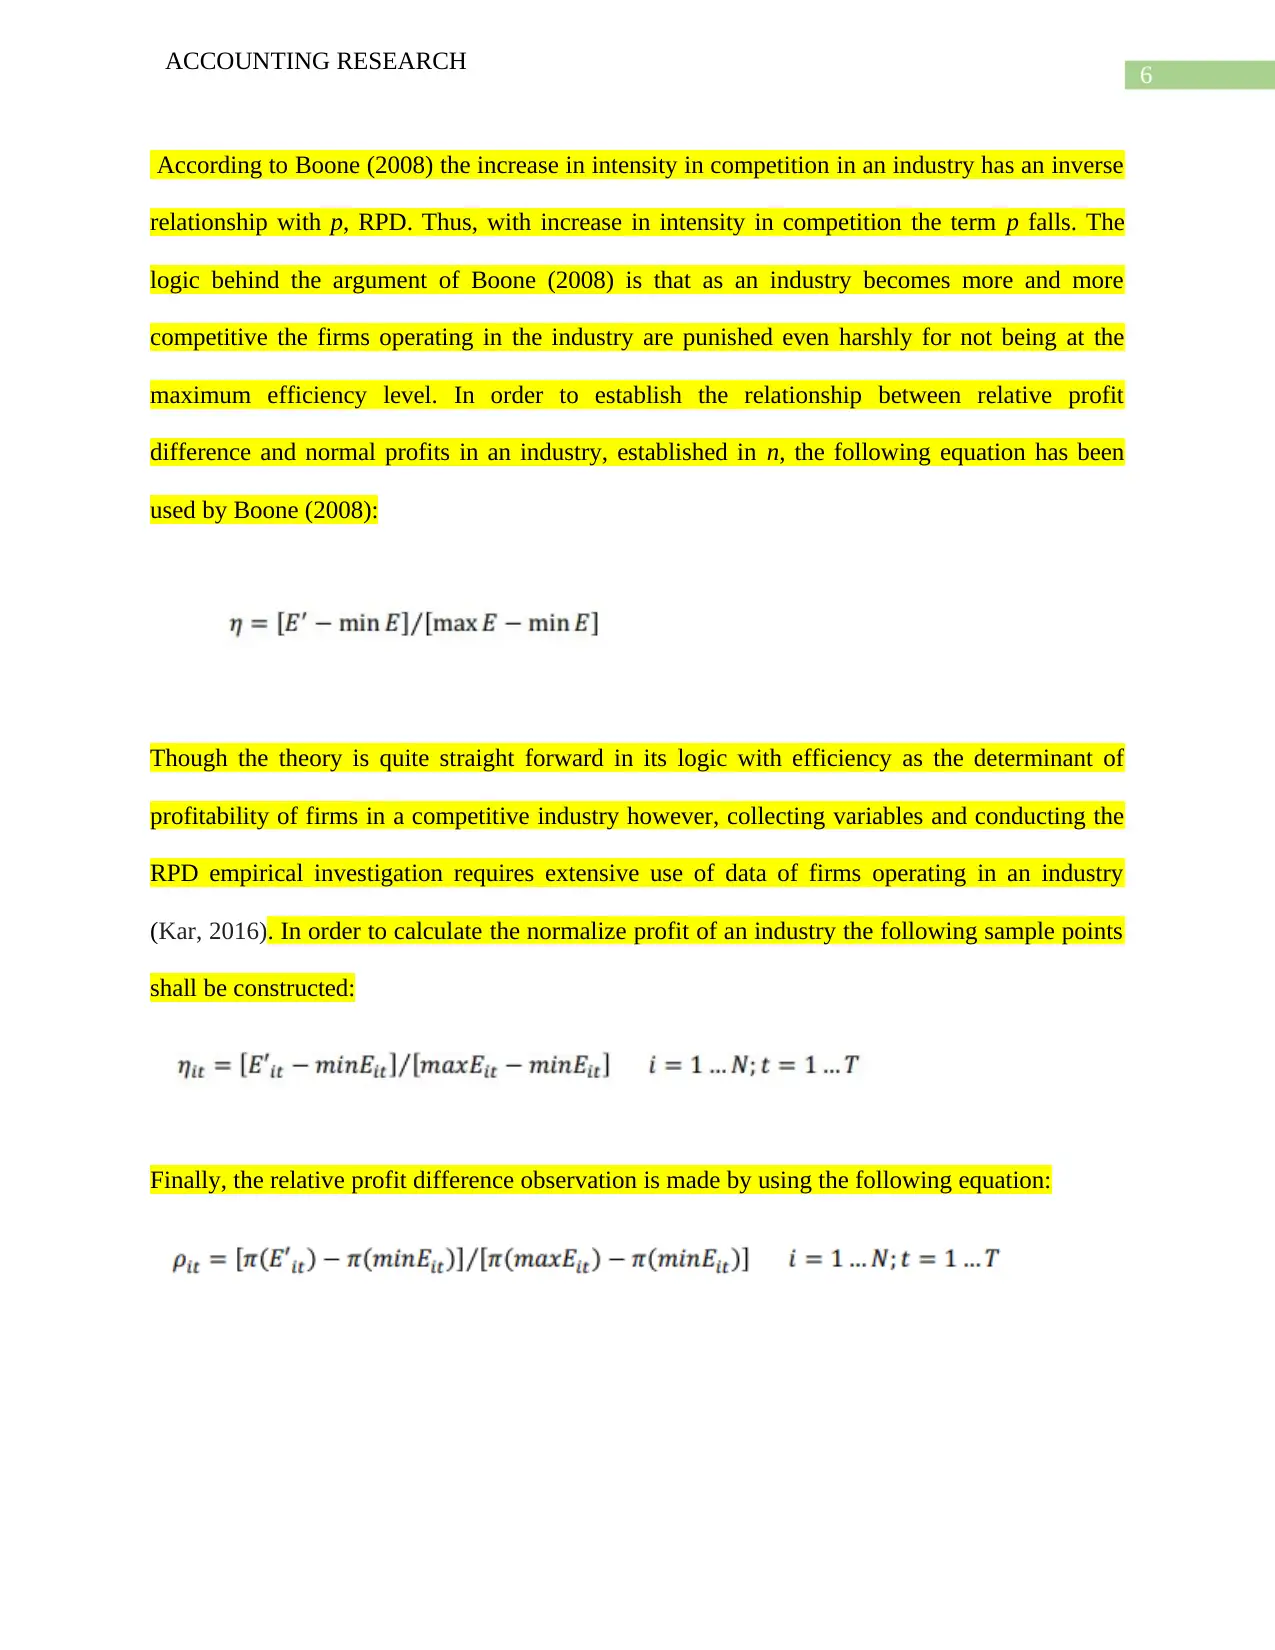
According to Boone (2008) the increase in intensity in competition in an industry has an inverse
relationship with p, RPD. Thus, with increase in intensity in competition the term p falls. The
logic behind the argument of Boone (2008) is that as an industry becomes more and more
competitive the firms operating in the industry are punished even harshly for not being at the
maximum efficiency level. In order to establish the relationship between relative profit
difference and normal profits in an industry, established in n, the following equation has been
used by Boone (2008):
Though the theory is quite straight forward in its logic with efficiency as the determinant of
profitability of firms in a competitive industry however, collecting variables and conducting the
RPD empirical investigation requires extensive use of data of firms operating in an industry
(Kar, 2016). In order to calculate the normalize profit of an industry the following sample points
shall be constructed:
Finally, the relative profit difference observation is made by using the following equation:
ACCOUNTING RESEARCH
According to Boone (2008) the increase in intensity in competition in an industry has an inverse
relationship with p, RPD. Thus, with increase in intensity in competition the term p falls. The
logic behind the argument of Boone (2008) is that as an industry becomes more and more
competitive the firms operating in the industry are punished even harshly for not being at the
maximum efficiency level. In order to establish the relationship between relative profit
difference and normal profits in an industry, established in n, the following equation has been
used by Boone (2008):
Though the theory is quite straight forward in its logic with efficiency as the determinant of
profitability of firms in a competitive industry however, collecting variables and conducting the
RPD empirical investigation requires extensive use of data of firms operating in an industry
(Kar, 2016). In order to calculate the normalize profit of an industry the following sample points
shall be constructed:
Finally, the relative profit difference observation is made by using the following equation:
Paraphrase This Document
Need a fresh take? Get an instant paraphrase of this document with our AI Paraphraser
7
ACCOUNTING RESEARCH
Research question:
How the financial performance of 4 banks have affected over the years and is there a direct
connection between the changes in financial performance of these banks and the
competitive strengths of the industry?
The data shall be collected from the financial statements of these banks to evaluate the changes
in the key performance yardsticks of these banks such as revenue, profit and others to explain the
impact of competition in the market. The RPD analysis shall be conducted to calculate the
relative difference in profits of these entities over the years and how the competition in the
industry has influenced the performances of these banks.
Methodology to be used:
Taking into consideration the approach that RPD methodology used to measure the competition
in an industry a detailed investigation of the financial performance of the four banks, i.e. ANZ,
Macquarie, Westpac and Suncorp, shall be conducted with specific focus on accounting and
financial reporting aspects of these banks.
Data analysis:
ANZ:
In order to investigate the financial performance of ANZ over the last few years the income
statements of the company for last few years shall be evaluated. A simple evaluation of the
income statements of the company over the years shall be helpful in assessing how the bank has
performed over the years. However, in order to analyse the competitive performance of the bank
a comparative analysis of the bank’s performance shall be conducted with the performance of
other three banks.
8
ACCOUNTING RESEARCH
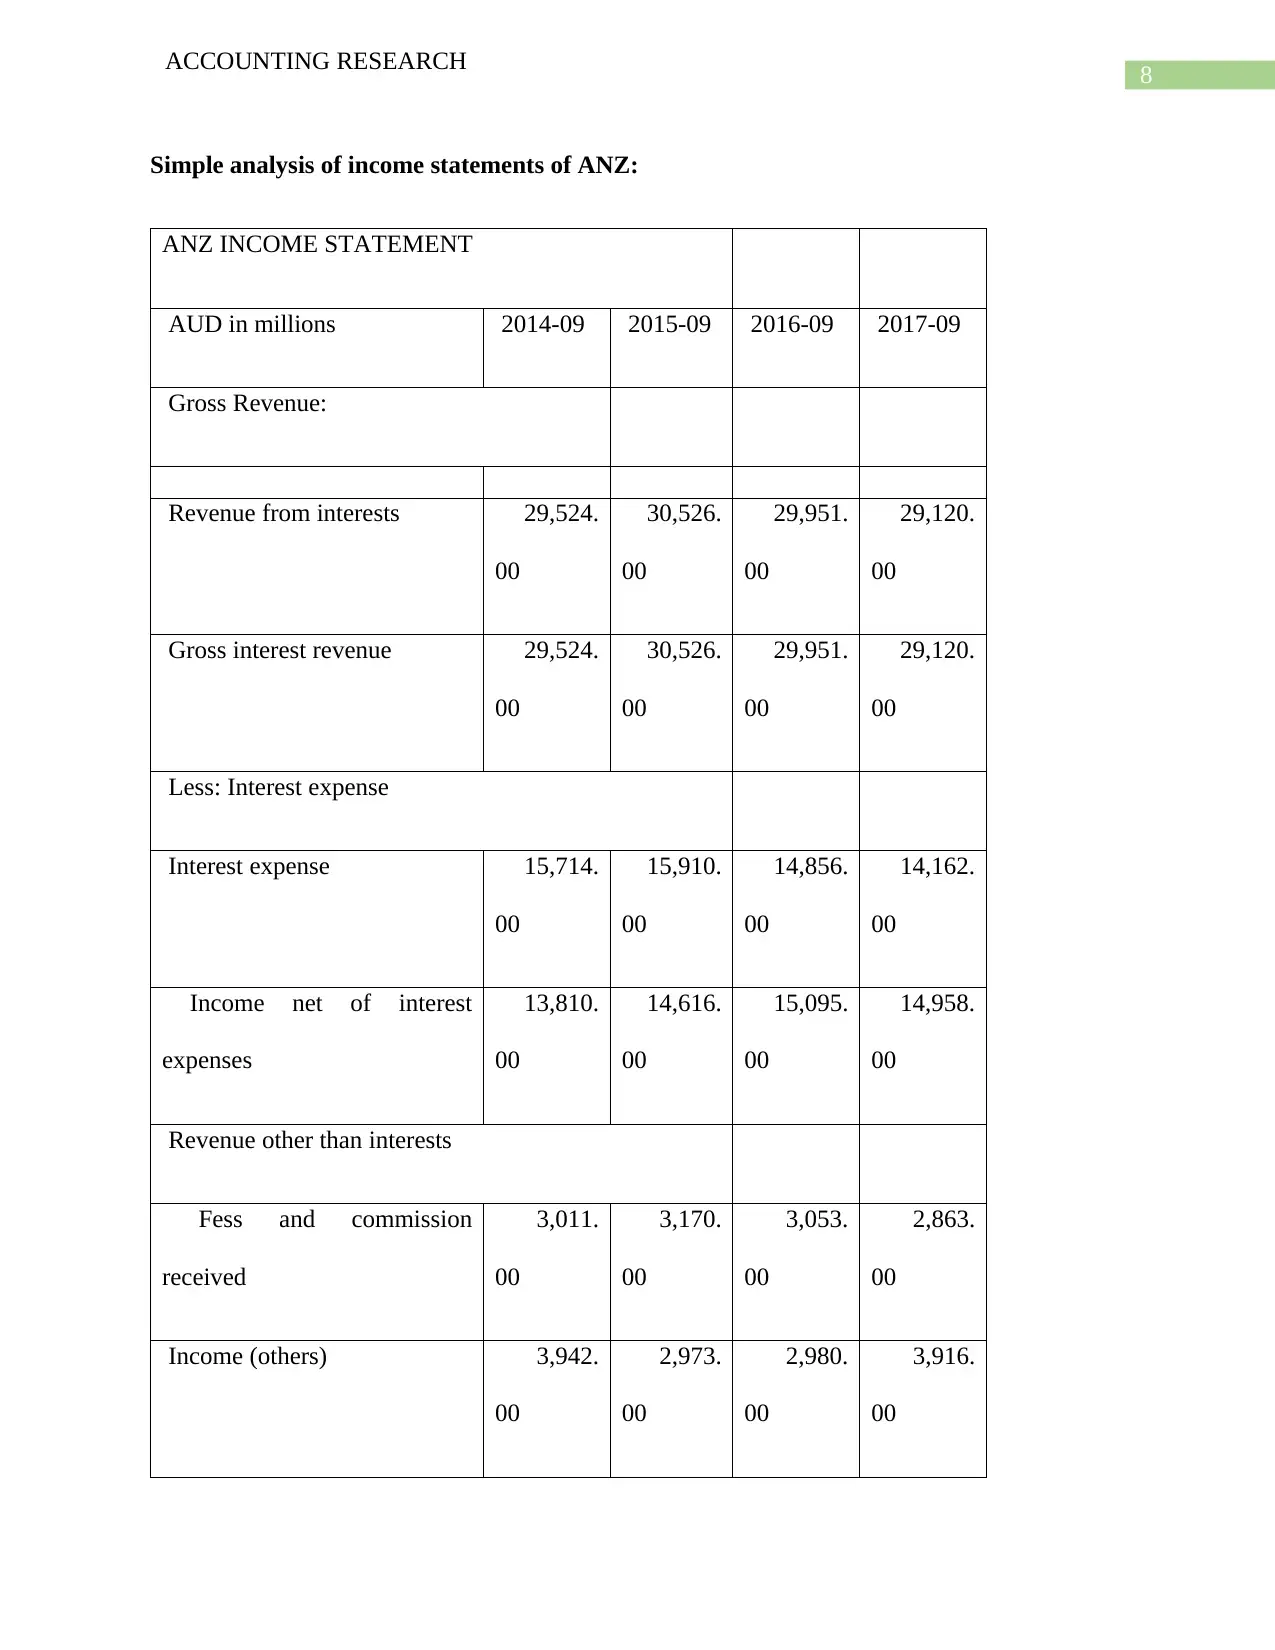
Simple analysis of income statements of ANZ:
ANZ INCOME STATEMENT
AUD in millions 2014-09 2015-09 2016-09 2017-09
Gross Revenue:
Revenue from interests 29,524.
00
30,526.
00
29,951.
00
29,120.
00
Gross interest revenue 29,524.
00
30,526.
00
29,951.
00
29,120.
00
Less: Interest expense
Interest expense 15,714.
00
15,910.
00
14,856.
00
14,162.
00
Income net of interest
expenses
13,810.
00
14,616.
00
15,095.
00
14,958.
00
Revenue other than interests
Fess and commission
received
3,011.
00
3,170.
00
3,053.
00
2,863.
00
Income (others) 3,942.
00
2,973.
00
2,980.
00
3,916.
00
ACCOUNTING RESEARCH
Simple analysis of income statements of ANZ:
ANZ INCOME STATEMENT
AUD in millions 2014-09 2015-09 2016-09 2017-09
Gross Revenue:
Revenue from interests 29,524.
00
30,526.
00
29,951.
00
29,120.
00
Gross interest revenue 29,524.
00
30,526.
00
29,951.
00
29,120.
00
Less: Interest expense
Interest expense 15,714.
00
15,910.
00
14,856.
00
14,162.
00
Income net of interest
expenses
13,810.
00
14,616.
00
15,095.
00
14,958.
00
Revenue other than interests
Fess and commission
received
3,011.
00
3,170.
00
3,053.
00
2,863.
00
Income (others) 3,942.
00
2,973.
00
2,980.
00
3,916.
00
⊘ This is a preview!⊘
Do you want full access?
Subscribe today to unlock all pages.
Trusted by 1+ million students worldwide
9
ACCOUNTING RESEARCH
Non-interest revenue in total 6,953.
00
6,143.
00
6,033.
00
6,779.
00
Net revenue 20,763.
00
20,759.
00
21,128.
00
21,737.
00
Credit loss provisions 986.
00
1,179.
00
1,929.
00
1,198.
00
Noninterest expenses
Expenses for compensation
and benefits paid
5,088.
00
5,479.
00
5,541.
00
5,178.
00
Expenses on technology and
communication equipment
690.
00
730.
00
734.
00
911.
00
Fees paid to professionals 253.
00
360.
00
450.
00
469.
00
Amortization costs 89.
00
88.
00
83.
00
Cost of merger, acquisition,
and restructuring
113.
00
31.
00
278.
00
62.
00
Extraordinary charges 43.
00
17.
00
27.
00
Other expenses 2,050. 2,358. 2,742. 2,761.
Paraphrase This Document
Need a fresh take? Get an instant paraphrase of this document with our AI Paraphraser
10
ACCOUNTING RESEARCH
00 00 00 00
Total expenses (Non-interest) 8,326.
00
9,063.
00
9,855.
00
9,381.
00
Earnings from continuous
operations before tax
11,451.
00
10,517.
00
9,344.
00
11,158.
00
Provision (benefit) for taxes 3,025.
00
3,026.
00
2,458.
00
3,206.
00
Other income (expense) (1,155.0
0)
2.
00
(1,177.0
0)
(1,546.0
0)
Net income after tax 7,271.
00
7,493.
00
5,709.
00
6,406.
00
Preferred dividend 6.
00
1.
00
earnings available to common
shareholders
7,265.
00
7,492.
00
5,709.
00
6,406.
00
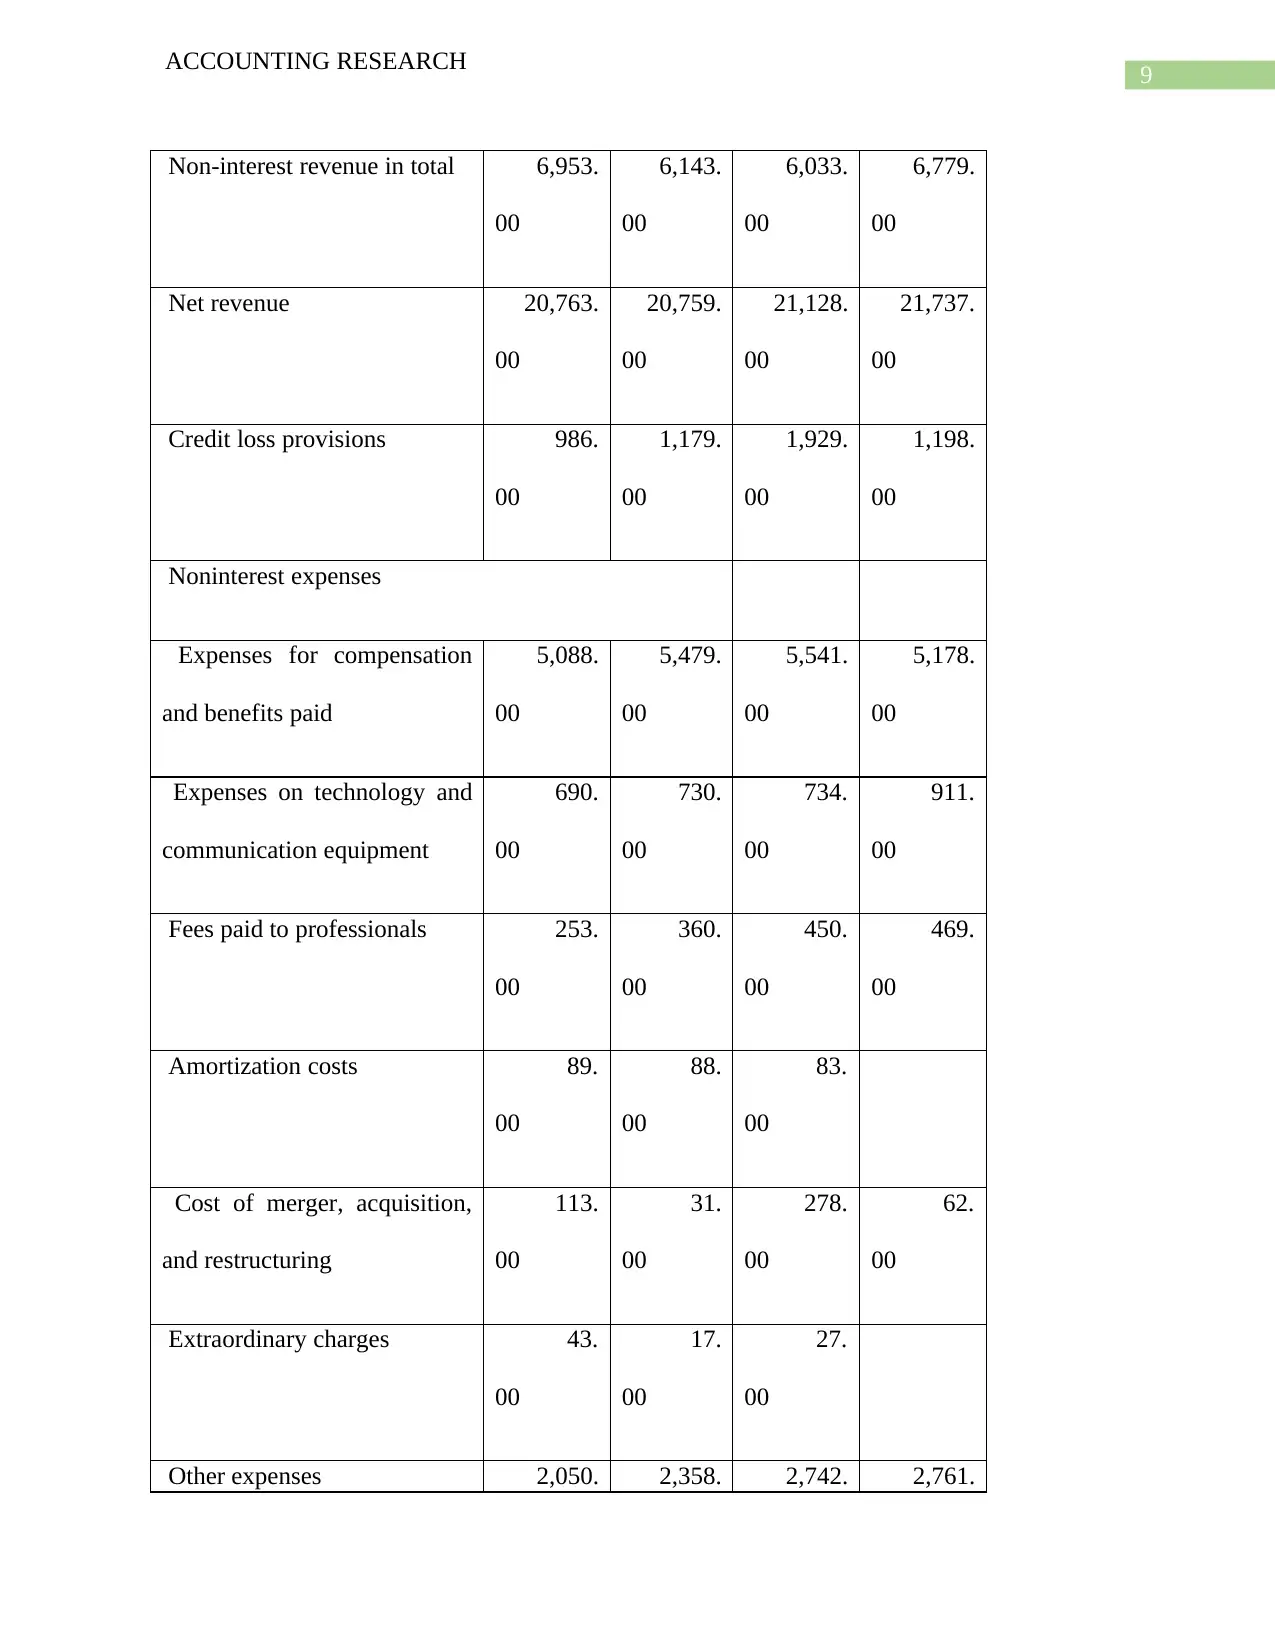
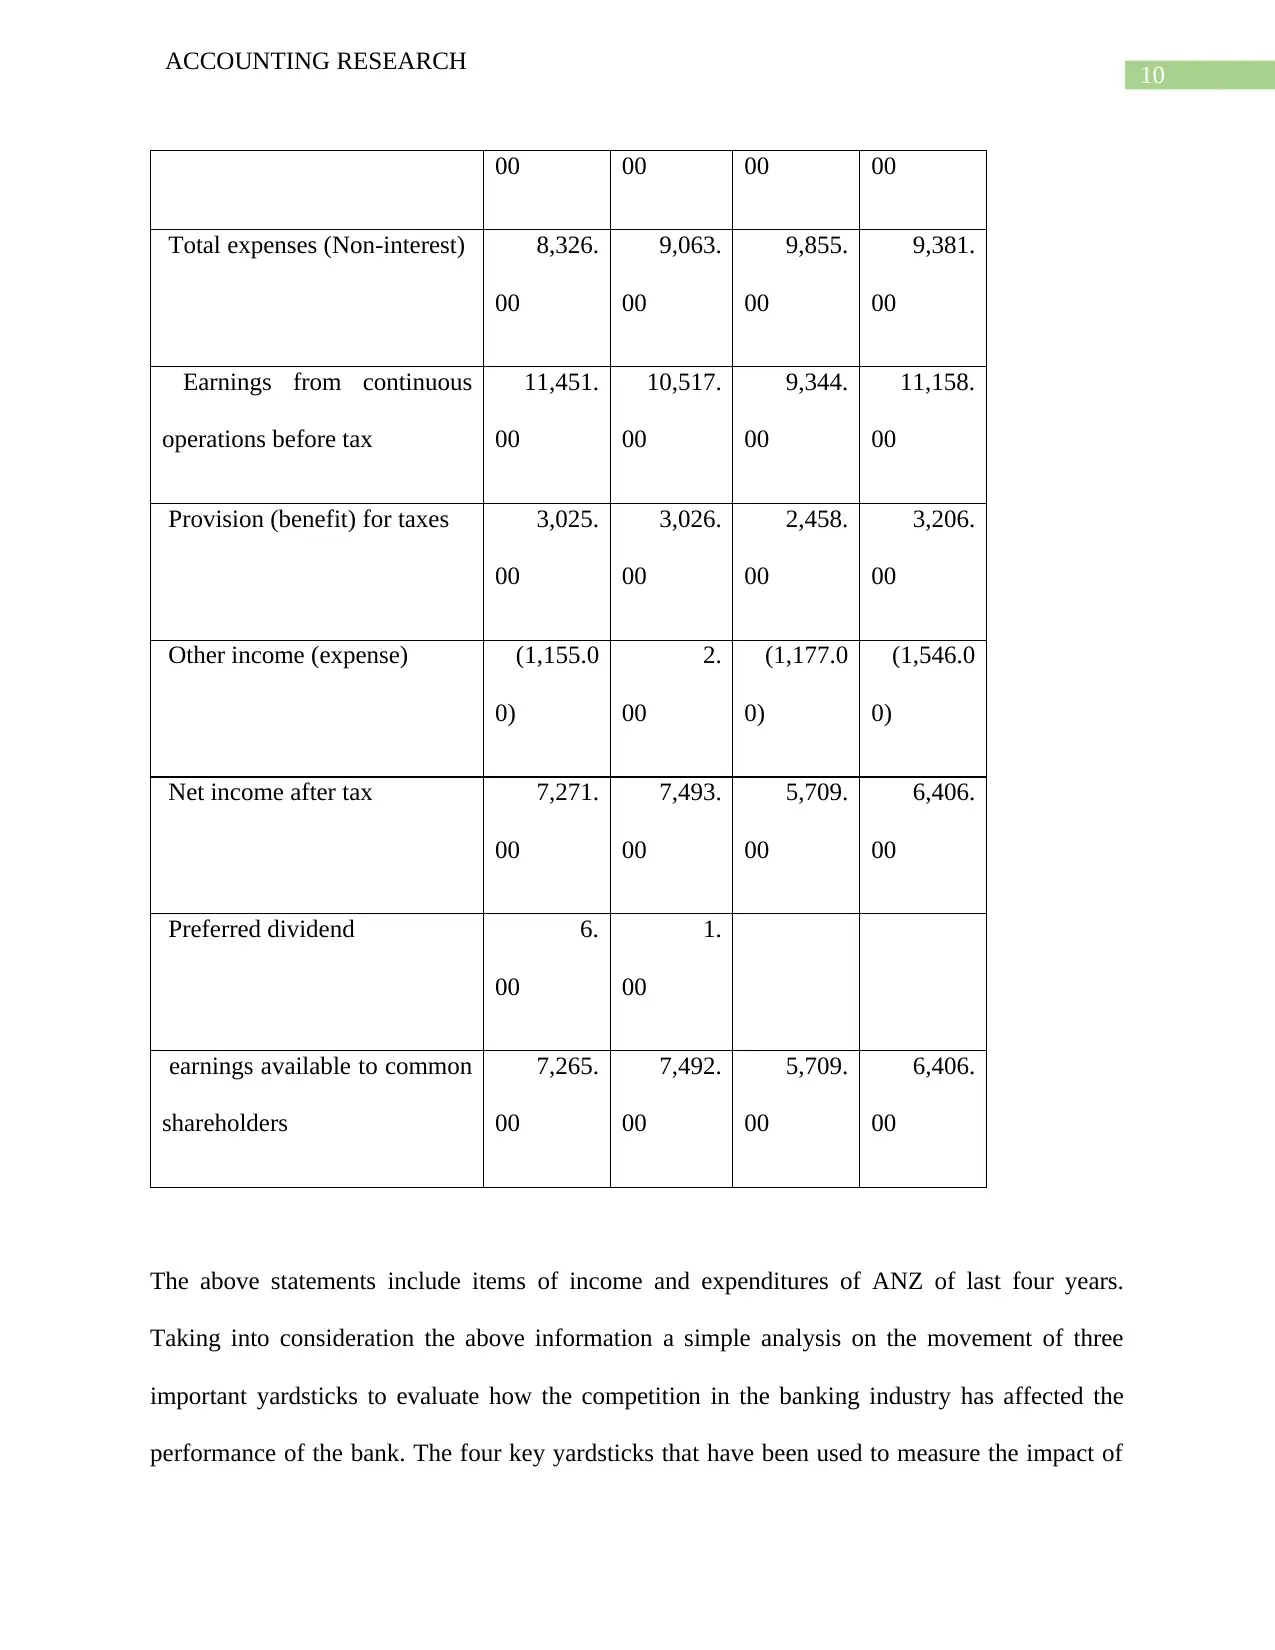
The above statements include items of income and expenditures of ANZ of last four years.
Taking into consideration the above information a simple analysis on the movement of three
important yardsticks to evaluate how the competition in the banking industry has affected the
performance of the bank. The four key yardsticks that have been used to measure the impact of
ACCOUNTING RESEARCH
00 00 00 00
Total expenses (Non-interest) 8,326.
00
9,063.
00
9,855.
00
9,381.
00
Earnings from continuous
operations before tax
11,451.
00
10,517.
00
9,344.
00
11,158.
00
Provision (benefit) for taxes 3,025.
00
3,026.
00
2,458.
00
3,206.
00
Other income (expense) (1,155.0
0)
2.
00
(1,177.0
0)
(1,546.0
0)
Net income after tax 7,271.
00
7,493.
00
5,709.
00
6,406.
00
Preferred dividend 6.
00
1.
00
earnings available to common
shareholders
7,265.
00
7,492.
00
5,709.
00
6,406.
00
The above statements include items of income and expenditures of ANZ of last four years.
Taking into consideration the above information a simple analysis on the movement of three
important yardsticks to evaluate how the competition in the banking industry has affected the
performance of the bank. The four key yardsticks that have been used to measure the impact of
11
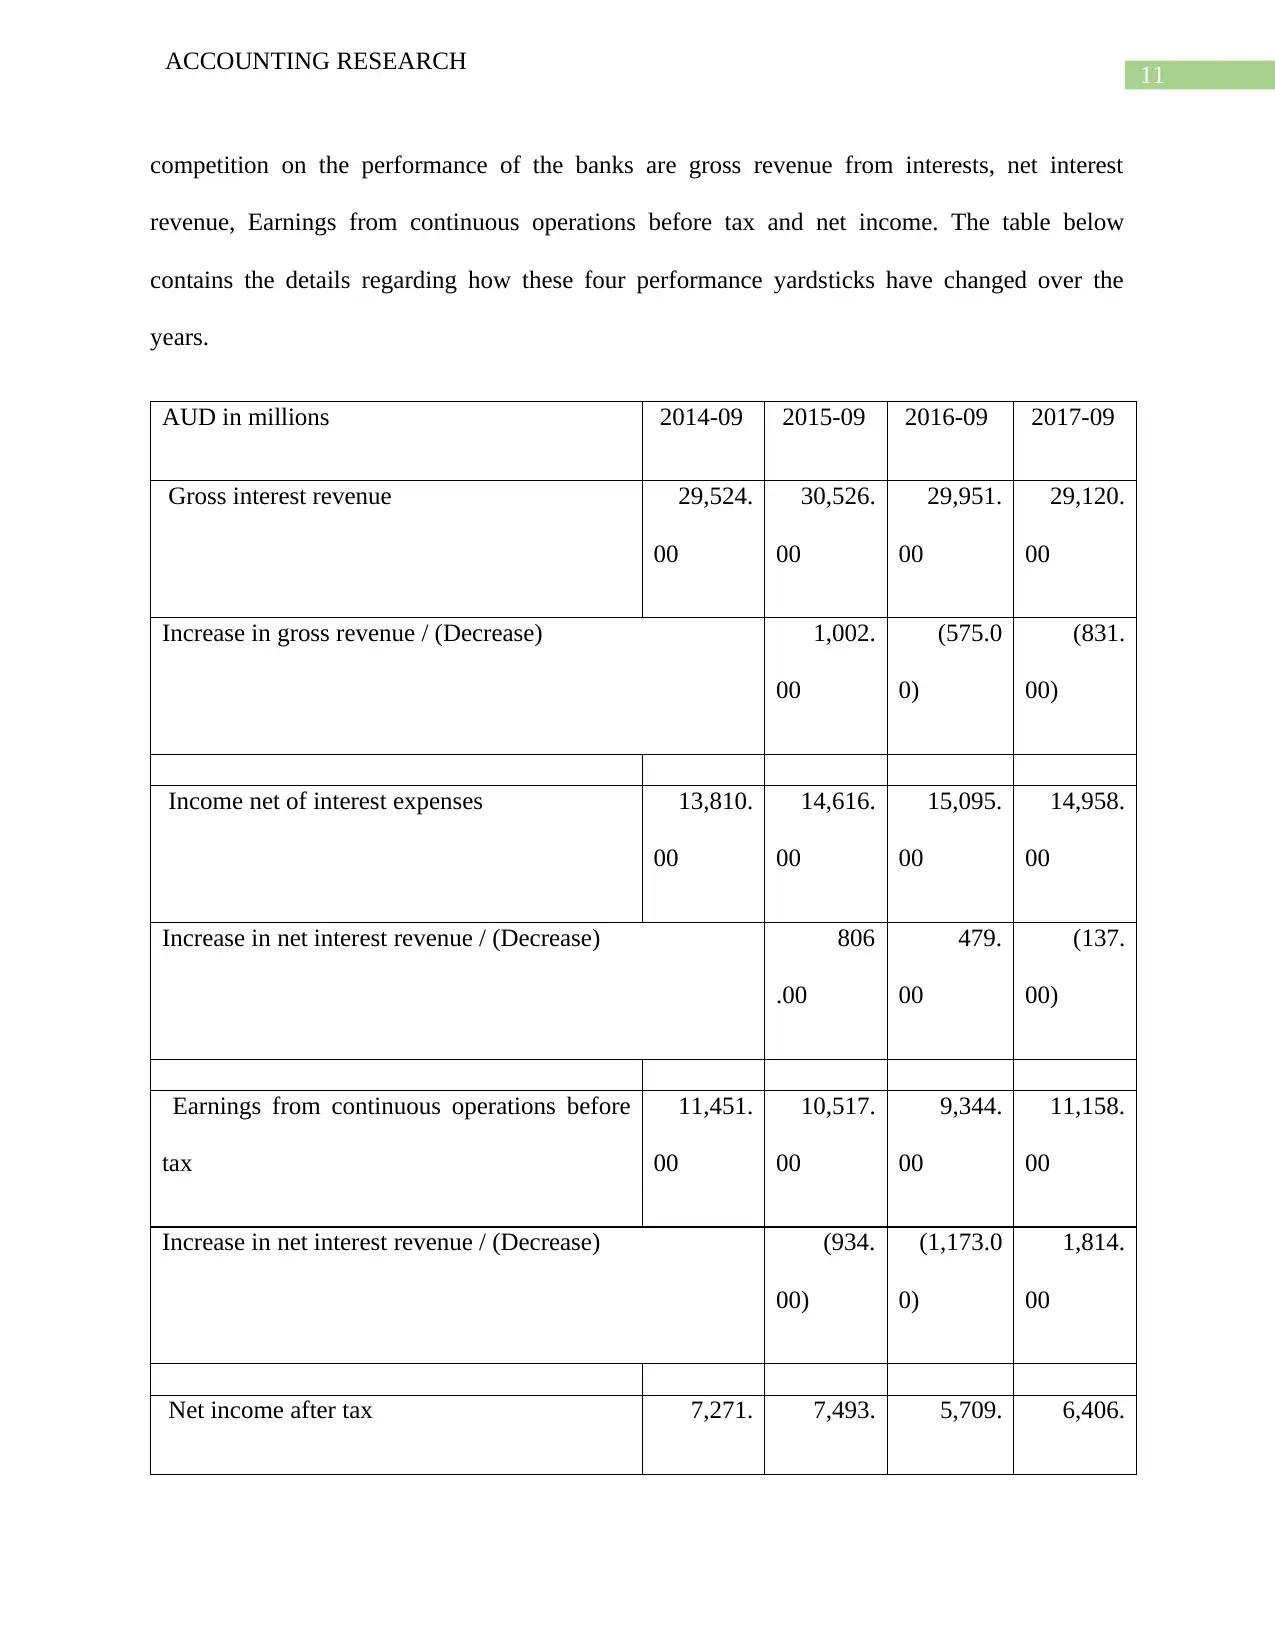
ACCOUNTING RESEARCH
competition on the performance of the banks are gross revenue from interests, net interest
revenue, Earnings from continuous operations before tax and net income. The table below
contains the details regarding how these four performance yardsticks have changed over the
years.
AUD in millions 2014-09 2015-09 2016-09 2017-09
Gross interest revenue 29,524.
00
30,526.
00
29,951.
00
29,120.
00
Increase in gross revenue / (Decrease) 1,002.
00
(575.0
0)
(831.
00)
Income net of interest expenses 13,810.
00
14,616.
00
15,095.
00
14,958.
00
Increase in net interest revenue / (Decrease) 806
.00
479.
00
(137.
00)
Earnings from continuous operations before
tax
11,451.
00
10,517.
00
9,344.
00
11,158.
00
Increase in net interest revenue / (Decrease) (934.
00)
(1,173.0
0)
1,814.
00
Net income after tax 7,271. 7,493. 5,709. 6,406.
⊘ This is a preview!⊘
Do you want full access?
Subscribe today to unlock all pages.
Trusted by 1+ million students worldwide
1 out of 38
Related Documents


Your All-in-One AI-Powered Toolkit for Academic Success.
+13062052269
info@desklib.com
Available 24*7 on WhatsApp / Email
![[object Object]](/_next/static/media/star-bottom.7253800d.svg)
Unlock your academic potential
Copyright © 2020–2026 A2Z Services. All Rights Reserved. Developed and managed by ZUCOL.