MAA262 Management Accounting: Purity Ltd Revenue Budget, 2019
VerifiedAdded on 2023/04/19
|13
|2401
|118
Homework Assignment
AI Summary
This assignment solution covers various aspects of management accounting, including the preparation of a revenue budget for Purity Ltd, calculation of minimum production volume, and analysis of beginning inventory. It also addresses cash flow estimation, return on investment (ROI) analysis for different divisions, and the calculation of residual income under varying assumptions. Furthermore, the solution advises on production arrangements to maximize profit, performs direct material and labor variance analysis, and links these variances to assess their overall impact on the company. The analysis incorporates relevant references to support the findings and recommendations.

Management Accounting
Paraphrase This Document
Need a fresh take? Get an instant paraphrase of this document with our AI Paraphraser
Table of Contents
Question 1........................................................................................................................................4
a) Revenues budget for Purity Ltd for the year ending 31 December 2019................................4
b) Minimum number of 1-litre bottles Purity Ltd must produce during 2019.............................4
c) The amount of beginning inventory of 15-litre containers on 1 January 2019.......................4
Question 2........................................................................................................................................5
Calculation of the estimated cash received from debtors in May 2015.......................................5
Question 3........................................................................................................................................5
a) Which Division is more successful on the basis of ROI.........................................................5
b) Calculation of Residual income under each of assumption....................................................6
c) ROI may lead to bad decision and ways to overcome this problem........................................6
Question 4........................................................................................................................................7
Advise the company how to arrange the production of each product to maximize the
company’s profit..........................................................................................................................7
Question 5........................................................................................................................................8
a)Direct materials price and quantity variances...........................................................................8
b) Direct labor rate and efficiency variances...............................................................................9
c) Linked in the variance computed in part (a) and (b).............................................................10
References......................................................................................................................................11
QUESTION 1
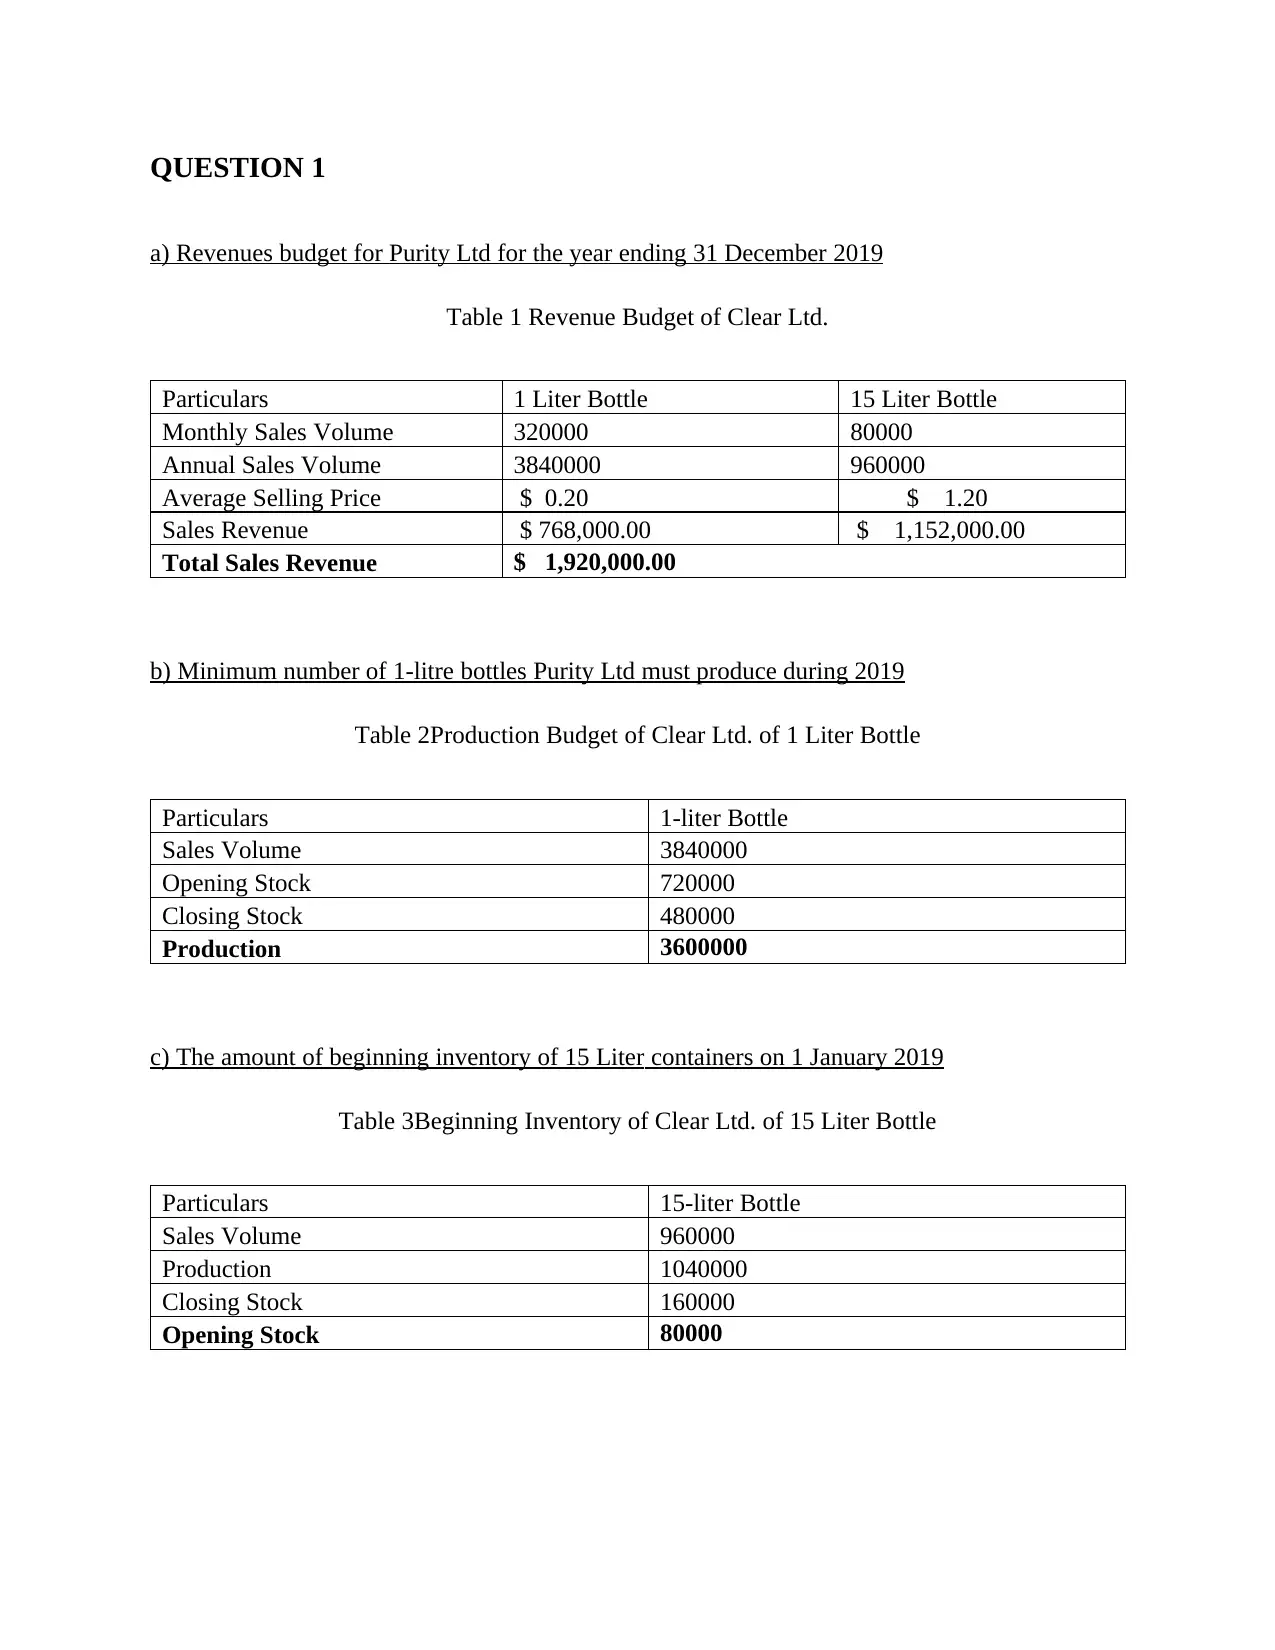
a) Revenues budget for Purity Ltd for the year ending 31 December 2019
Table 1 Revenue Budget of Clear Ltd.
Particulars 1 Liter Bottle 15 Liter Bottle
Monthly Sales Volume 320000 80000
Annual Sales Volume 3840000 960000
Average Selling Price $ 0.20 $ 1.20
Sales Revenue $ 768,000.00 $ 1,152,000.00
Total Sales Revenue $ 1,920,000.00
b) Minimum number of 1-litre bottles Purity Ltd must produce during 2019
Table 2Production Budget of Clear Ltd. of 1 Liter Bottle
Particulars 1-liter Bottle
Sales Volume 3840000
Opening Stock 720000
Closing Stock 480000
Production 3600000
c) The amount of beginning inventory of 15 Liter containers on 1 January 2019
Table 3Beginning Inventory of Clear Ltd. of 15 Liter Bottle
Particulars 15-liter Bottle
Sales Volume 960000
Production 1040000
Closing Stock 160000
Opening Stock 80000
⊘ This is a preview!⊘
Do you want full access?
Subscribe today to unlock all pages.
Trusted by 1+ million students worldwide
QUESTION 2
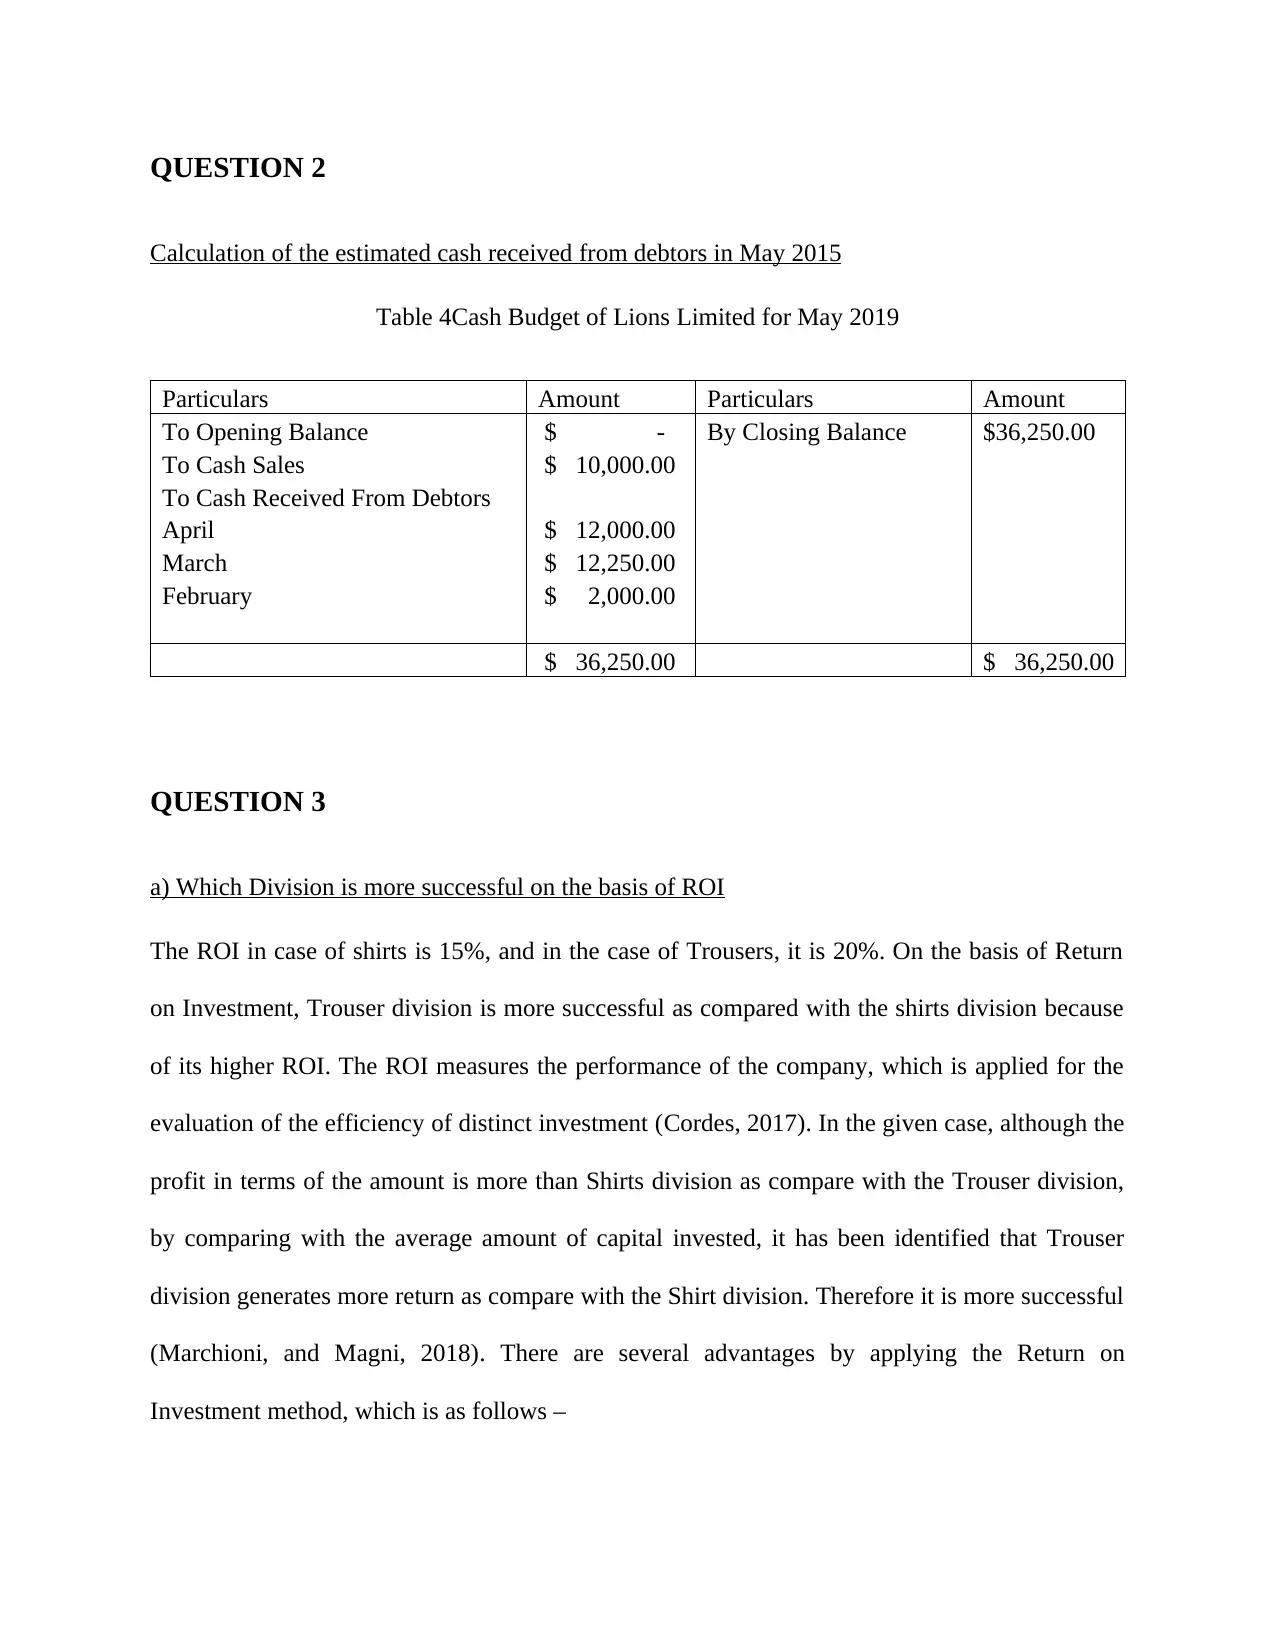
Calculation of the estimated cash received from debtors in May 2015
Table 4Cash Budget of Lions Limited for May 2019
Particulars Amount Particulars Amount
To Opening Balance $ - By Closing Balance $36,250.00
To Cash Sales $ 10,000.00
To Cash Received From Debtors
April $ 12,000.00
March $ 12,250.00
February $ 2,000.00
$ 36,250.00 $ 36,250.00
QUESTION 3
a) Which Division is more successful on the basis of ROI
The ROI in case of shirts is 15%, and in the case of Trousers, it is 20%. On the basis of Return
on Investment, Trouser division is more successful as compared with the shirts division because
of its higher ROI. The ROI measures the performance of the company, which is applied for the
evaluation of the efficiency of distinct investment (Cordes, 2017). In the given case, although the
profit in terms of the amount is more than Shirts division as compare with the Trouser division,
by comparing with the average amount of capital invested, it has been identified that Trouser
division generates more return as compare with the Shirt division. Therefore it is more successful
(Marchioni, and Magni, 2018). There are several advantages by applying the Return on
Investment method, which is as follows –
Paraphrase This Document
Need a fresh take? Get an instant paraphrase of this document with our AI Paraphraser
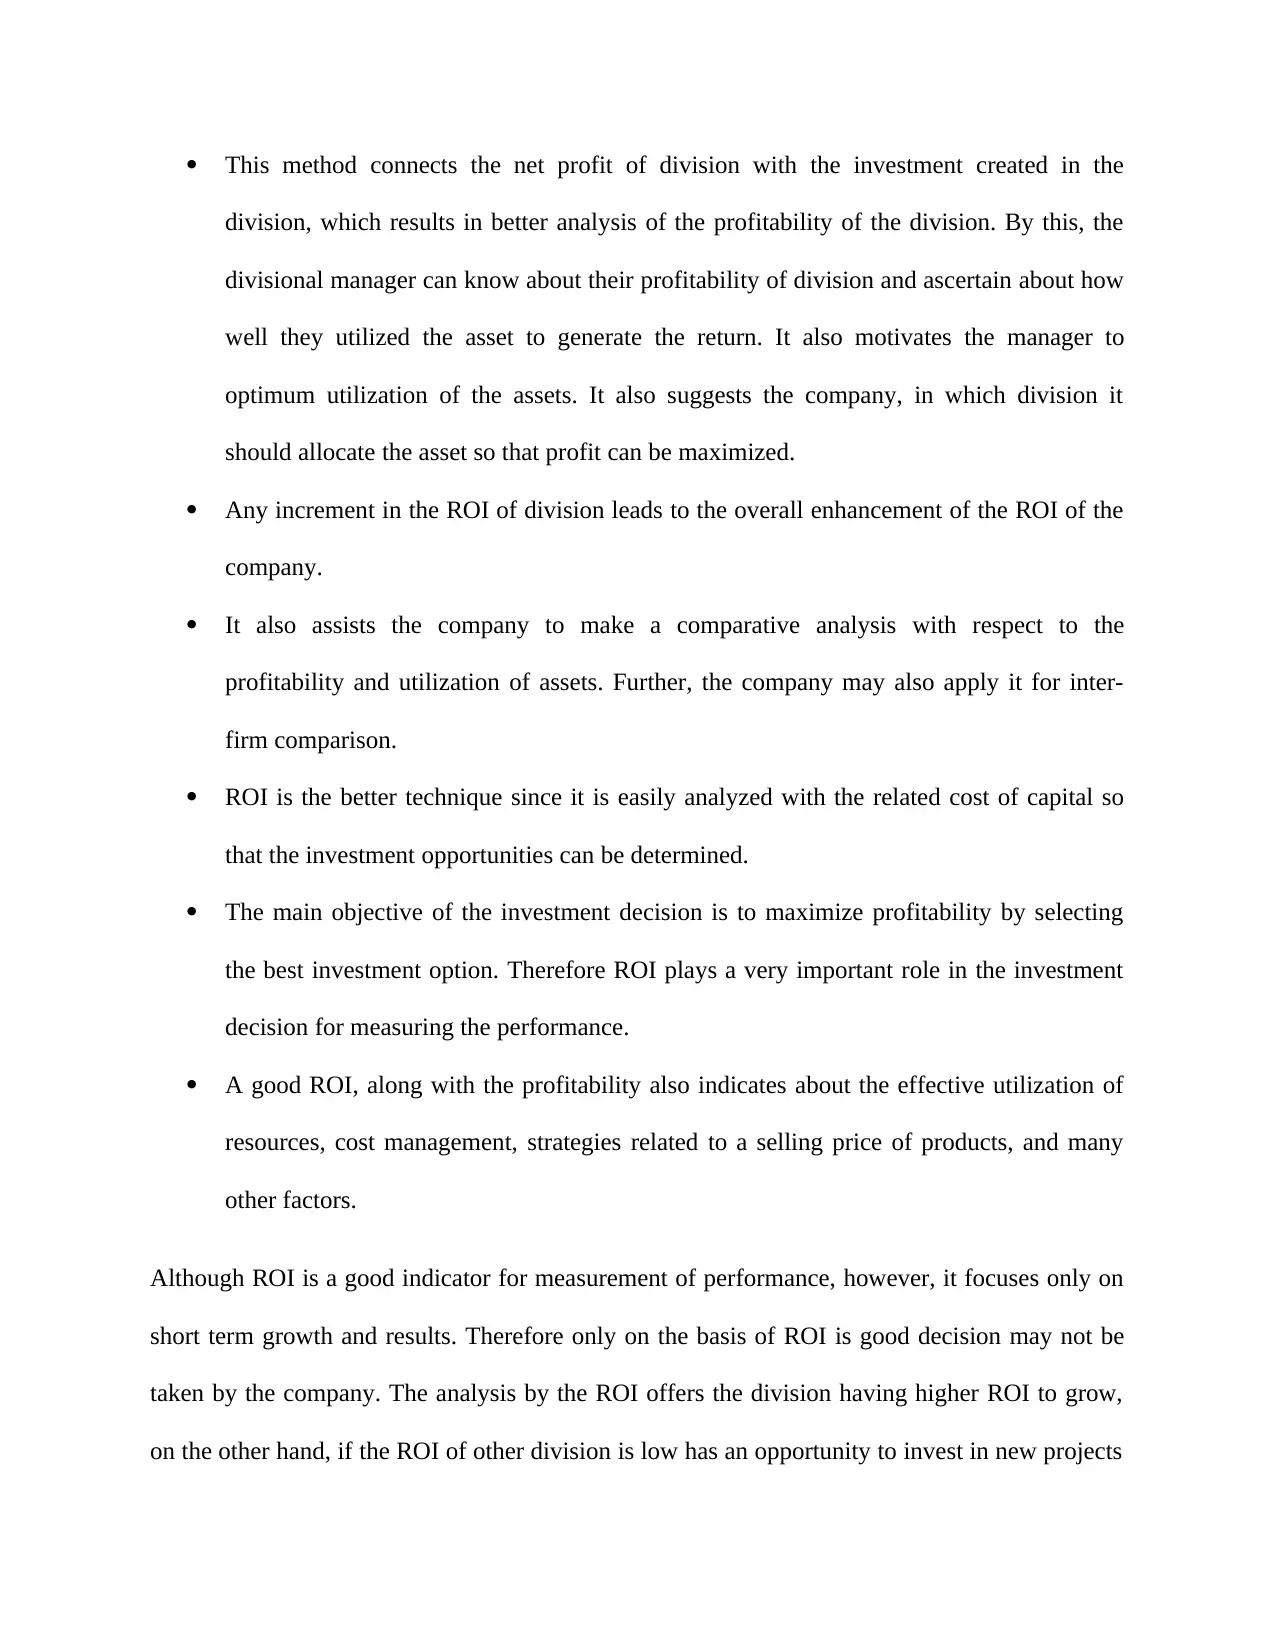
This method connects the net profit of division with the investment created in the
division, which results in better analysis of the profitability of the division. By this, the
divisional manager can know about their profitability of division and ascertain about how
well they utilized the asset to generate the return. It also motivates the manager to
optimum utilization of the assets. It also suggests the company, in which division it
should allocate the asset so that profit can be maximized.
Any increment in the ROI of division leads to the overall enhancement of the ROI of the
company.
It also assists the company to make a comparative analysis with respect to the
profitability and utilization of assets. Further, the company may also apply it for inter-
firm comparison.
ROI is the better technique since it is easily analyzed with the related cost of capital so
that the investment opportunities can be determined.
The main objective of the investment decision is to maximize profitability by selecting
the best investment option. Therefore ROI plays a very important role in the investment
decision for measuring the performance.
A good ROI, along with the profitability also indicates about the effective utilization of
resources, cost management, strategies related to a selling price of products, and many
other factors.
Although ROI is a good indicator for measurement of performance, however, it focuses only on
short term growth and results. Therefore only on the basis of ROI is good decision may not be
taken by the company. The analysis by the ROI offers the division having higher ROI to grow,
on the other hand, if the ROI of other division is low has an opportunity to invest in new projects
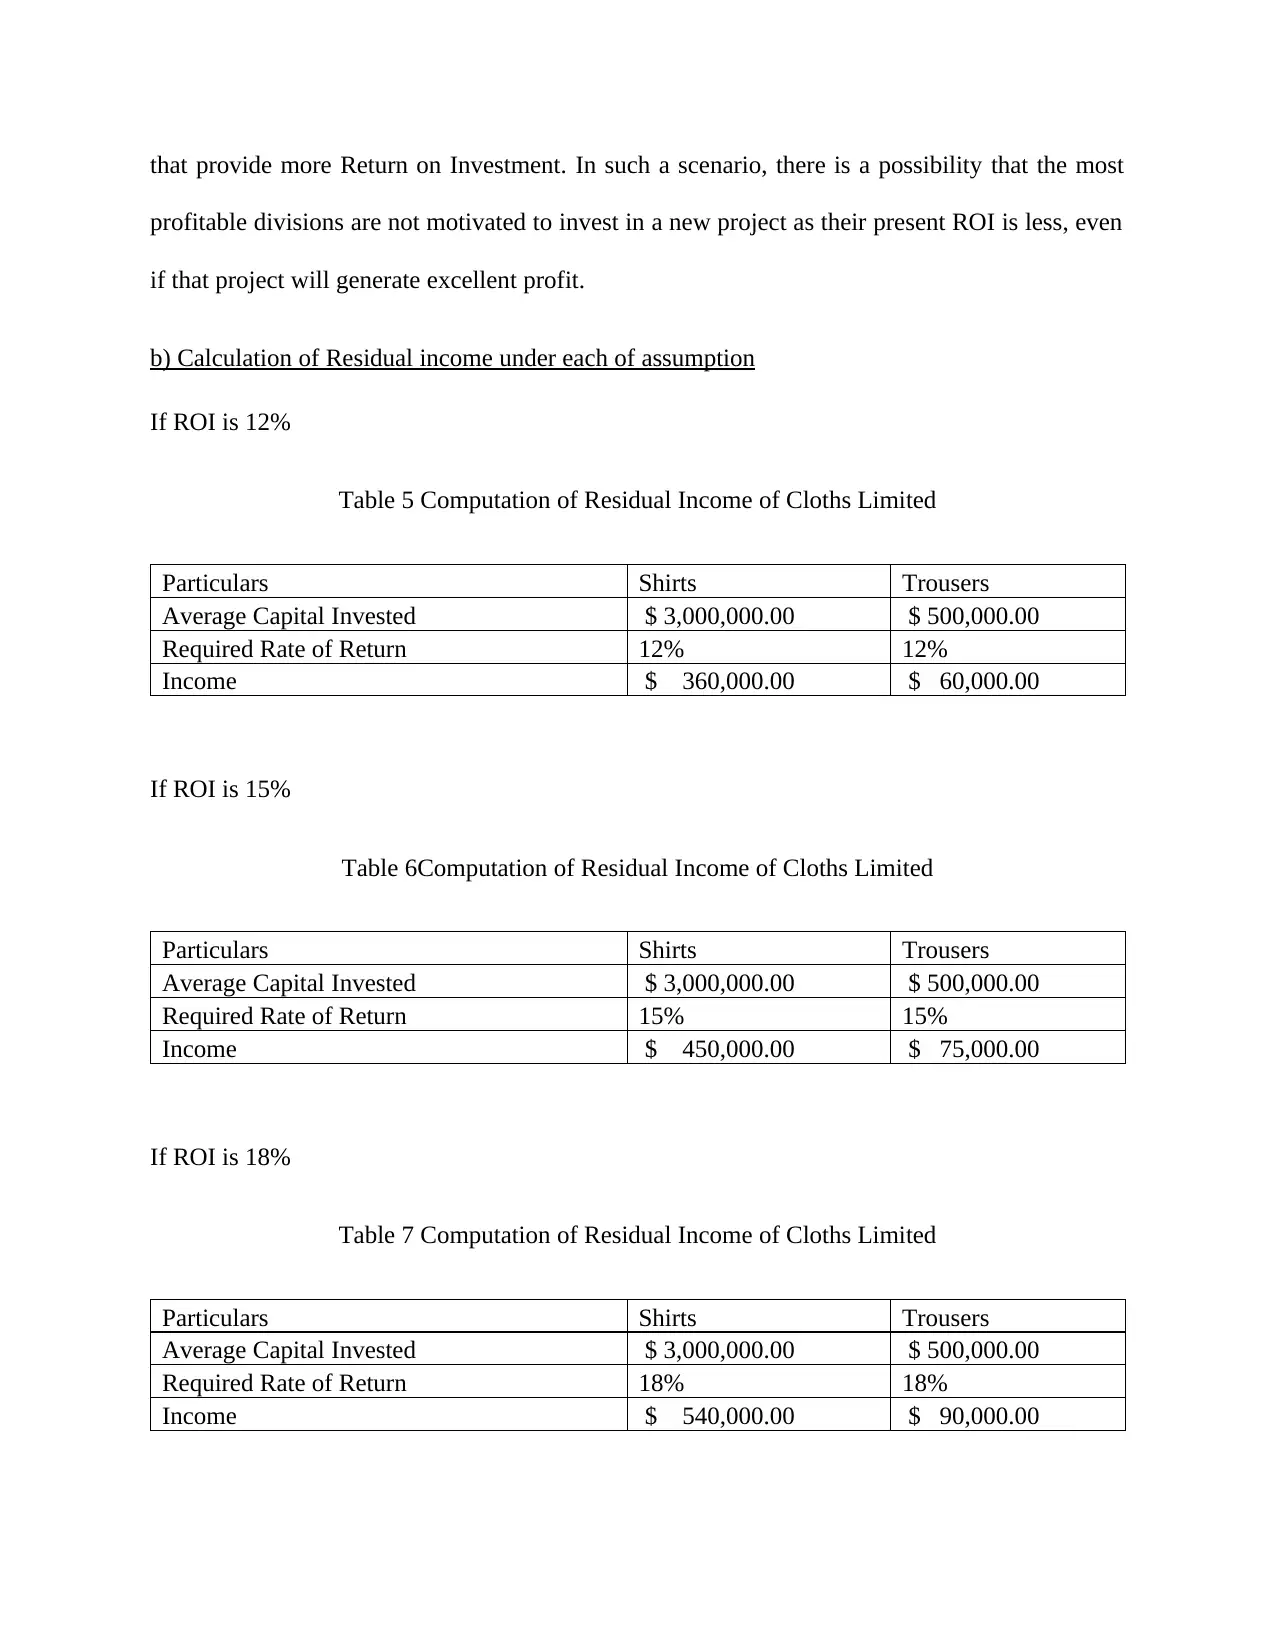
that provide more Return on Investment. In such a scenario, there is a possibility that the most
profitable divisions are not motivated to invest in a new project as their present ROI is less, even
if that project will generate excellent profit.
b) Calculation of Residual income under each of assumption
If ROI is 12%
Table 5 Computation of Residual Income of Cloths Limited
Particulars Shirts Trousers
Average Capital Invested $ 3,000,000.00 $ 500,000.00
Required Rate of Return 12% 12%
Income $ 360,000.00 $ 60,000.00
If ROI is 15%
Table 6Computation of Residual Income of Cloths Limited
Particulars Shirts Trousers
Average Capital Invested $ 3,000,000.00 $ 500,000.00
Required Rate of Return 15% 15%
Income $ 450,000.00 $ 75,000.00
If ROI is 18%
Table 7 Computation of Residual Income of Cloths Limited
Particulars Shirts Trousers
Average Capital Invested $ 3,000,000.00 $ 500,000.00
Required Rate of Return 18% 18%
Income $ 540,000.00 $ 90,000.00
⊘ This is a preview!⊘
Do you want full access?
Subscribe today to unlock all pages.
Trusted by 1+ million students worldwide
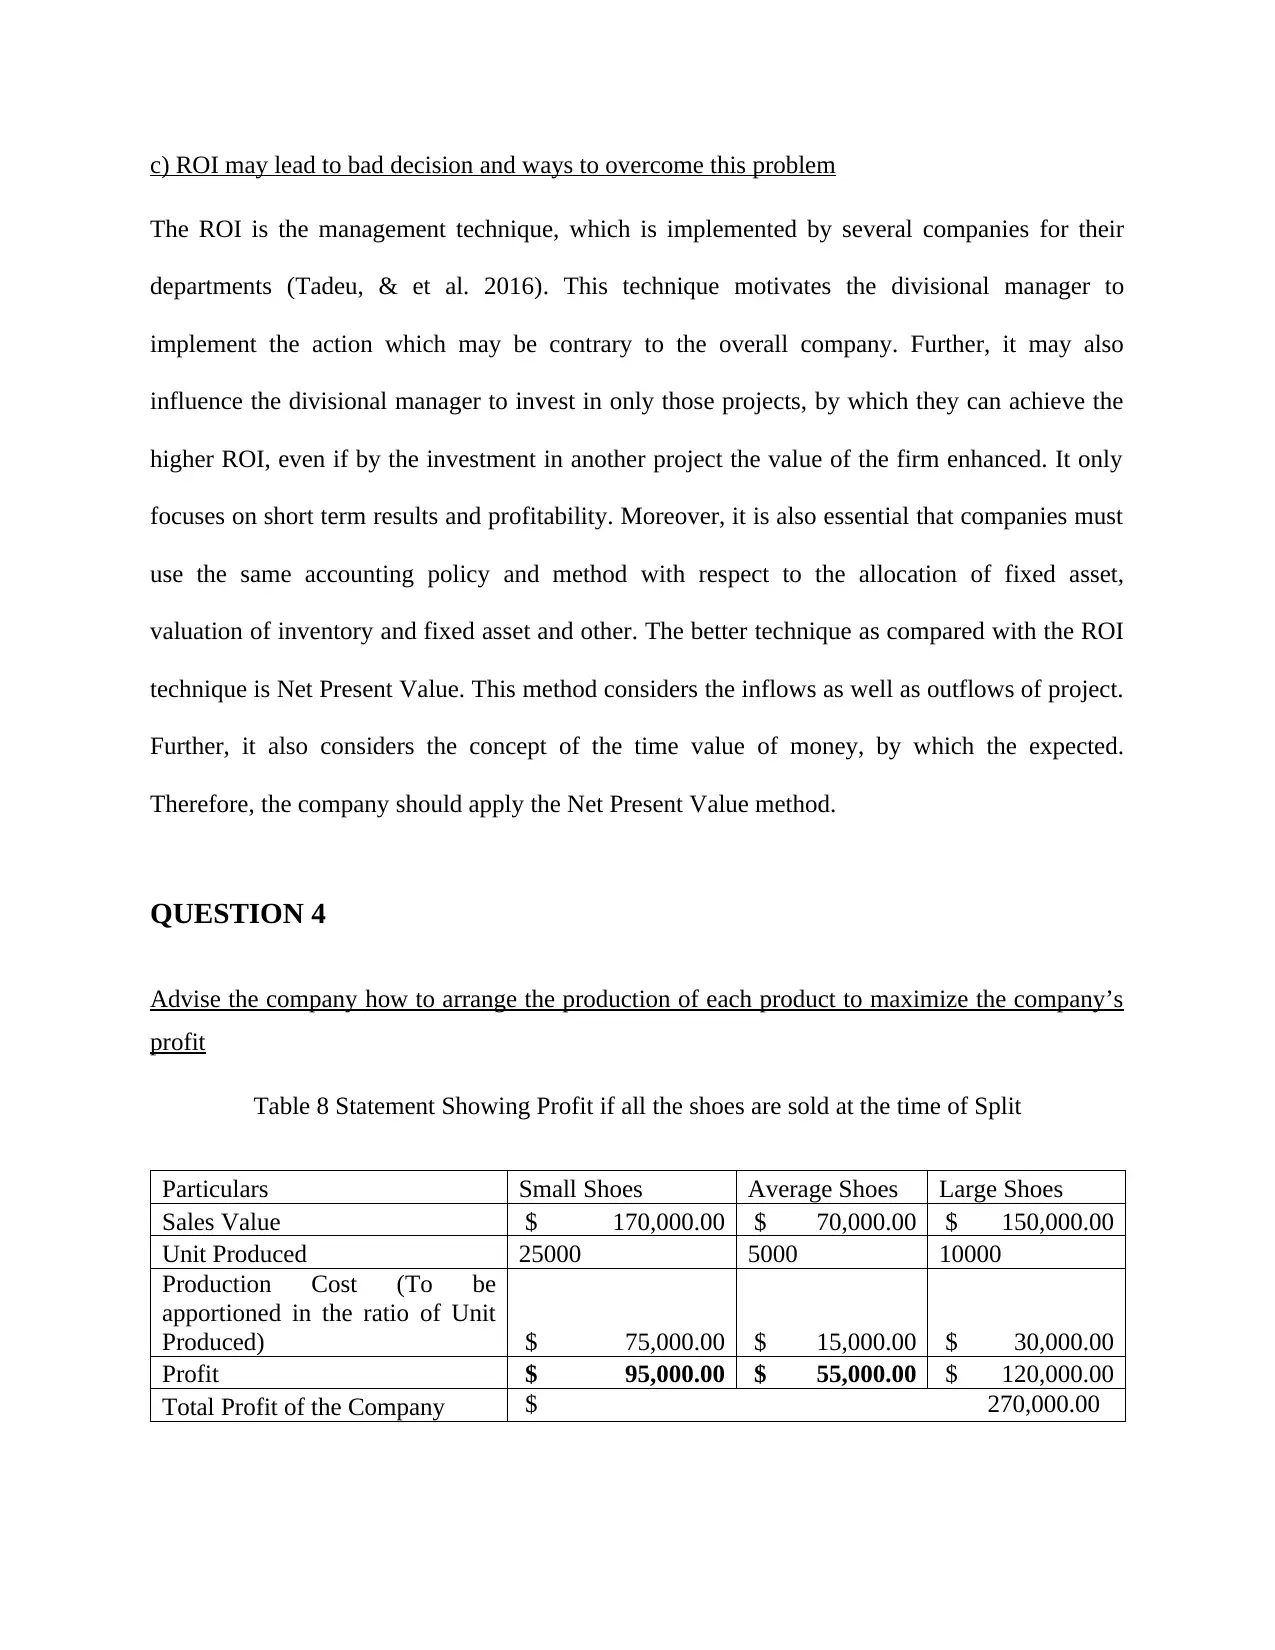
c) ROI may lead to bad decision and ways to overcome this problem
The ROI is the management technique, which is implemented by several companies for their
departments (Tadeu, & et al. 2016). This technique motivates the divisional manager to
implement the action which may be contrary to the overall company. Further, it may also
influence the divisional manager to invest in only those projects, by which they can achieve the
higher ROI, even if by the investment in another project the value of the firm enhanced. It only
focuses on short term results and profitability. Moreover, it is also essential that companies must
use the same accounting policy and method with respect to the allocation of fixed asset,
valuation of inventory and fixed asset and other. The better technique as compared with the ROI
technique is Net Present Value. This method considers the inflows as well as outflows of project.
Further, it also considers the concept of the time value of money, by which the expected.
Therefore, the company should apply the Net Present Value method.
QUESTION 4
Advise the company how to arrange the production of each product to maximize the company’s
profit
Table 8 Statement Showing Profit if all the shoes are sold at the time of Split
Particulars Small Shoes Average Shoes Large Shoes
Sales Value $ 170,000.00 $ 70,000.00 $ 150,000.00
Unit Produced 25000 5000 10000
Production Cost (To be
apportioned in the ratio of Unit
Produced) $ 75,000.00 $ 15,000.00 $ 30,000.00
Profit $ 95,000.00 $ 55,000.00 $ 120,000.00
Total Profit of the Company $ 270,000.00
Paraphrase This Document
Need a fresh take? Get an instant paraphrase of this document with our AI Paraphraser
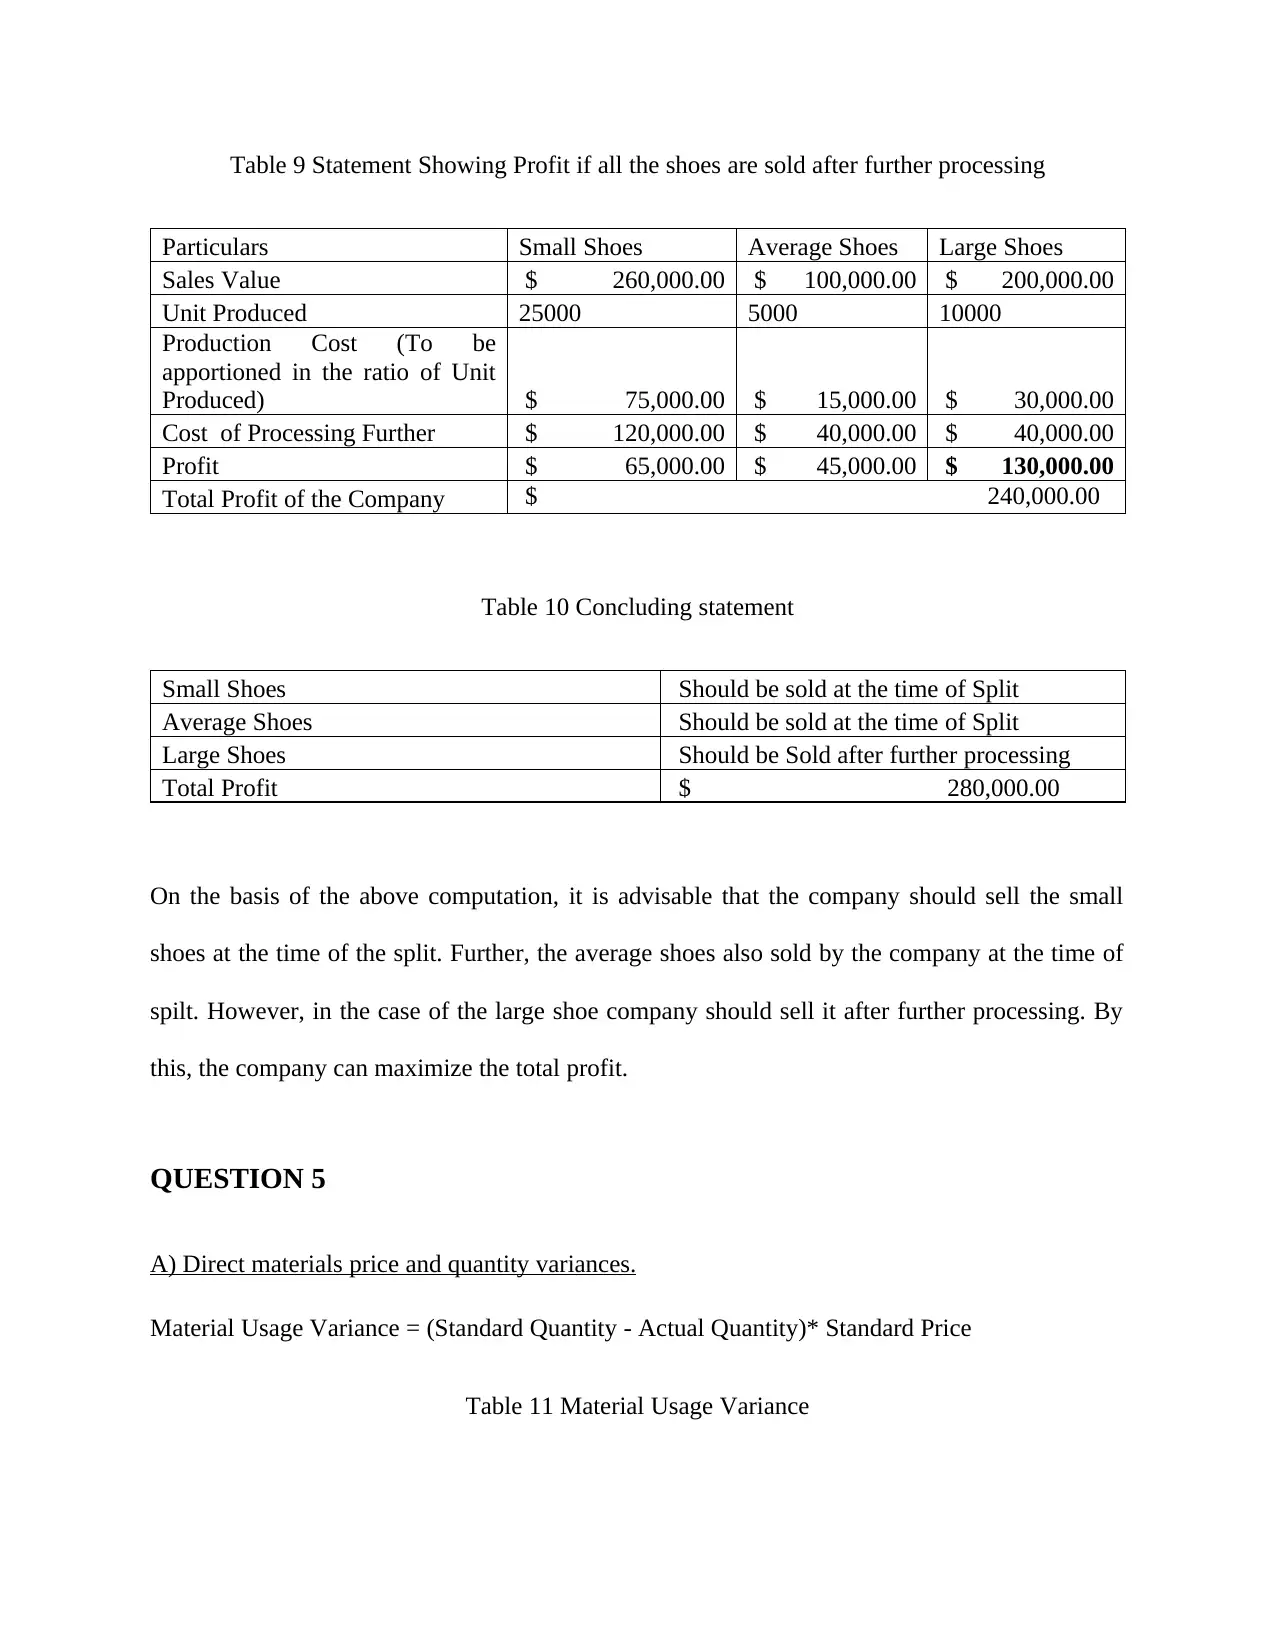
Table 9 Statement Showing Profit if all the shoes are sold after further processing
Particulars Small Shoes Average Shoes Large Shoes
Sales Value $ 260,000.00 $ 100,000.00 $ 200,000.00
Unit Produced 25000 5000 10000
Production Cost (To be
apportioned in the ratio of Unit
Produced) $ 75,000.00 $ 15,000.00 $ 30,000.00
Cost of Processing Further $ 120,000.00 $ 40,000.00 $ 40,000.00
Profit $ 65,000.00 $ 45,000.00 $ 130,000.00
Total Profit of the Company $ 240,000.00
Table 10 Concluding statement
Small Shoes Should be sold at the time of Split
Average Shoes Should be sold at the time of Split
Large Shoes Should be Sold after further processing
Total Profit $ 280,000.00
On the basis of the above computation, it is advisable that the company should sell the small
shoes at the time of the split. Further, the average shoes also sold by the company at the time of
spilt. However, in the case of the large shoe company should sell it after further processing. By
this, the company can maximize the total profit.
QUESTION 5
A) Direct materials price and quantity variances.
Material Usage Variance = (Standard Quantity - Actual Quantity)* Standard Price
Table 11 Material Usage Variance
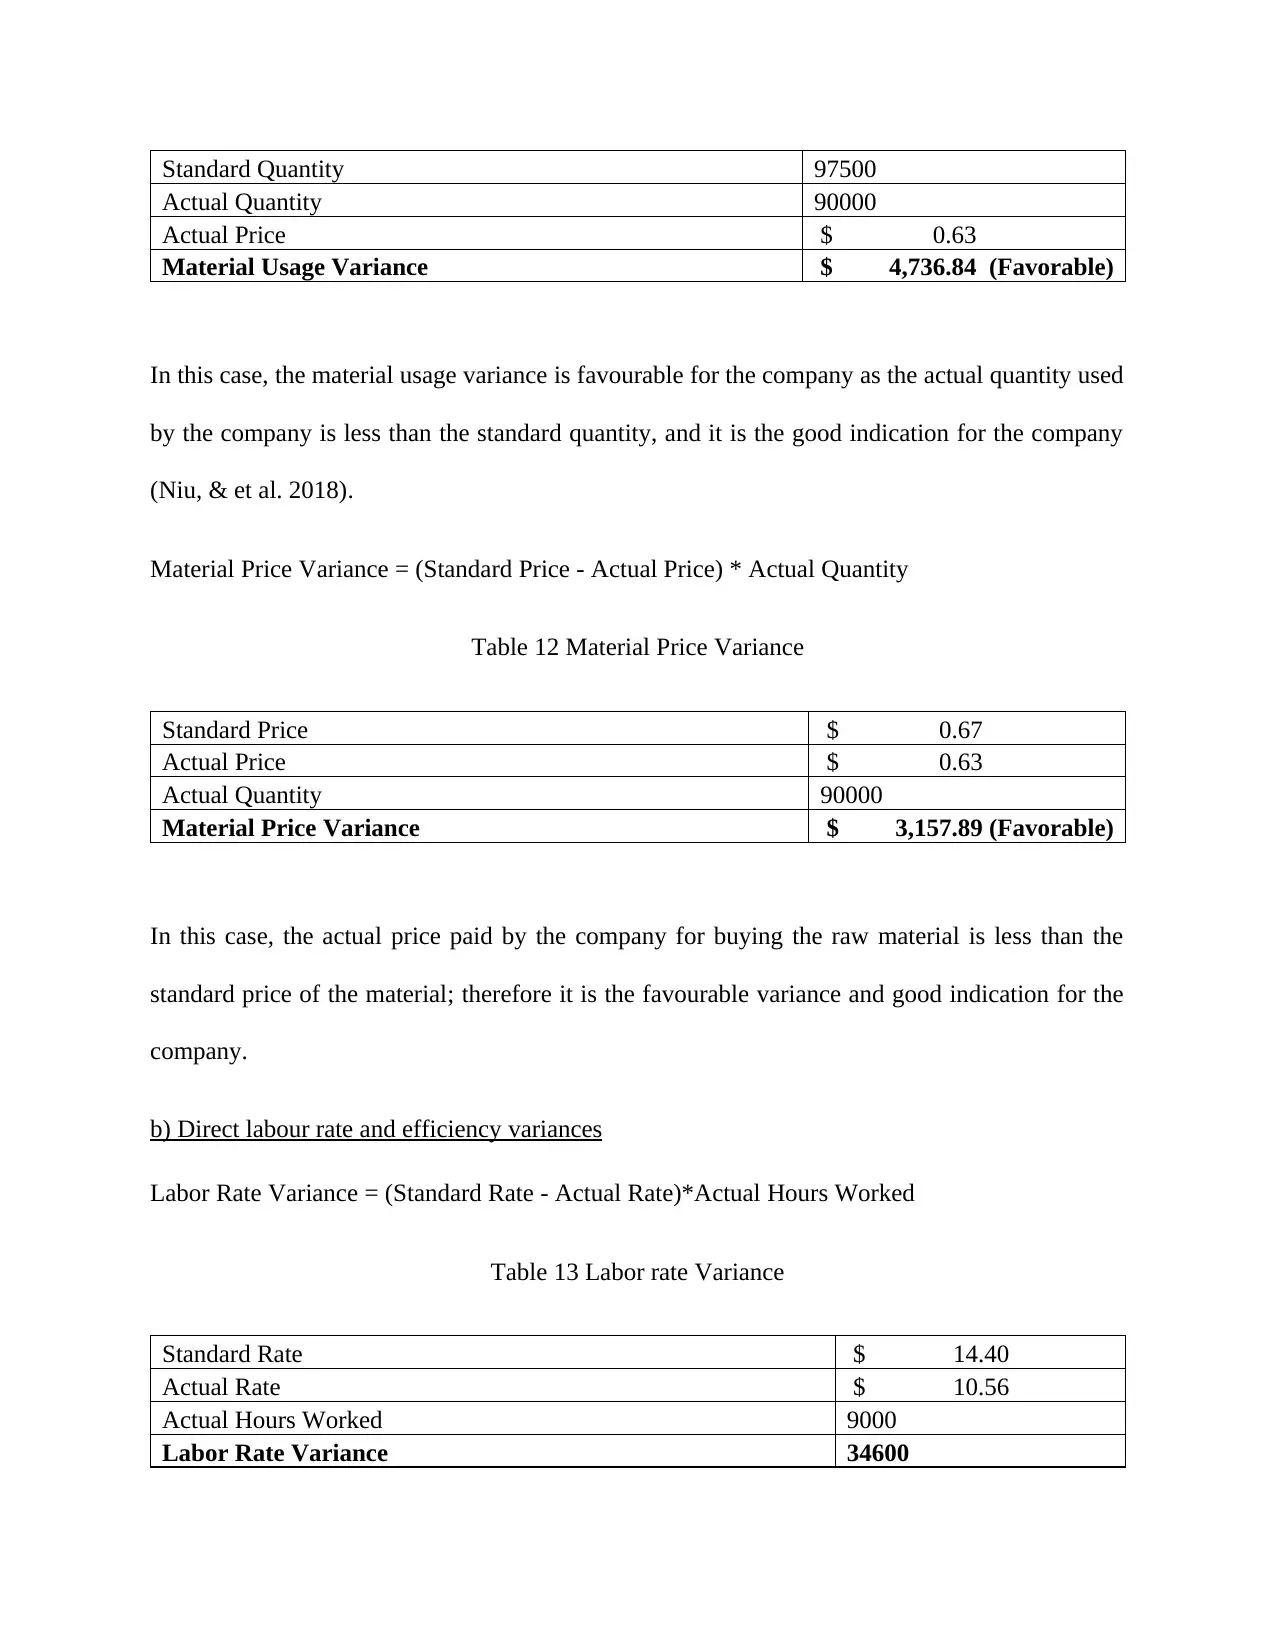
Standard Quantity 97500
Actual Quantity 90000
Actual Price $ 0.63
Material Usage Variance $ 4,736.84 (Favorable)
In this case, the material usage variance is favourable for the company as the actual quantity used
by the company is less than the standard quantity, and it is the good indication for the company
(Niu, & et al. 2018).
Material Price Variance = (Standard Price - Actual Price) * Actual Quantity
Table 12 Material Price Variance
Standard Price $ 0.67
Actual Price $ 0.63
Actual Quantity 90000
Material Price Variance $ 3,157.89 (Favorable)
In this case, the actual price paid by the company for buying the raw material is less than the
standard price of the material; therefore it is the favourable variance and good indication for the
company.
b) Direct labour rate and efficiency variances
Labor Rate Variance = (Standard Rate - Actual Rate)*Actual Hours Worked
Table 13 Labor rate Variance
Standard Rate $ 14.40
Actual Rate $ 10.56
Actual Hours Worked 9000
Labor Rate Variance 34600
Actual Quantity 90000
Actual Price $ 0.63
Material Usage Variance $ 4,736.84 (Favorable)
In this case, the material usage variance is favourable for the company as the actual quantity used
by the company is less than the standard quantity, and it is the good indication for the company
(Niu, & et al. 2018).
Material Price Variance = (Standard Price - Actual Price) * Actual Quantity
Table 12 Material Price Variance
Standard Price $ 0.67
Actual Price $ 0.63
Actual Quantity 90000
Material Price Variance $ 3,157.89 (Favorable)
In this case, the actual price paid by the company for buying the raw material is less than the
standard price of the material; therefore it is the favourable variance and good indication for the
company.
b) Direct labour rate and efficiency variances
Labor Rate Variance = (Standard Rate - Actual Rate)*Actual Hours Worked
Table 13 Labor rate Variance
Standard Rate $ 14.40
Actual Rate $ 10.56
Actual Hours Worked 9000
Labor Rate Variance 34600
⊘ This is a preview!⊘
Do you want full access?
Subscribe today to unlock all pages.
Trusted by 1+ million students worldwide
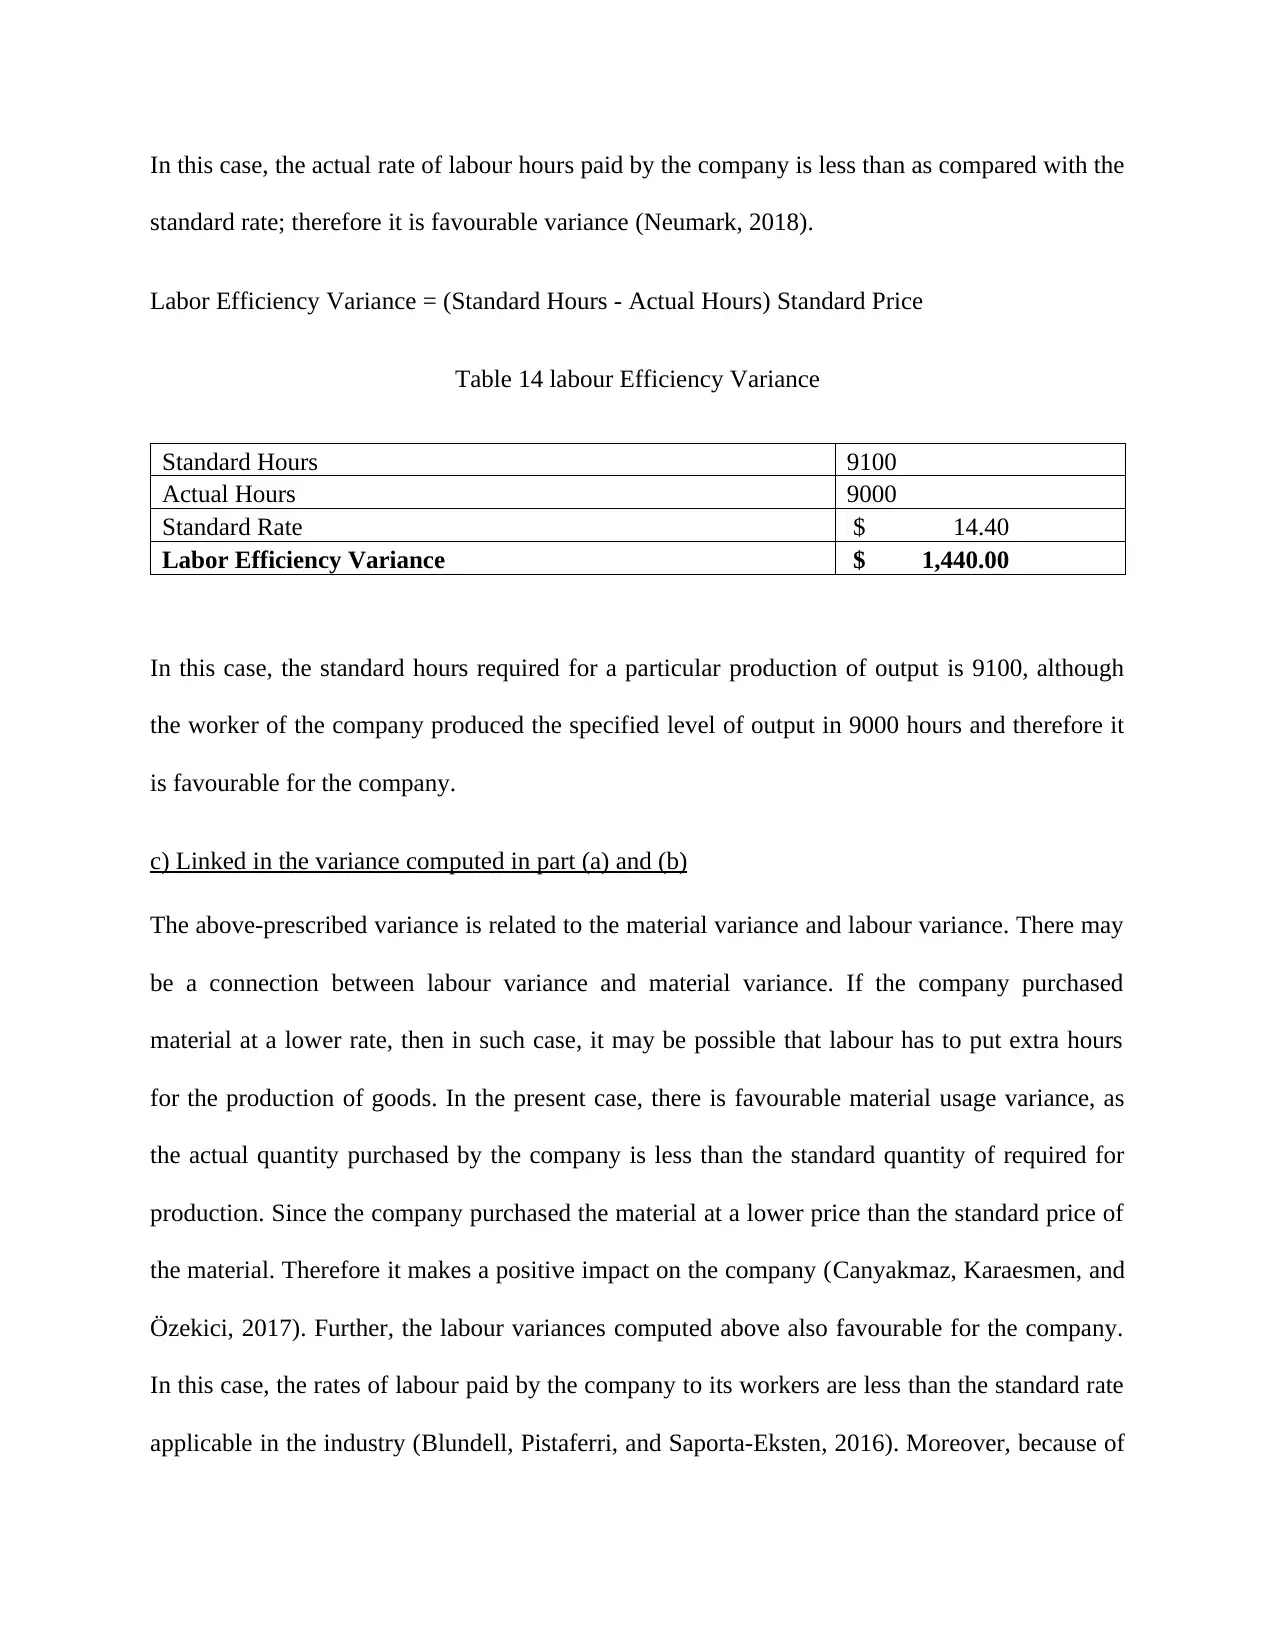
In this case, the actual rate of labour hours paid by the company is less than as compared with the
standard rate; therefore it is favourable variance (Neumark, 2018).
Labor Efficiency Variance = (Standard Hours - Actual Hours) Standard Price
Table 14 labour Efficiency Variance
Standard Hours 9100
Actual Hours 9000
Standard Rate $ 14.40
Labor Efficiency Variance $ 1,440.00
In this case, the standard hours required for a particular production of output is 9100, although
the worker of the company produced the specified level of output in 9000 hours and therefore it
is favourable for the company.
c) Linked in the variance computed in part (a) and (b)
The above-prescribed variance is related to the material variance and labour variance. There may
be a connection between labour variance and material variance. If the company purchased
material at a lower rate, then in such case, it may be possible that labour has to put extra hours
for the production of goods. In the present case, there is favourable material usage variance, as
the actual quantity purchased by the company is less than the standard quantity of required for
production. Since the company purchased the material at a lower price than the standard price of
the material. Therefore it makes a positive impact on the company (Canyakmaz, Karaesmen, and
Özekici, 2017). Further, the labour variances computed above also favourable for the company.
In this case, the rates of labour paid by the company to its workers are less than the standard rate
applicable in the industry (Blundell, Pistaferri, and Saporta-Eksten, 2016). Moreover, because of
Paraphrase This Document
Need a fresh take? Get an instant paraphrase of this document with our AI Paraphraser
the good efficiency and effectiveness of worker, the actual hours applied for the production is
less than the standard hours; therefore the efficiency variance is favourable for the company
(Chang, Hong, and Karabarbounis, 2018). Overall, the material variance and labour variance
both are favourable for the company.
less than the standard hours; therefore the efficiency variance is favourable for the company
(Chang, Hong, and Karabarbounis, 2018). Overall, the material variance and labour variance
both are favourable for the company.
REFERENCES
Blundell, R., Pistaferri, L. and Saporta-Eksten, I., 2016. Consumption inequality and family
labor supply. American Economic Review, 106(2), pp.387-435.
Canyakmaz, C., Karaesmen, F. and Özekici, S., 2017. Minimum-Variance Hedging for
Managing Risks in Inventory Models with Price Fluctuations. Foundations and Trends® in
Technology, Information and Operations Management, 11(1-2), pp.107-123.
Chang, Y., Hong, J.H. and Karabarbounis, M., 2018. Labor market uncertainty and portfolio
choice puzzles. American Economic Journal: Macroeconomics, 10(2), pp.222-62.
Cordes, J.J., 2017. Using cost-benefit analysis and social return on investment to evaluate the
impact of social enterprise: Promises, implementation, and limitations. Evaluation and program
planning, 64(1), pp.98-104.
Marchioni, A. and Magni, C.A., 2018. Investment decisions and sensitivity analysis: NPV-
consistency of rates of return. European Journal of Operational Research, 268(1), pp.361-372.
Neumark, D., 2018. Experimental research on labour market discrimination. Journal of
Economic Literature, 56(3), pp.799-866.
Niu, B., Chu, L.K., Ni, J. and Wang, J., 2018. Buy now and price later: Supply contracts with
time-consistent mean-variance financial hedgingAuthor-Name: Li, Qiang. European Journal of
Operational Research, 268(2), pp.582-595.
⊘ This is a preview!⊘
Do you want full access?
Subscribe today to unlock all pages.
Trusted by 1+ million students worldwide
1 out of 13
Related Documents


Your All-in-One AI-Powered Toolkit for Academic Success.
+13062052269
info@desklib.com
Available 24*7 on WhatsApp / Email
![[object Object]](/_next/static/media/star-bottom.7253800d.svg)
Unlock your academic potential
Copyright © 2020–2026 A2Z Services. All Rights Reserved. Developed and managed by ZUCOL.