MRKT13014 - New Product Development & Branding: MacBook Pro
VerifiedAdded on 2023/03/31
|13
|2414
|388
Report
AI Summary
This report provides a comprehensive analysis of Apple's MacBook Pro, focusing on its new product development and branding strategies for a global market entry. It uses Porter's competitive theory, Importance-Performance Analysis (IPA) framework, BCG matrix, and Product Lifecycle Curve (PLC) to evaluate the product's competitive position and recommend promotional strategies. The analysis considers factors like product differentiation, brand value, customer satisfaction, and market growth to determine the optimal approach for Apple to enhance its market share and profitability, while addressing areas needing improvement such as design and battery life.
Running head: NEW PRODUCT DEVELOPMENT AND BRANDING
New Product Development and Branding: MacBook Pro
Name of the Student:
Name of the University:
Author note:
New Product Development and Branding: MacBook Pro
Name of the Student:
Name of the University:
Author note:
Paraphrase This Document
Need a fresh take? Get an instant paraphrase of this document with our AI Paraphraser
1NEW PRODUCT DEVELOPMENT AND BRANDING
1. Introduction
The MacBook Pro is a high end personal and portable computer line of the Macintosh
computer family. It was introduced in January 2006, and at present, it is available in 13 and 15
inch screen size. The latest MacBook Pro has been introduced with fourth generation technology
with Touch Bar and USB-C in 2016 (apple.com, 2019). The third generation contained Retina
Display and to make a difference with third generation, Apple introduced Touch Bar and USB-C
in the fourth generation. The product has Apple’s own operating system, that is, Mac OS. The
fourth generation has battery life of up to 10 hours with built-in 54.5-watt-hour lithium-polymer
battery for 13inch and 58.0-watt-hour for 15 inch, 61W USB-C Power Adapter and up to 30 days
of standby time (apple.com, 2019). The market competitors of MacBook Pro are Dell XPS,
ThinkPad X1 Carbon, Razer Blade Stealth, Surface Laptop 2, and HP Spectre X360 (Smith,
2018). This report will highlight the promotional strategies that can be adopted by Apple to make
a global market entry with its high end portable computer MacBook Pro. The report will discuss
the competitive position of the product in the market through Porter's competitive theory, and its
importance-performance (IPA) framework, and its intended position through BCG portfolio
matrix and product lifecycle curve (PLC) and on the basis of the analysis, promotional strategies
for MacBook Pro will be recommended.
2. Analysis for determination of promotional plan
2.1 Porter's competitive strategy
Porter's competitive theory demonstrates the relative position of a brand in the industry.
This competitive theory is used to get an overview of the competitive position of a particular
product or service and recommend the correct strategy for market entry based on the relative
2NEW PRODUCT DEVELOPMENT AND BRANDING
market position. It also helps to determine the whether the profitability of the firm is above or
below the industry average (Wicker et al., 2015).
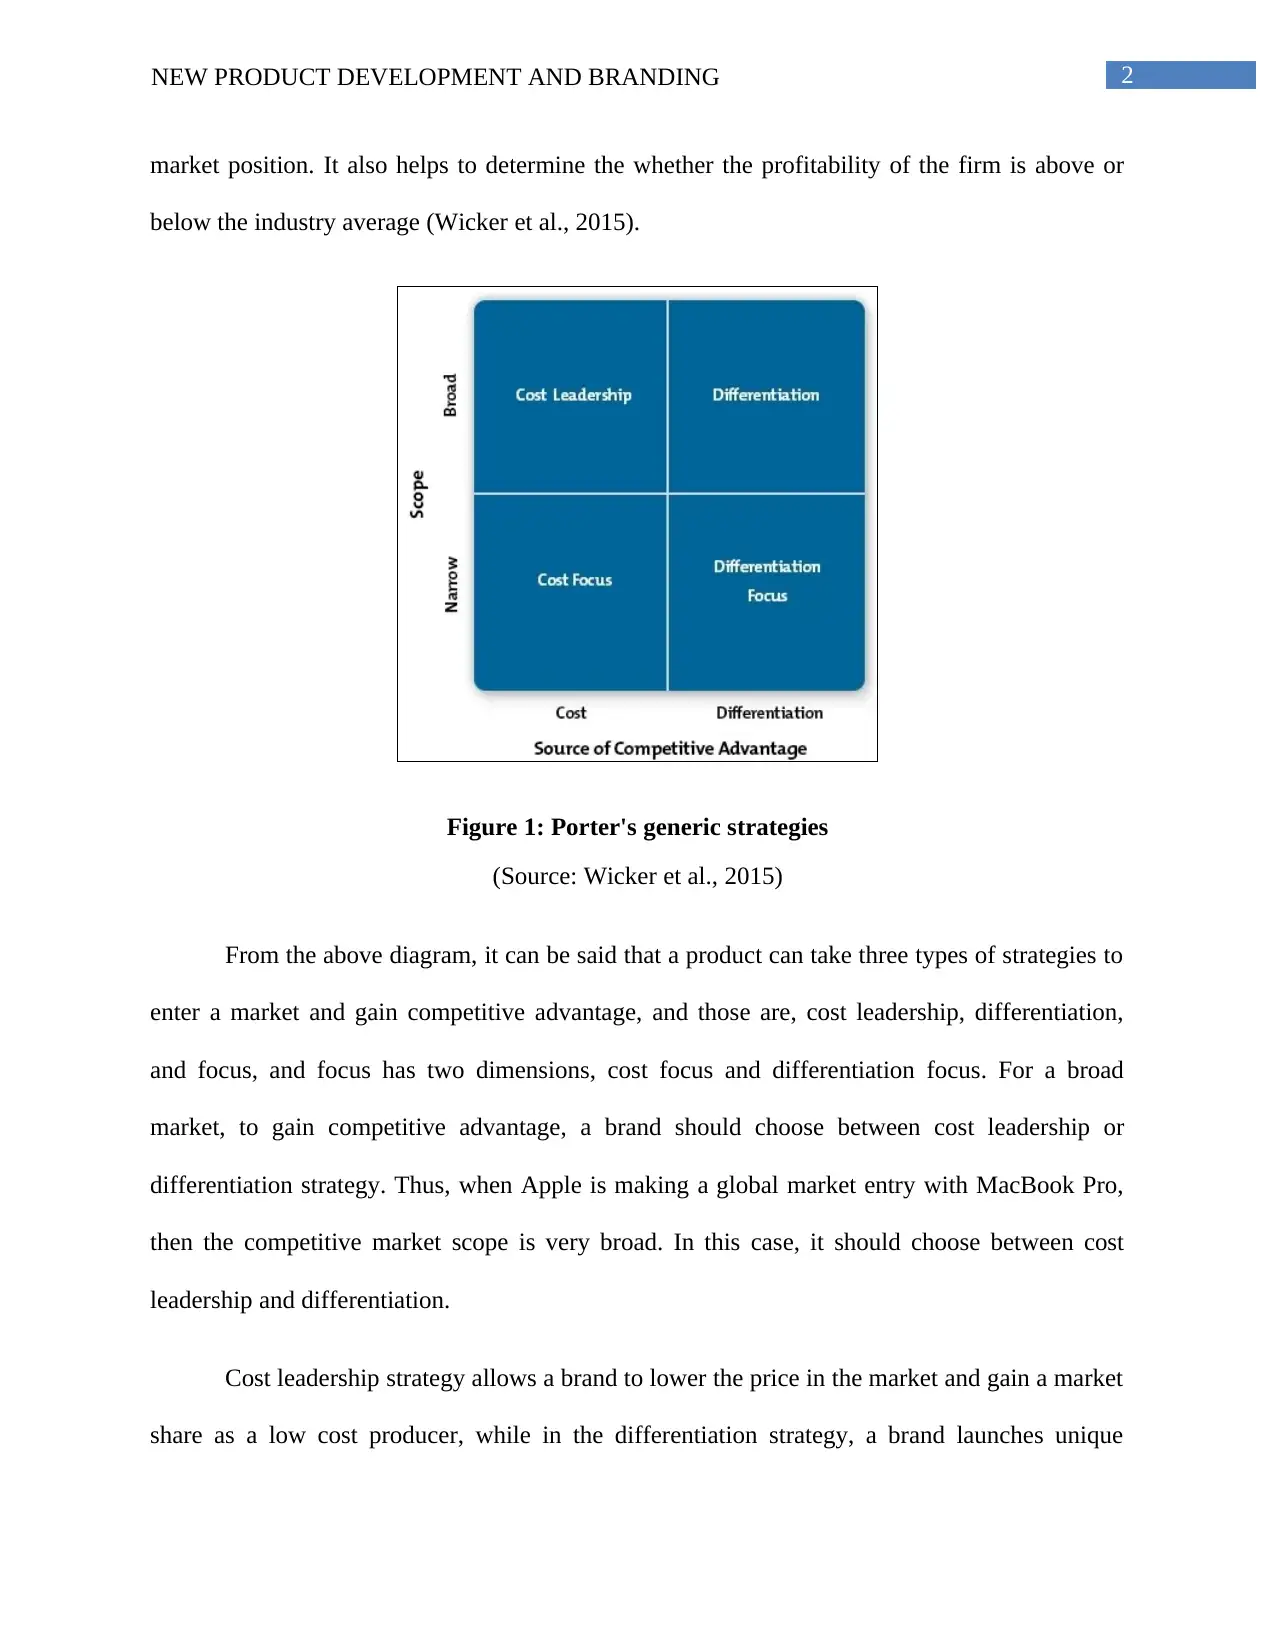
Figure 1: Porter's generic strategies
(Source: Wicker et al., 2015)
From the above diagram, it can be said that a product can take three types of strategies to
enter a market and gain competitive advantage, and those are, cost leadership, differentiation,
and focus, and focus has two dimensions, cost focus and differentiation focus. For a broad
market, to gain competitive advantage, a brand should choose between cost leadership or
differentiation strategy. Thus, when Apple is making a global market entry with MacBook Pro,
then the competitive market scope is very broad. In this case, it should choose between cost
leadership and differentiation.
Cost leadership strategy allows a brand to lower the price in the market and gain a market
share as a low cost producer, while in the differentiation strategy, a brand launches unique
market position. It also helps to determine the whether the profitability of the firm is above or
below the industry average (Wicker et al., 2015).
Figure 1: Porter's generic strategies
(Source: Wicker et al., 2015)
From the above diagram, it can be said that a product can take three types of strategies to
enter a market and gain competitive advantage, and those are, cost leadership, differentiation,
and focus, and focus has two dimensions, cost focus and differentiation focus. For a broad
market, to gain competitive advantage, a brand should choose between cost leadership or
differentiation strategy. Thus, when Apple is making a global market entry with MacBook Pro,
then the competitive market scope is very broad. In this case, it should choose between cost
leadership and differentiation.
Cost leadership strategy allows a brand to lower the price in the market and gain a market
share as a low cost producer, while in the differentiation strategy, a brand launches unique
⊘ This is a preview!⊘
Do you want full access?
Subscribe today to unlock all pages.
Trusted by 1+ million students worldwide
3NEW PRODUCT DEVELOPMENT AND BRANDING
product or service with features that are widely valued by the customers (Salavou, 2015). In this
strategy, the firms choose one or more product or service attributes, which is perceived as unique
and highly important for the buyers and for its uniqueness, a premium pricing strategy is usually
adopted by the firms. The given product, that is, MacBook Pro by Apple, should adopt the
differentiation strategy for global market entry. It is a high end laptop by Apple and the other
products by Apple are highly valued by the customers for high quality performance, long battery
life, bug free OS, camera performance etc. Hence, the brand value for Apple products is very
high in the market and thus, the firm has been using premium pricing strategy for all other
products. Thus, for MacBook Pro also, Apple has introduced unique features than its competitors
and therefore, differentiation and premium pricing on the basis of brand value and uniqueness
should be adopted by it for global market entry and achieving competitive advantage.
2.2 Importance-performance analysis (IPA) framework
Importance-performance analysis (IPA) framework is a technique which is widely used
for measuring the service quality of a product or service. This is based on the customer
satisfaction regarding the performance of the product or service and expectation from that. In
other words, IPA focuses on the gap between the customer expectation on the significance or
importance of the product or service and judgment about the performance of the same (Sethna,
2015). The IPA for MacBook Pro for its promotional strategy for a global market entry is
described below.
Paraphrase This Document
Need a fresh take? Get an instant paraphrase of this document with our AI Paraphraser
4NEW PRODUCT DEVELOPMENT AND BRANDING
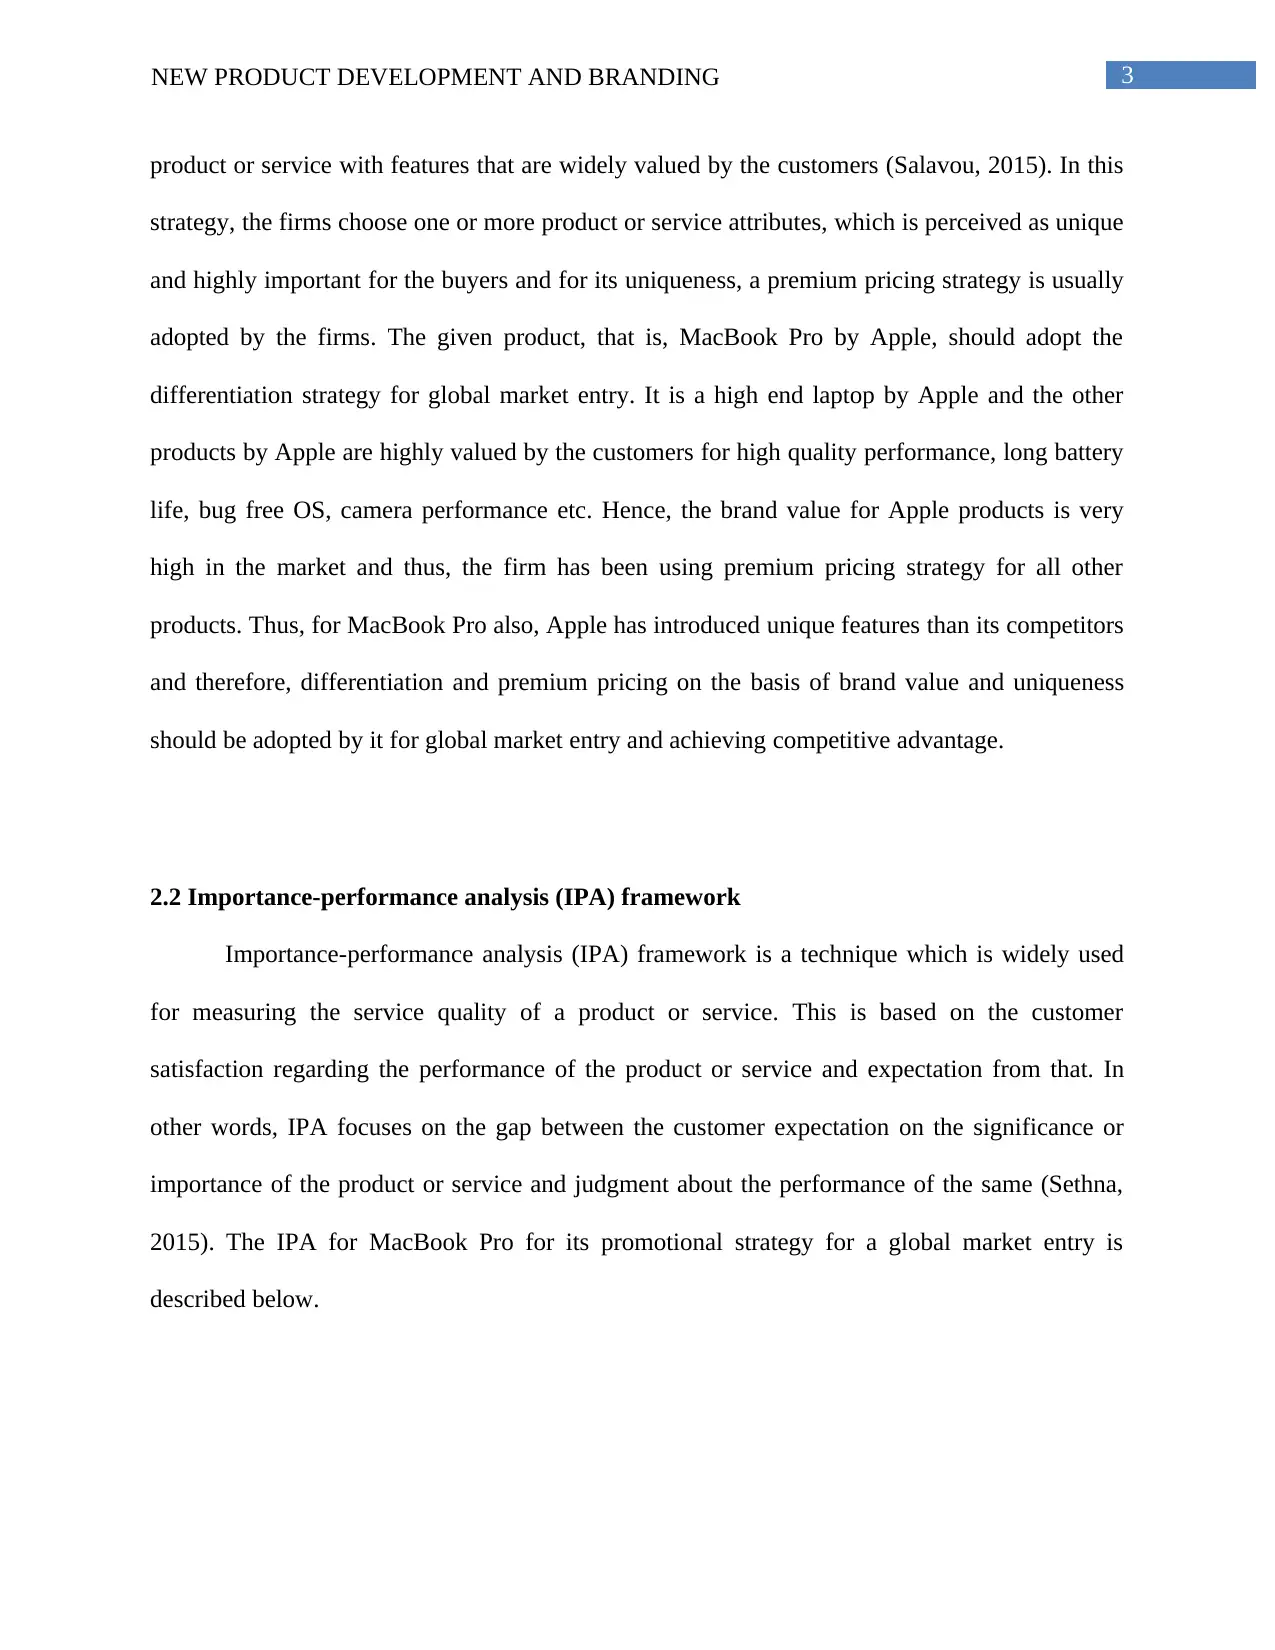
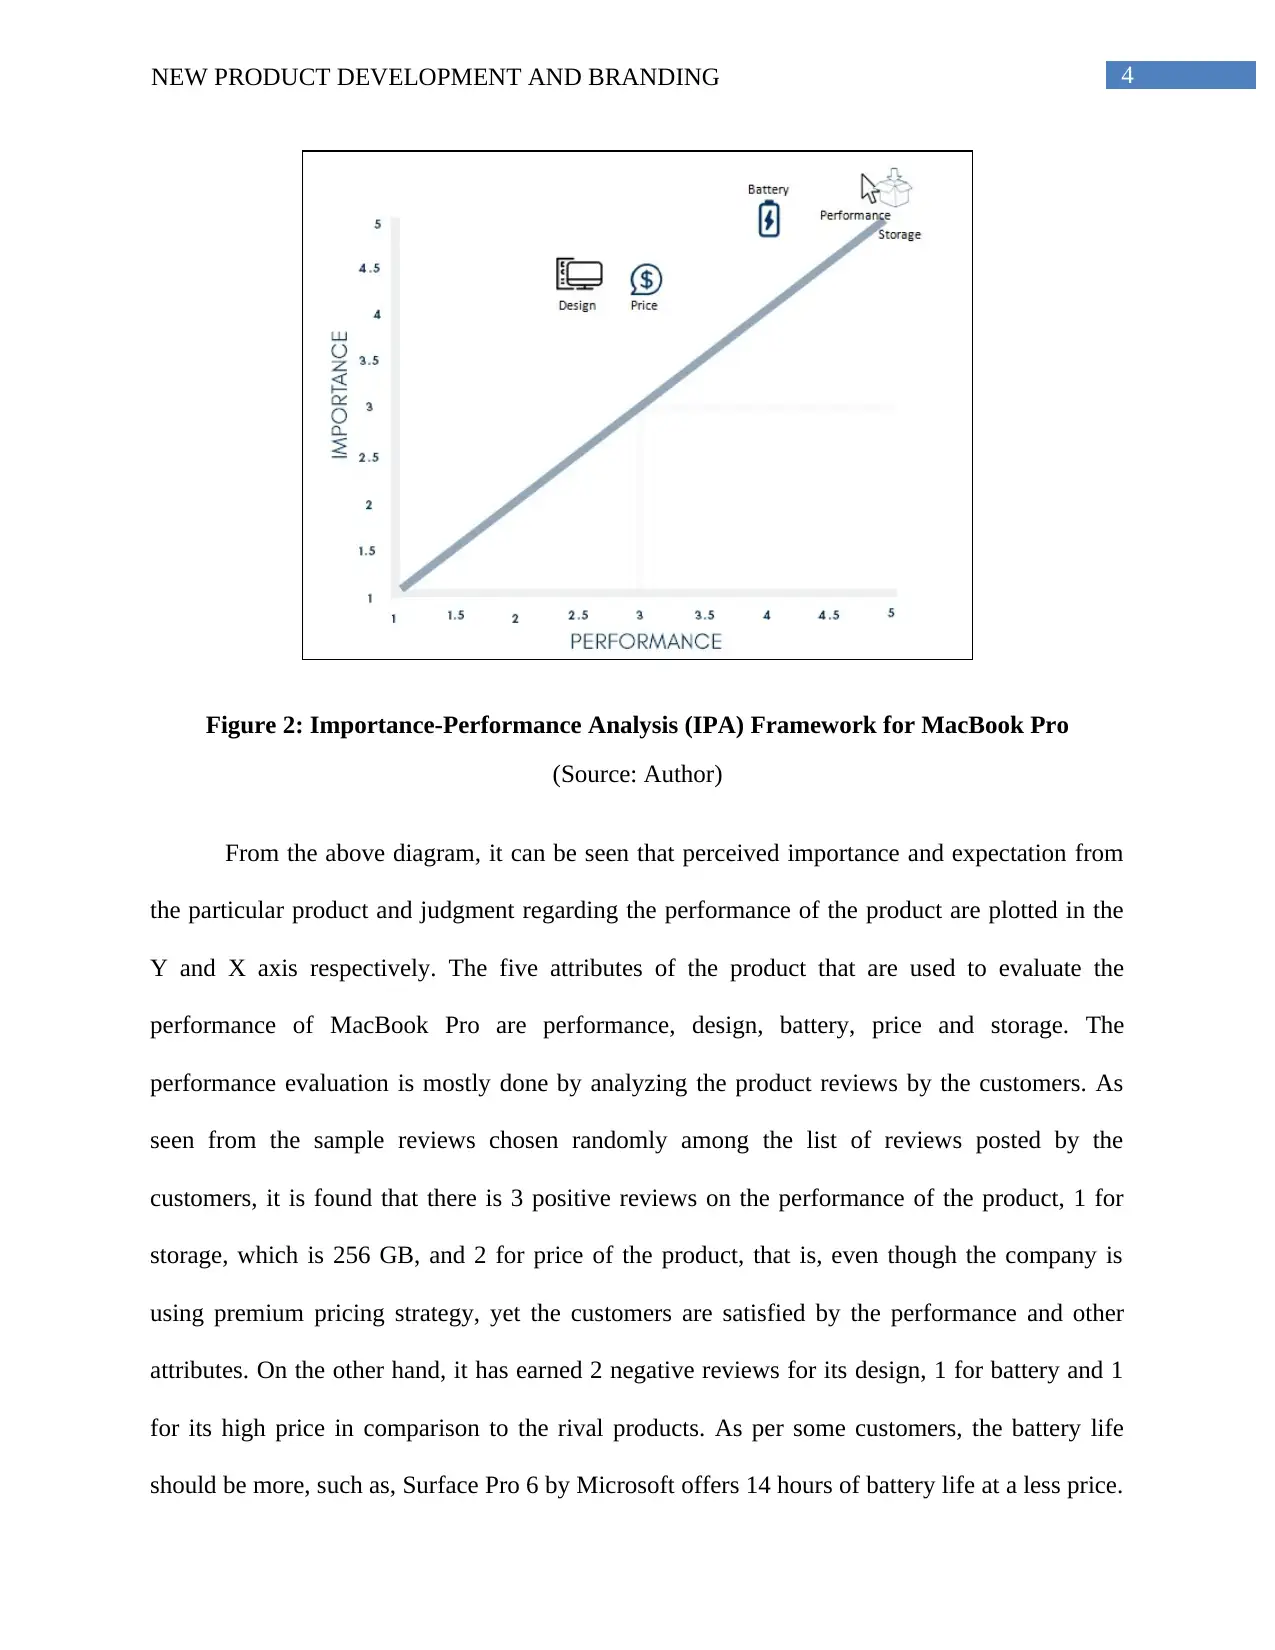
Figure 2: Importance-Performance Analysis (IPA) Framework for MacBook Pro
(Source: Author)
From the above diagram, it can be seen that perceived importance and expectation from
the particular product and judgment regarding the performance of the product are plotted in the
Y and X axis respectively. The five attributes of the product that are used to evaluate the
performance of MacBook Pro are performance, design, battery, price and storage. The
performance evaluation is mostly done by analyzing the product reviews by the customers. As
seen from the sample reviews chosen randomly among the list of reviews posted by the
customers, it is found that there is 3 positive reviews on the performance of the product, 1 for
storage, which is 256 GB, and 2 for price of the product, that is, even though the company is
using premium pricing strategy, yet the customers are satisfied by the performance and other
attributes. On the other hand, it has earned 2 negative reviews for its design, 1 for battery and 1
for its high price in comparison to the rival products. As per some customers, the battery life
should be more, such as, Surface Pro 6 by Microsoft offers 14 hours of battery life at a less price.
5NEW PRODUCT DEVELOPMENT AND BRANDING
According to another customer, at the price for MacBook Pro, there should be 1TB storage
capacity. As per few other customers, the design of the product is not at par with their
expectation. The cooling system is not good, the system has only Wi-Fi connectivity and no
scope for ports, and has highly sensitive keyboard, which is not preferred by many customers.
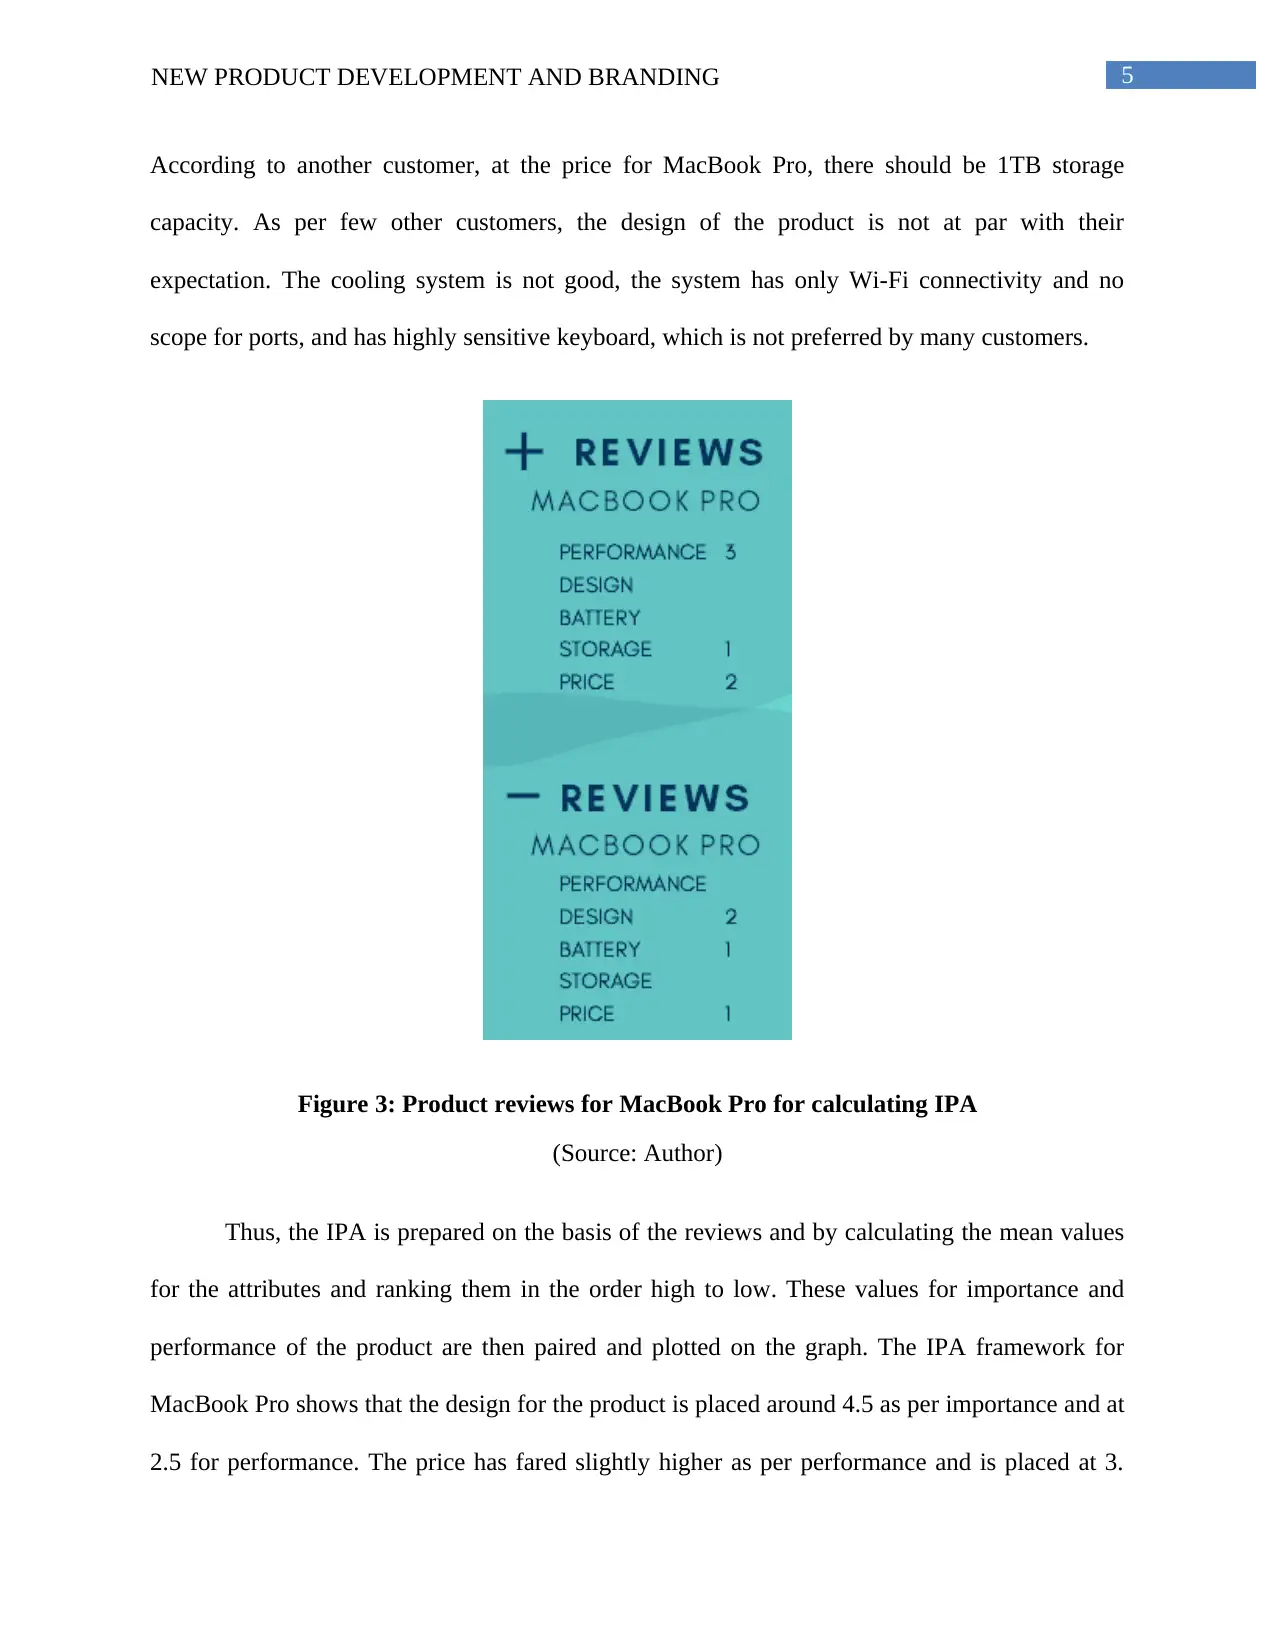
Figure 3: Product reviews for MacBook Pro for calculating IPA
(Source: Author)
Thus, the IPA is prepared on the basis of the reviews and by calculating the mean values
for the attributes and ranking them in the order high to low. These values for importance and
performance of the product are then paired and plotted on the graph. The IPA framework for
MacBook Pro shows that the design for the product is placed around 4.5 as per importance and at
2.5 for performance. The price has fared slightly higher as per performance and is placed at 3.
According to another customer, at the price for MacBook Pro, there should be 1TB storage
capacity. As per few other customers, the design of the product is not at par with their
expectation. The cooling system is not good, the system has only Wi-Fi connectivity and no
scope for ports, and has highly sensitive keyboard, which is not preferred by many customers.
Figure 3: Product reviews for MacBook Pro for calculating IPA
(Source: Author)
Thus, the IPA is prepared on the basis of the reviews and by calculating the mean values
for the attributes and ranking them in the order high to low. These values for importance and
performance of the product are then paired and plotted on the graph. The IPA framework for
MacBook Pro shows that the design for the product is placed around 4.5 as per importance and at
2.5 for performance. The price has fared slightly higher as per performance and is placed at 3.
⊘ This is a preview!⊘
Do you want full access?
Subscribe today to unlock all pages.
Trusted by 1+ million students worldwide
6NEW PRODUCT DEVELOPMENT AND BRANDING
The importance and performance for the battery, storage and performance is very high in the
graph. Thus, it can be said that while entering the global market, Apple should focus on
improving the performance of design and it should also work on the price as both of these factors
should be improved. But as the overall performance for the other attributes is quite high, it
should be able to capture a substantial share in the global market through product differentiation
and improved features and performances.
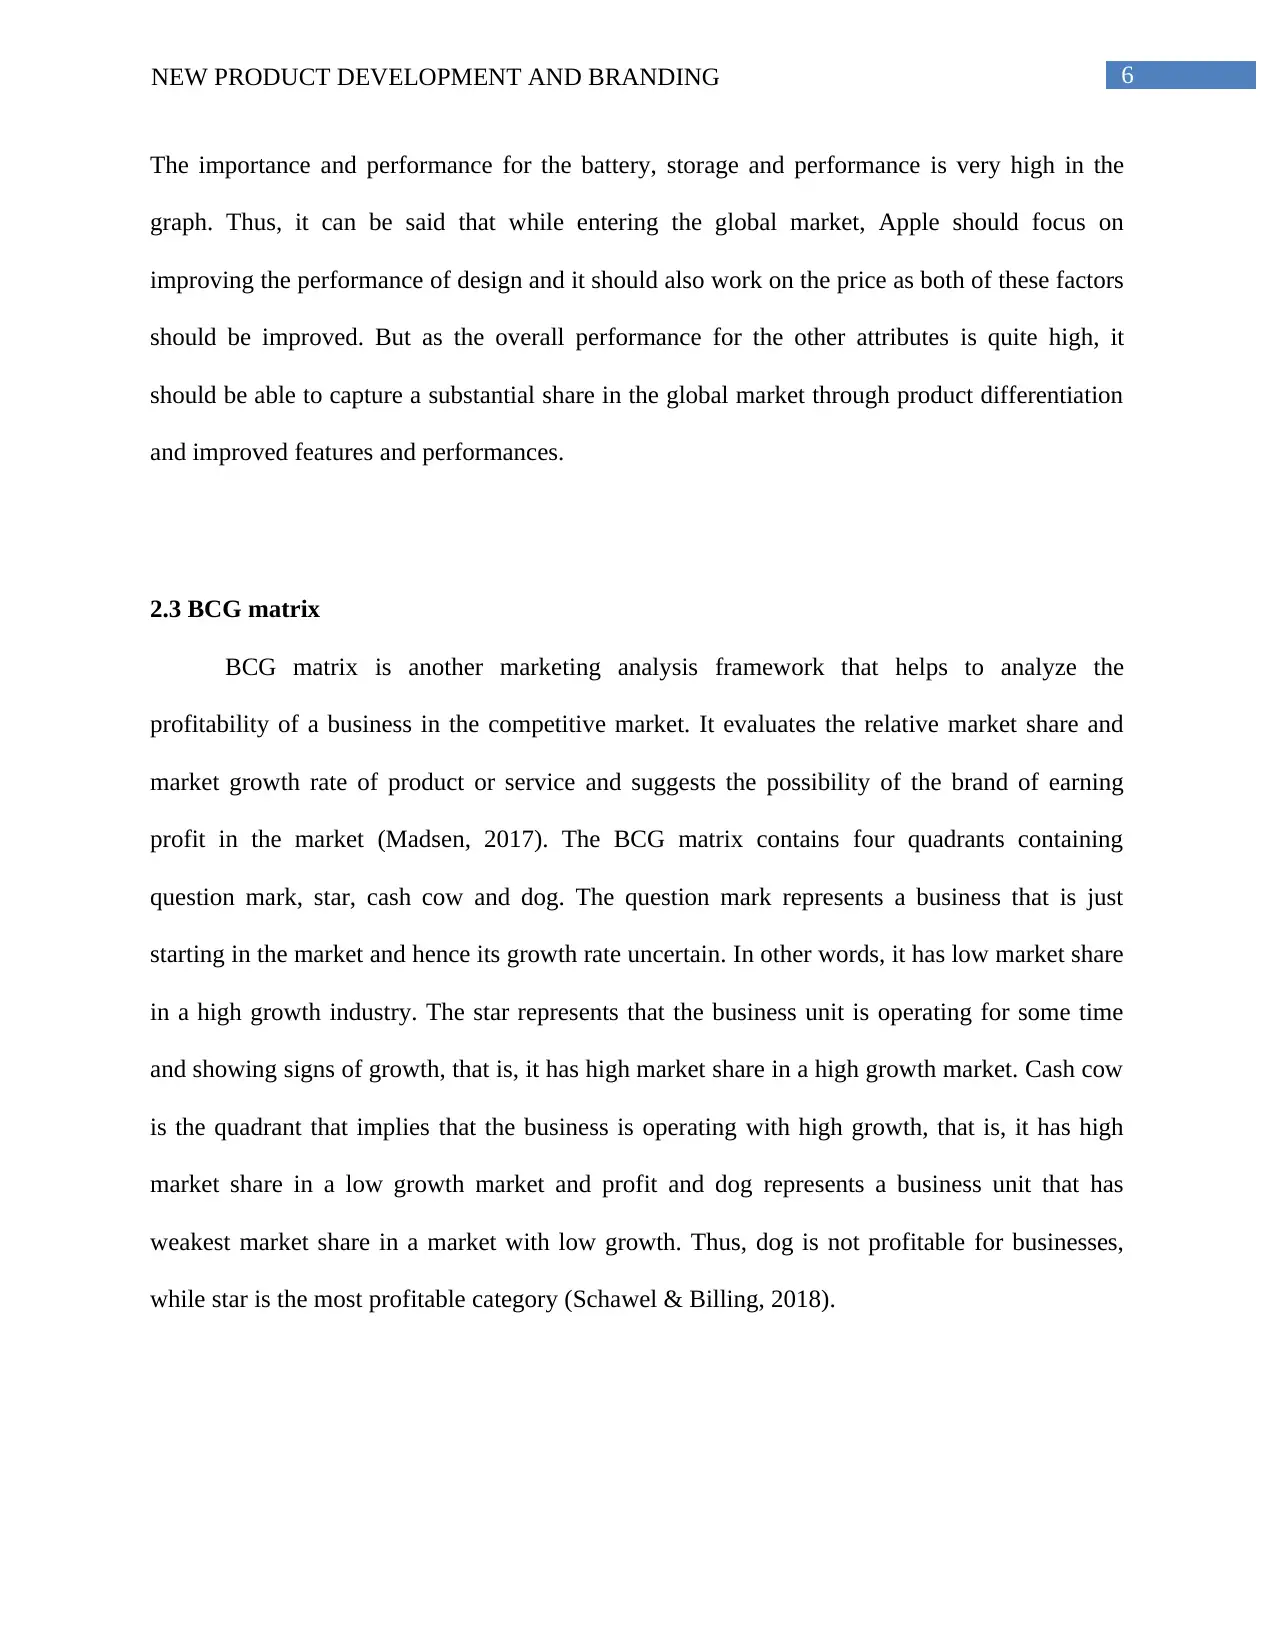
2.3 BCG matrix
BCG matrix is another marketing analysis framework that helps to analyze the
profitability of a business in the competitive market. It evaluates the relative market share and
market growth rate of product or service and suggests the possibility of the brand of earning
profit in the market (Madsen, 2017). The BCG matrix contains four quadrants containing
question mark, star, cash cow and dog. The question mark represents a business that is just
starting in the market and hence its growth rate uncertain. In other words, it has low market share
in a high growth industry. The star represents that the business unit is operating for some time
and showing signs of growth, that is, it has high market share in a high growth market. Cash cow
is the quadrant that implies that the business is operating with high growth, that is, it has high
market share in a low growth market and profit and dog represents a business unit that has
weakest market share in a market with low growth. Thus, dog is not profitable for businesses,
while star is the most profitable category (Schawel & Billing, 2018).
The importance and performance for the battery, storage and performance is very high in the
graph. Thus, it can be said that while entering the global market, Apple should focus on
improving the performance of design and it should also work on the price as both of these factors
should be improved. But as the overall performance for the other attributes is quite high, it
should be able to capture a substantial share in the global market through product differentiation
and improved features and performances.
2.3 BCG matrix
BCG matrix is another marketing analysis framework that helps to analyze the
profitability of a business in the competitive market. It evaluates the relative market share and
market growth rate of product or service and suggests the possibility of the brand of earning
profit in the market (Madsen, 2017). The BCG matrix contains four quadrants containing
question mark, star, cash cow and dog. The question mark represents a business that is just
starting in the market and hence its growth rate uncertain. In other words, it has low market share
in a high growth industry. The star represents that the business unit is operating for some time
and showing signs of growth, that is, it has high market share in a high growth market. Cash cow
is the quadrant that implies that the business is operating with high growth, that is, it has high
market share in a low growth market and profit and dog represents a business unit that has
weakest market share in a market with low growth. Thus, dog is not profitable for businesses,
while star is the most profitable category (Schawel & Billing, 2018).
Paraphrase This Document
Need a fresh take? Get an instant paraphrase of this document with our AI Paraphraser
7NEW PRODUCT DEVELOPMENT AND BRANDING
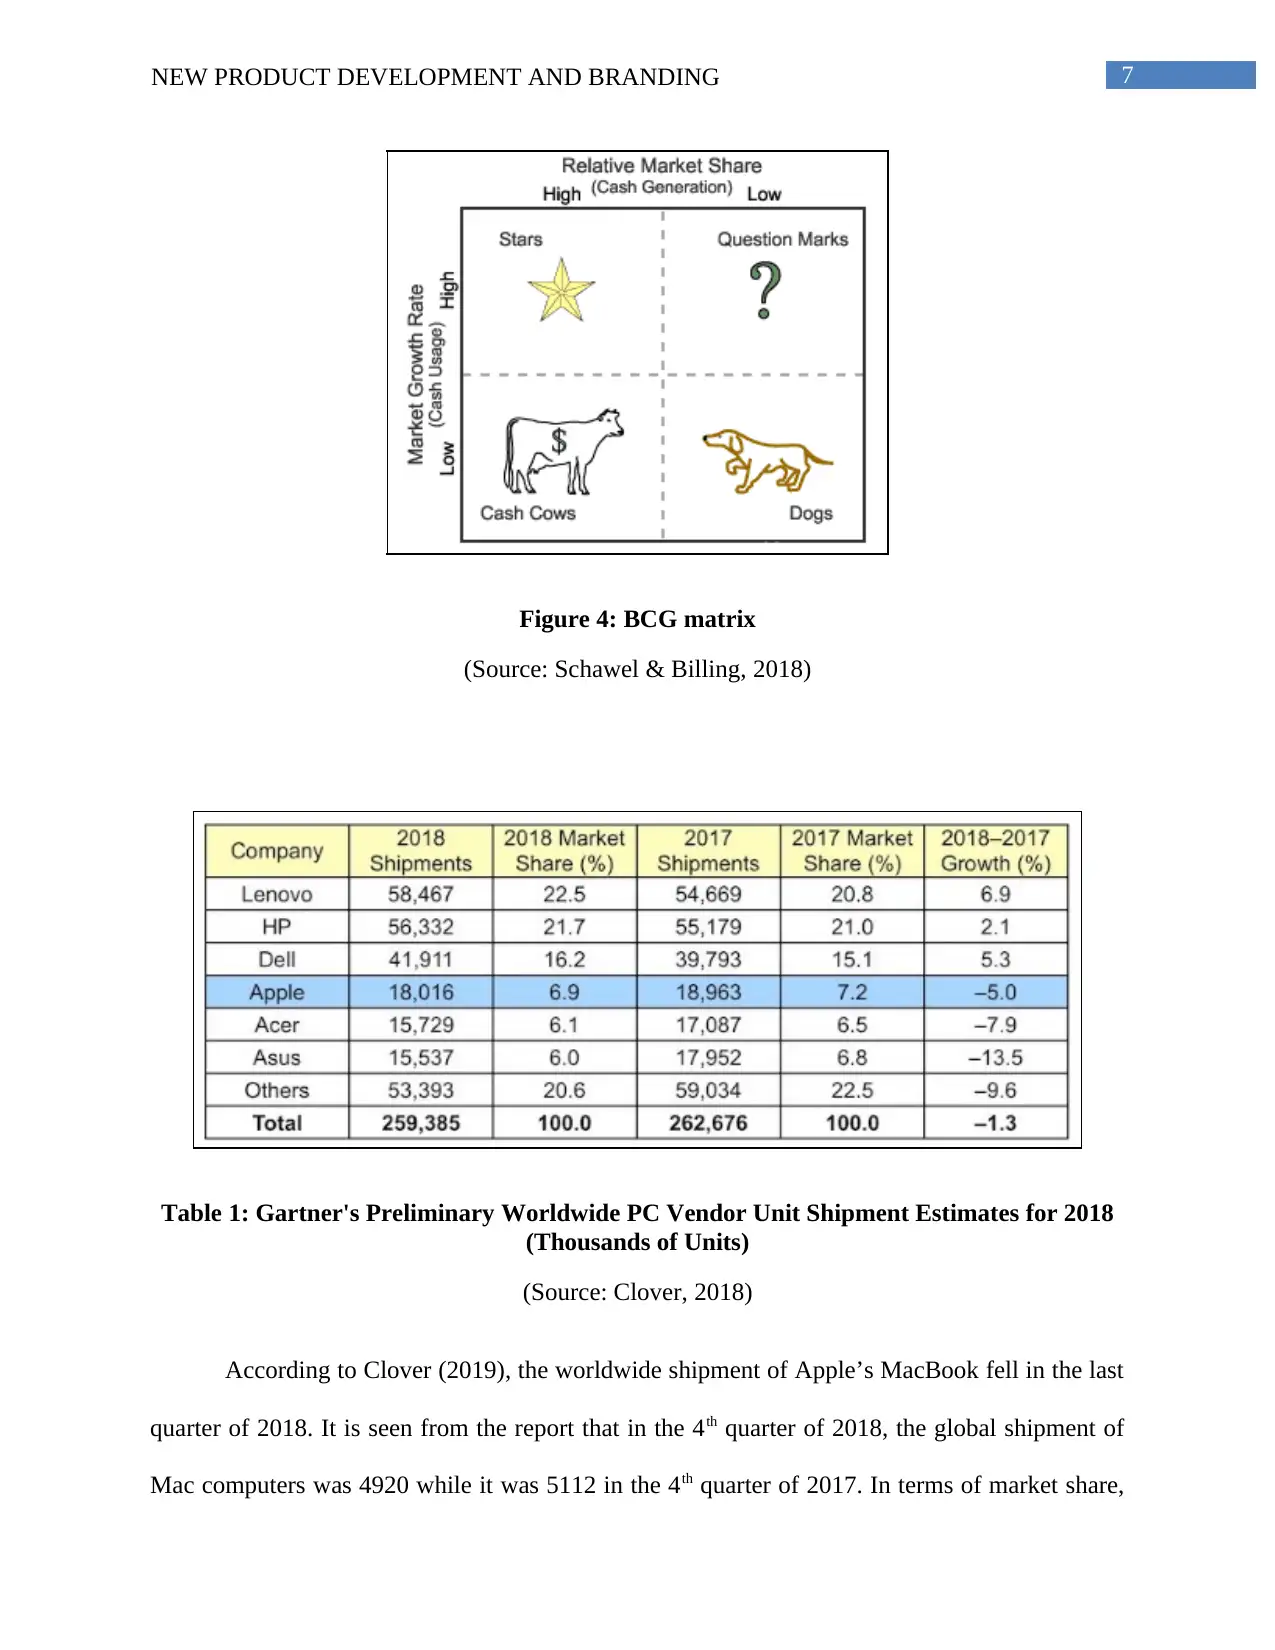
Figure 4: BCG matrix
(Source: Schawel & Billing, 2018)
Table 1: Gartner's Preliminary Worldwide PC Vendor Unit Shipment Estimates for 2018
(Thousands of Units)
(Source: Clover, 2018)
According to Clover (2019), the worldwide shipment of Apple’s MacBook fell in the last
quarter of 2018. It is seen from the report that in the 4th quarter of 2018, the global shipment of
Mac computers was 4920 while it was 5112 in the 4th quarter of 2017. In terms of market share,
8NEW PRODUCT DEVELOPMENT AND BRANDING
it was 7.2% in the 4th quarter of 2018 while it was 7.1% in 2017. The market growth rate from
the 4th quarter of 2017 to 2018 was -3.8%. The reason of this negative growth rate for Apple was
the positive growth for other companies, that is, Dell, HP, and Lenovo. Thus, MacBook Pro also
faced a drop in its sales and market share, partly due to the launch of MacBook Air (Lovejoy,
2018). In other words, product differentiation strategy also creates obstacles for other products
under the same brand. However, it has still left behind many other brands, such as, Asus, Acer,
Microsoft and Samsung in terms of market growth and market share. It has brand loyal
customers who help them to retain the market share locally and globally.
Thus, to evaluate the BCG matrix for Apple MacBook Pro, it can be said that MacBook
Pro is a cash cow, that is, it has a high cash generation capacity but the market growth rate is low
as the demand for laptops are decreasing in the global market due to introduction of smart
devices.
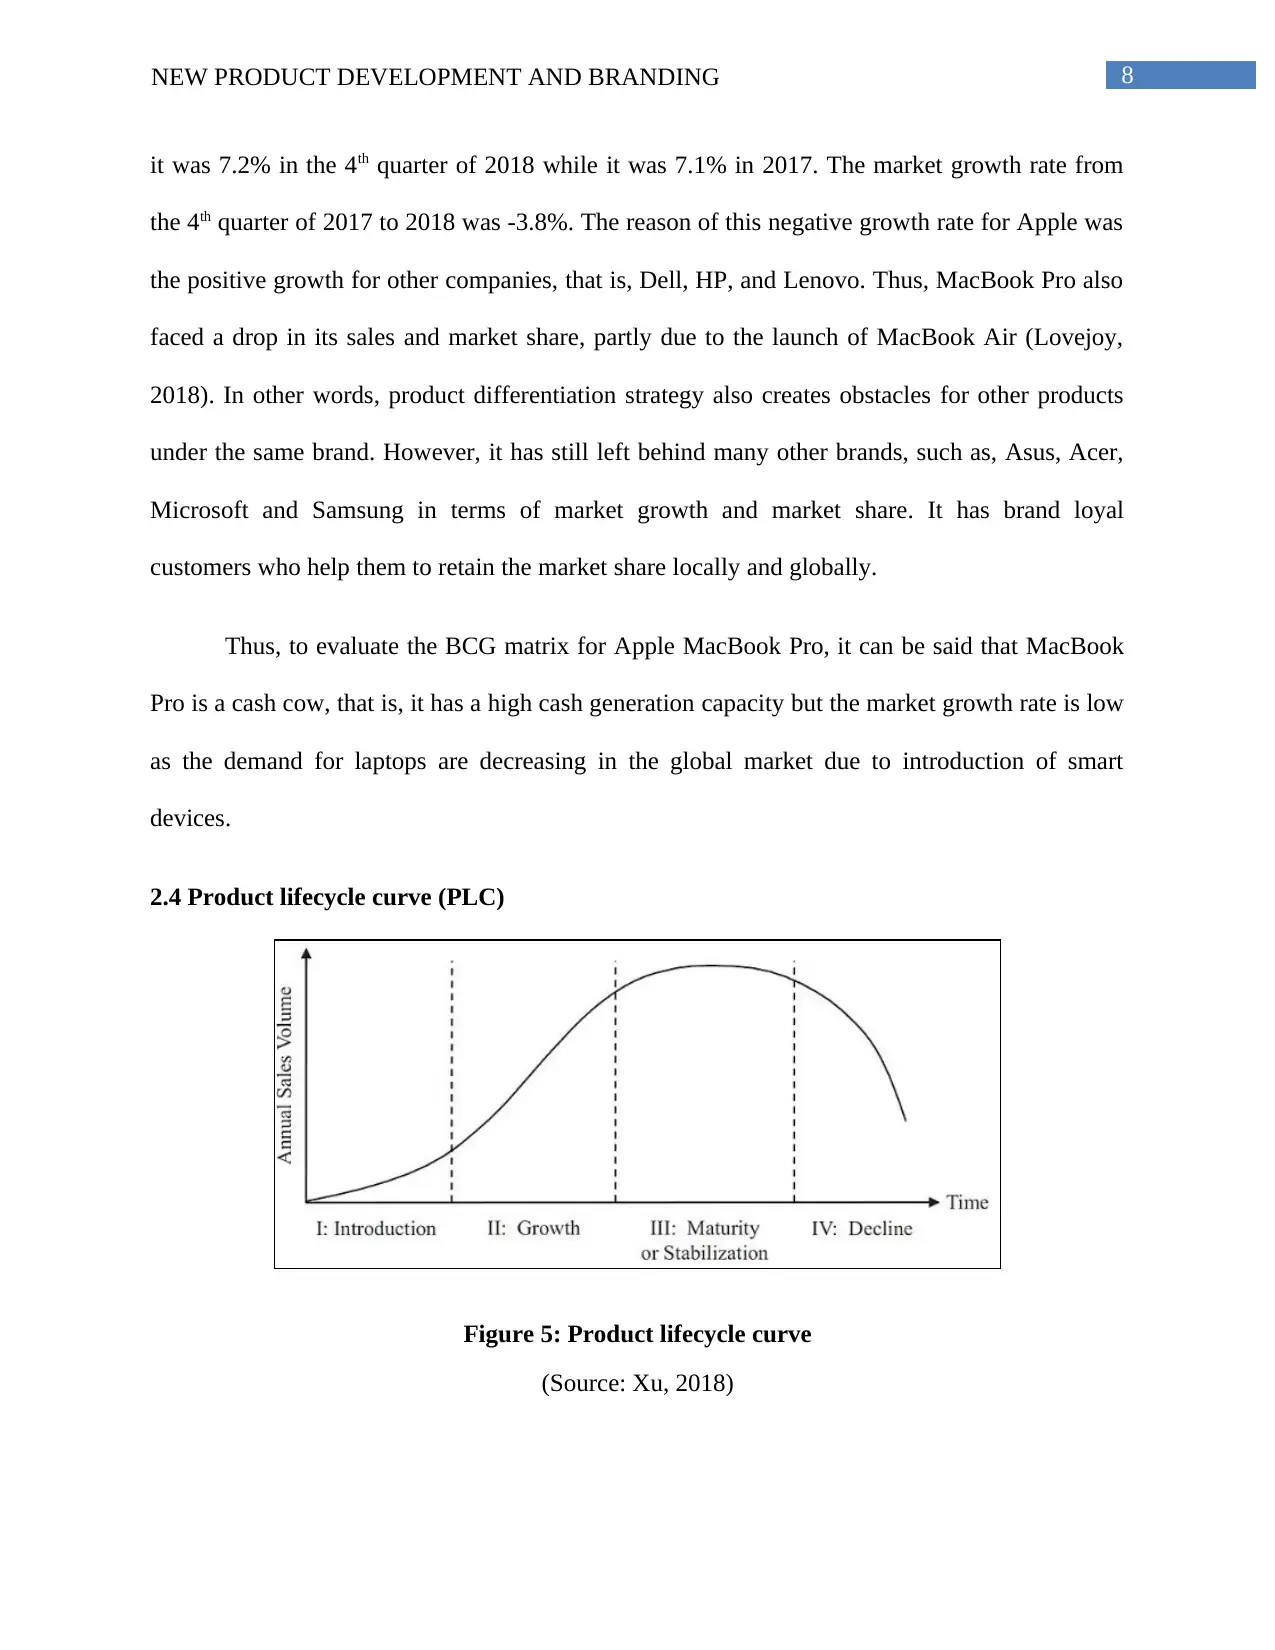
2.4 Product lifecycle curve (PLC)
Figure 5: Product lifecycle curve
(Source: Xu, 2018)
it was 7.2% in the 4th quarter of 2018 while it was 7.1% in 2017. The market growth rate from
the 4th quarter of 2017 to 2018 was -3.8%. The reason of this negative growth rate for Apple was
the positive growth for other companies, that is, Dell, HP, and Lenovo. Thus, MacBook Pro also
faced a drop in its sales and market share, partly due to the launch of MacBook Air (Lovejoy,
2018). In other words, product differentiation strategy also creates obstacles for other products
under the same brand. However, it has still left behind many other brands, such as, Asus, Acer,
Microsoft and Samsung in terms of market growth and market share. It has brand loyal
customers who help them to retain the market share locally and globally.
Thus, to evaluate the BCG matrix for Apple MacBook Pro, it can be said that MacBook
Pro is a cash cow, that is, it has a high cash generation capacity but the market growth rate is low
as the demand for laptops are decreasing in the global market due to introduction of smart
devices.
2.4 Product lifecycle curve (PLC)
Figure 5: Product lifecycle curve
(Source: Xu, 2018)
⊘ This is a preview!⊘
Do you want full access?
Subscribe today to unlock all pages.
Trusted by 1+ million students worldwide
9NEW PRODUCT DEVELOPMENT AND BRANDING
There are 4 stages that describe the product life cycle, namely, introduction, growth,
maturity and decline (Xu, 2018). According to the sales data for MacBook Pro, Apple refreshed
the MacBook Pro generation in 2016, which led to an increase in sales in quarter 2 of 2017. It
sold around 4.29 million of the Mac units, which is a slight increase than the sales in the same
quarter of 2016 (Hardy, 2018). The sales increase when there is an update in the products. The
sales in Q4 in 2018 was less than that in Q4 of 2017, which indicates that since there has been no
product upgradation new version, the shipping of Mac units fell. However, the revenue was
higher due to higher selling price of the MacBook Pro. Thus, following the PLC, it can be said
that MacBook Pro by Apple lies in the third stage, that is, in the maturity or stabilization state. In
this stage, the market for the product is mature and it is the most competitive time for the product
and investment by the business. Hence, as the MacBook Pro falls in this stage, Apple brings new
versions to gain competitive advantage and increase its market share. Although the shipment has
declined in Q4 of 2018, yet Apple can bring back the market growth by launching a new version
of the MacBook Pro and thus, it has not yet moved to the decline stage of the PLC.
3. Conclusion
From the above brand and market analysis for MacBook Pro, it can be concluded that for
a global market entry, Apple should not only focus on the differentiation strategy, but should
also focus on improving the performance attribute in design, price, and battery life for the
MacBook Pro to capture a larger market share. The product can be categorized as a cash cow for
Apple and it still lies at the third stage, that is, the maturity stage of the product life cycle curve,
hence, it has opportunities of growth in the global market. It has been seen that the sales volume
for the Apple Mac units increase when there is an upgradation in the versions. Thus, there is
demand for Apple products despite its higher selling price due to its importance to the loyal
Paraphrase This Document
Need a fresh take? Get an instant paraphrase of this document with our AI Paraphraser
10NEW PRODUCT DEVELOPMENT AND BRANDING
customers and high level of performance in comparison to the rival products. The company thus
should adopt the strategy of product upgradation strategy, such as, increase in battery life,
improvement in keyboard, introduction of ports for enabling the usage of internet dongles, which
would also increase customer convenience. Hence, for the global market entry with MacBook
Pro, Apple should utilize the brand value as well as should opt for improvisation of the product
while maintaining the premium pricing strategy.
11NEW PRODUCT DEVELOPMENT AND BRANDING
References
apple.com. (2019). MacBook Pro - Technical Specifications. Retrieved from
https://www.apple.com/macbook-pro/specs/
Clover, J. (2018). Apple's Mac Sales Drop in Q4 2018 Amid Worldwide PC Shipment Decline.
Retrieved from https://www.macrumors.com/2019/01/10/apple-mac-sales-drop-q4-2018/
Hardy, E. (2018). Mac sales declined in Q3, despite new MacBook Pros. Retrieved from
https://www.cultofmac.com/582236/mac-sales-q3-2018-gartner/
Haslam, K. (2018). Apple fourth quarter results: increased iPhone revenue reported. Retrieved
from https://www.macworld.co.uk/news/apple/apple-financial-results-3581769/
Lovejoy, B. (2018). Mac market share crashed in Q3, likely in part due to new MacBook Air.
Retrieved from https://9to5mac.com/2018/11/21/mac-market-share/
Madsen, D. O. (2017). Not dead yet: the rise, fall and persistence of the BCG Matrix. Problems
and Perspectives in Management, 15(1), 19-34.
Salavou, H. E. (2015). Competitive strategies and their shift to the future. European Business
Review, 27(1), 80-99.
Schawel, C., & Billing, F. (2018). BCG-Matrix. In Top 100 Management Tools (pp. 41-43).
Springer Gabler, Wiesbaden.
Sethna, B. N. (2015). Extensions and testing of importance-performance analysis.
In Proceedings of the 1982 Academy of Marketing Science (AMS) Annual
Conference (pp. 327-331). Springer, Cham.
⊘ This is a preview!⊘
Do you want full access?
Subscribe today to unlock all pages.
Trusted by 1+ million students worldwide
1 out of 13
Related Documents


Your All-in-One AI-Powered Toolkit for Academic Success.
+13062052269
info@desklib.com
Available 24*7 on WhatsApp / Email
![[object Object]](/_next/static/media/star-bottom.7253800d.svg)
Unlock your academic potential
Copyright © 2020–2026 A2Z Services. All Rights Reserved. Developed and managed by ZUCOL.