Statistical Machine Learning Project: LBP Classification, April 2019
VerifiedAdded on 2023/01/17
|14
|2614
|94
Project
AI Summary
This project focuses on classifying subjects with lower back pain (LBP) using machine learning techniques. The study utilizes a dataset containing 32 variables from 380 subjects, aiming to identify the most effective classification algorithm for determining LBP and Chronic LBP (CLBP) diagnoses. The project compares the performance of Decision Trees, Random Forests, and Support Vector Machines (SVM). The Random Forest algorithm achieved the highest classification accuracy. The results highlight Pain Location, Criterion 2, and Criterion 8 as the most relevant variables for classification. The project's objective is to develop an optimum classification algorithm in classifying subjects according to their lower back pain diagnoses using historical data. The study also addresses the research question of determining the best algorithm for classifying subjects based on performance measures, providing insights into the application of machine learning in healthcare for improved diagnosis and treatment decisions.
Title: STATISTICAL MACHINE LEARNING
Task: Classification of Objects According to Their Lower Back Pain
Student Name:
Lecturer:
School:
Course Name:
Unit Code:
Due Date: April 28th 2019
Task: Classification of Objects According to Their Lower Back Pain
Student Name:
Lecturer:
School:
Course Name:
Unit Code:
Due Date: April 28th 2019
Paraphrase This Document
Need a fresh take? Get an instant paraphrase of this document with our AI Paraphraser
Abstract
It is often critical to be able to administer the correct treatment to a patient’s condition. With the
high number of cases reported on Low Back Pain, there is need to define new efficient methods
to enable efficient addressing of the issue. Modern data analysis methods which include machine
learning have proven to be efficient in business practices such as sales forecasting. Applying the
same concept of machine learning classification methods, this paper seeks to identify the best
method usable in determining the mechanisms responsible for LBP and CLBP using Random
Forests, Decision Trees, and Support Vector Machine.
Results
Only three mechanisms, Pain Location, Criterion 2 and criterion 8 are identified as the best in
classifying LBP and CLBP while the Random Forest Algorithm had the highest classification
accuracy i.e. 94.90%.
Keywords
Gini Index, decision theory, decision trees, LBP (Low back Pain), CLBP (Chronic Low back
pain)
Introduction
Low back Pain (LBP) is a prevalent musculoskeletal condition among majority of adult
population, with affecting persons up to a rate as high as 84%. Moreover, after 3 months LBP is
categorized into chronic because normally most connective tissues heal in a period of 6-12
weeks. Therefore, Chronic LBP (CLBP) is a chronic pain syndrome that affects the lower back
region persisting for approximately 12 weeks or more (Chou, Deyo, and Jarvik, 2012).
Definition of both LBP and CLBP underlies the basis of the argument that CLBP is actually
disease and not a symptom (Allegri et al., 2016). To support this argument, most researchers
argue that chronic pain is that which persists well beyond an expected period after within which
it should have healed (Allegri et al., 2016). According to Balagué et al. (2012), “CLBP
represents the leading cause of disability worldwide and is a major welfare and economic
problem.” As such, LBP is both a social and economic problem contributing to 57.6 million of
total years lived with disability as of 2016.
Until 2009, there were few methods available if any used adapted in as clinical criterion
by clinicians to establish mechanisms-based classifications of pain (Smart et al., 2009). Lately, it
has been hypothesized that, classifying patients lower back pain upon following a clinical
judgement given a likely dominant category of neurophysiological mechanisms which are
responsible for its generation and/or persistence is crucial as to inform treatment through
enabling clinicians prime treatments that are known or hypothesized to target the mechanisms so
as to optimize clinical results (Garland, 2012).
Objective
The objective of this paper is therefore develop an optimum classification algorithm among a
number of classification techniques in classifying subjects according to their lower back pain
diagnoses using historical data containing information on subjects suffering from LBP. The
dataset contains 32 variables observed from 380 subjects. The response variable is Pain
Diagnosis while the rest are explanatory.
Research Questions
This study is a data mining problem hence it aims to answer the question as to which is the best
algorithm that can be used to classifying subjects according to their lower back pain diagnoses
based on the algorithm performance measures?
⊘ This is a preview!⊘
Do you want full access?
Subscribe today to unlock all pages.
Trusted by 1+ million students worldwide
Methods
This study aims to determine an optimum algorithm with which to classify patients lower back
pain based on a clinical judgement, a model which will aid in decision making given the
symptoms present. Despite the fact that there are a number of classification models, only three of
the models will be explored, that is:
i. Decision trees
ii. Random Forests
iii. Logistic regression
Decision trees
Given the binary classification problem of the LBP, the aim in decision trees is to enable
definition of the logic for the data to be interpreted. In decision trees each node will represent a
feature i.e. variable, while a link represents a decision rule and a leaf represents the outcome of
the decision. Drabiková and Fecková (2017) propose a decision tree methodology which uses an
Iterative Dichotomizer 3 (ID3) which uses the Entropy function and Information gain as metrics.
The metrics are applied using the following algorithm:
i. Determine the entropy for data-set
ii. for every feature:
compute entropy for the categorical values
use the current attribute’s average entropy details
compute details gain for the current attribute
iii. Select the highest gain attribute.
iv. Rerun the above steps until the tree that is desired is obtained.
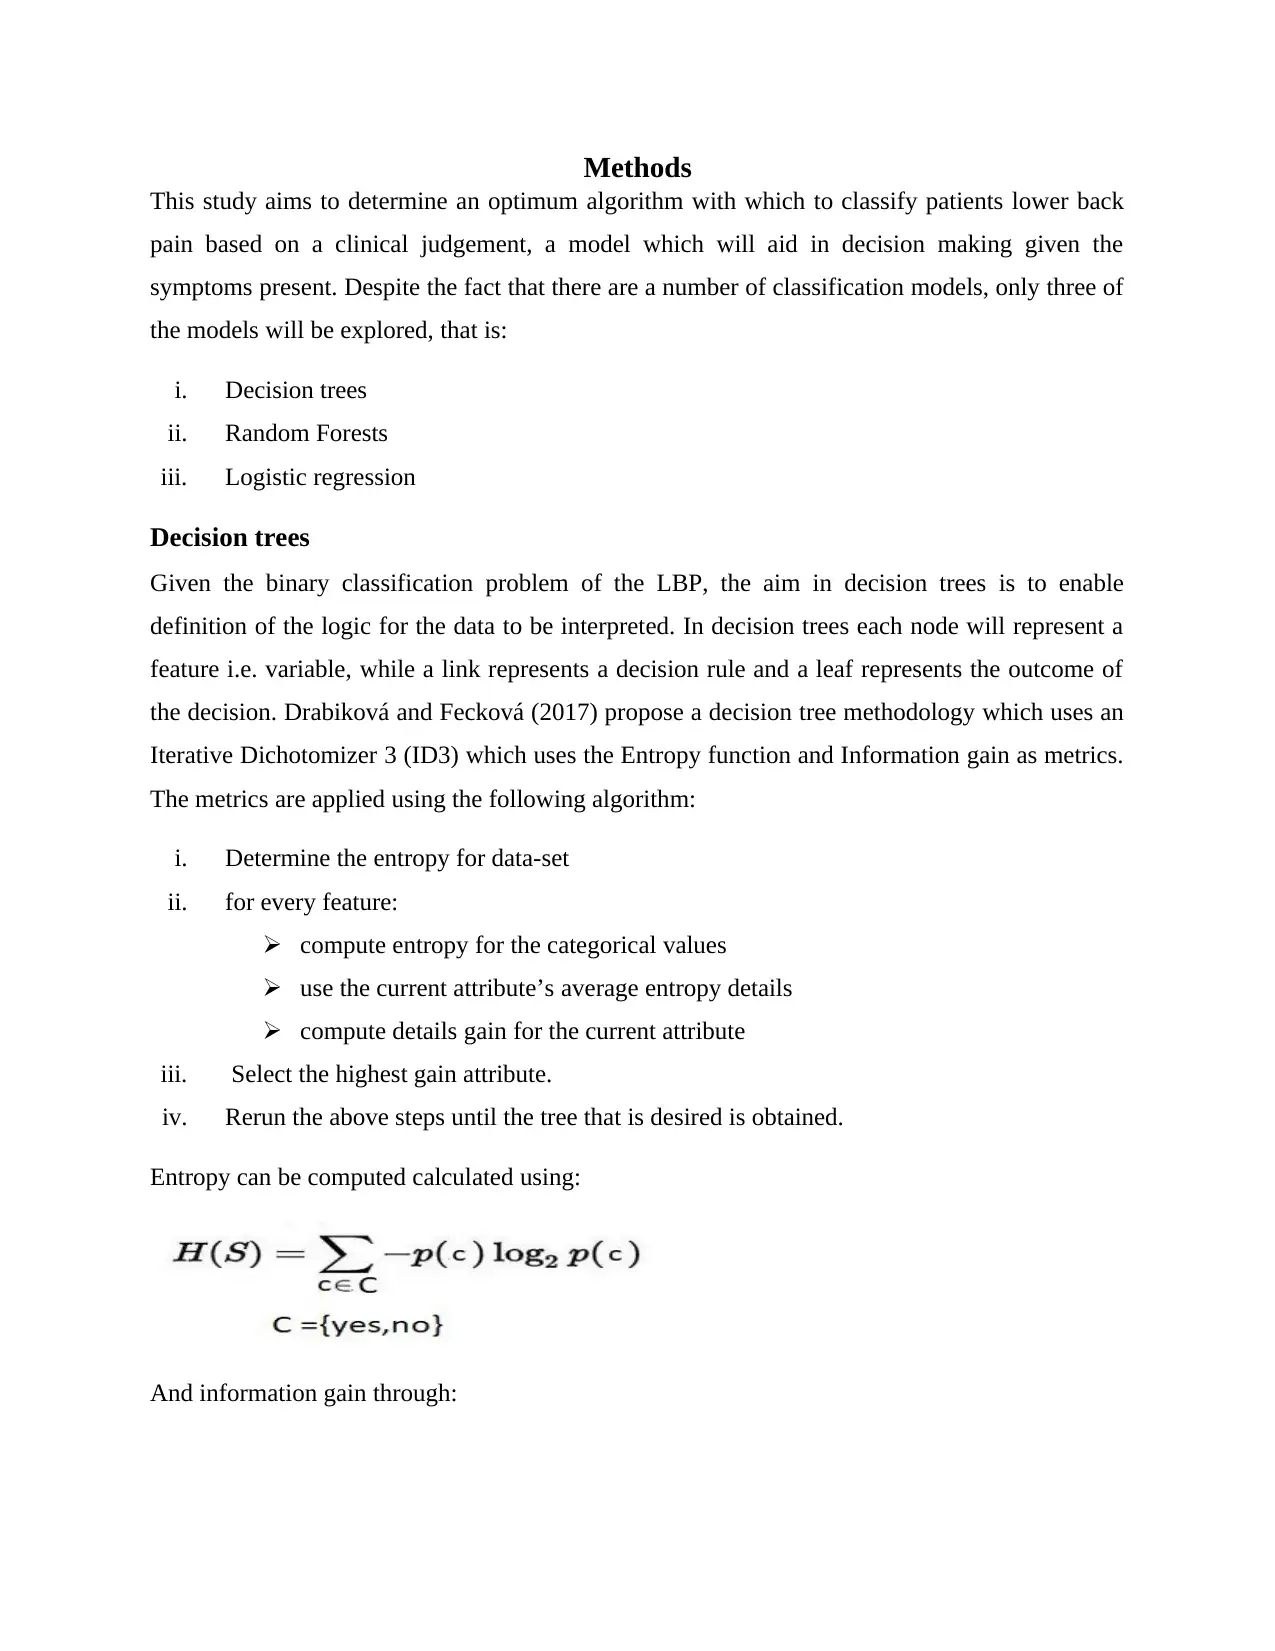
Entropy can be computed calculated using:
And information gain through:
This study aims to determine an optimum algorithm with which to classify patients lower back
pain based on a clinical judgement, a model which will aid in decision making given the
symptoms present. Despite the fact that there are a number of classification models, only three of
the models will be explored, that is:
i. Decision trees
ii. Random Forests
iii. Logistic regression
Decision trees
Given the binary classification problem of the LBP, the aim in decision trees is to enable
definition of the logic for the data to be interpreted. In decision trees each node will represent a
feature i.e. variable, while a link represents a decision rule and a leaf represents the outcome of
the decision. Drabiková and Fecková (2017) propose a decision tree methodology which uses an
Iterative Dichotomizer 3 (ID3) which uses the Entropy function and Information gain as metrics.
The metrics are applied using the following algorithm:
i. Determine the entropy for data-set
ii. for every feature:
compute entropy for the categorical values
use the current attribute’s average entropy details
compute details gain for the current attribute
iii. Select the highest gain attribute.
iv. Rerun the above steps until the tree that is desired is obtained.
Entropy can be computed calculated using:
And information gain through:
Paraphrase This Document
Need a fresh take? Get an instant paraphrase of this document with our AI Paraphraser
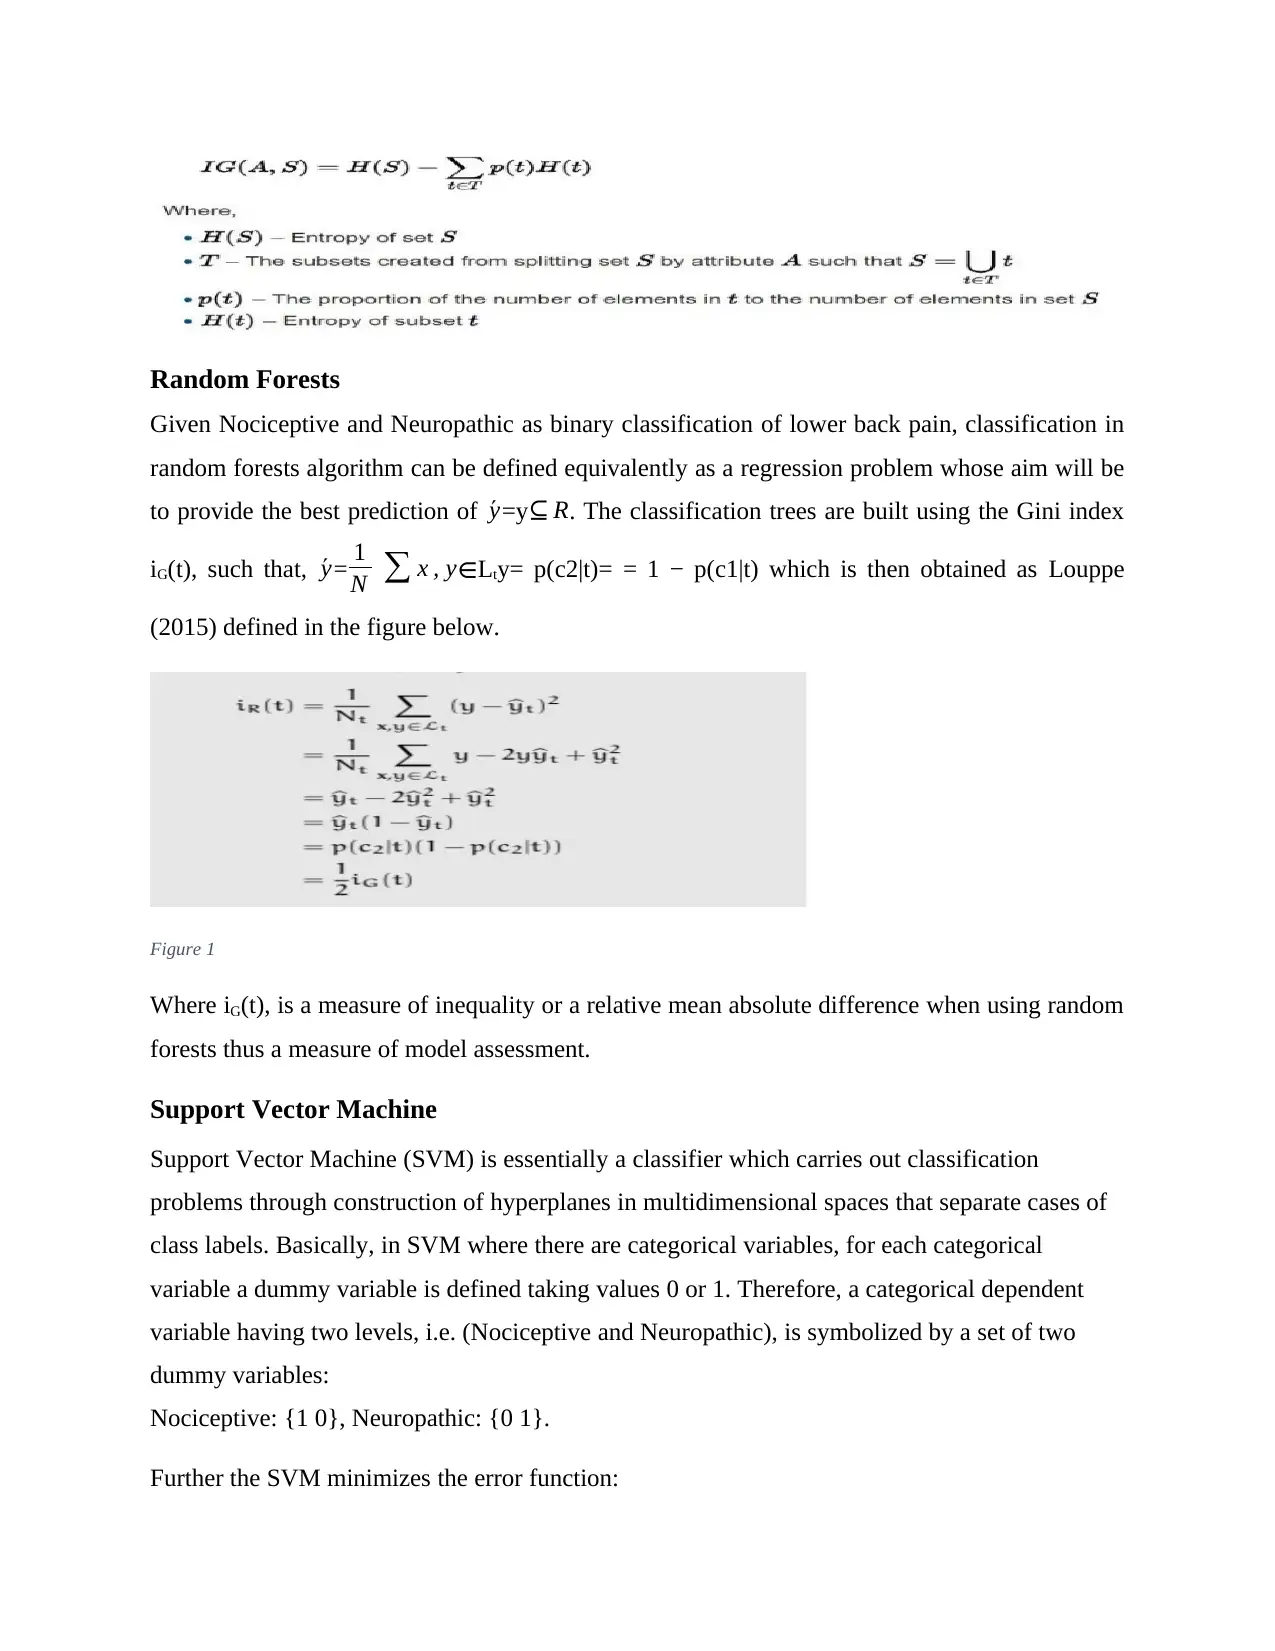
Random Forests
Given Nociceptive and Neuropathic as binary classification of lower back pain, classification in
random forests algorithm can be defined equivalently as a regression problem whose aim will be
to provide the best prediction of ´y=y⊆ R. The classification trees are built using the Gini index
iG(t), such that, ´y= 1
N ∑ x , y∈Lty= p(c2|t)= = 1 − p(c1|t) which is then obtained as Louppe
(2015) defined in the figure below.
Figure 1
Where iG(t), is a measure of inequality or a relative mean absolute difference when using random
forests thus a measure of model assessment.
Support Vector Machine
Support Vector Machine (SVM) is essentially a classifier which carries out classification
problems through construction of hyperplanes in multidimensional spaces that separate cases of
class labels. Basically, in SVM where there are categorical variables, for each categorical
variable a dummy variable is defined taking values 0 or 1. Therefore, a categorical dependent
variable having two levels, i.e. (Nociceptive and Neuropathic), is symbolized by a set of two
dummy variables:
Nociceptive: {1 0}, Neuropathic: {0 1}.
Further the SVM minimizes the error function:
Subject to:
Classification Performance
After conducting classification using the above algorithms, their performance will be accessed
using information derived from the confusion matrix and statistics specifically the models
classification accuracy.
Results
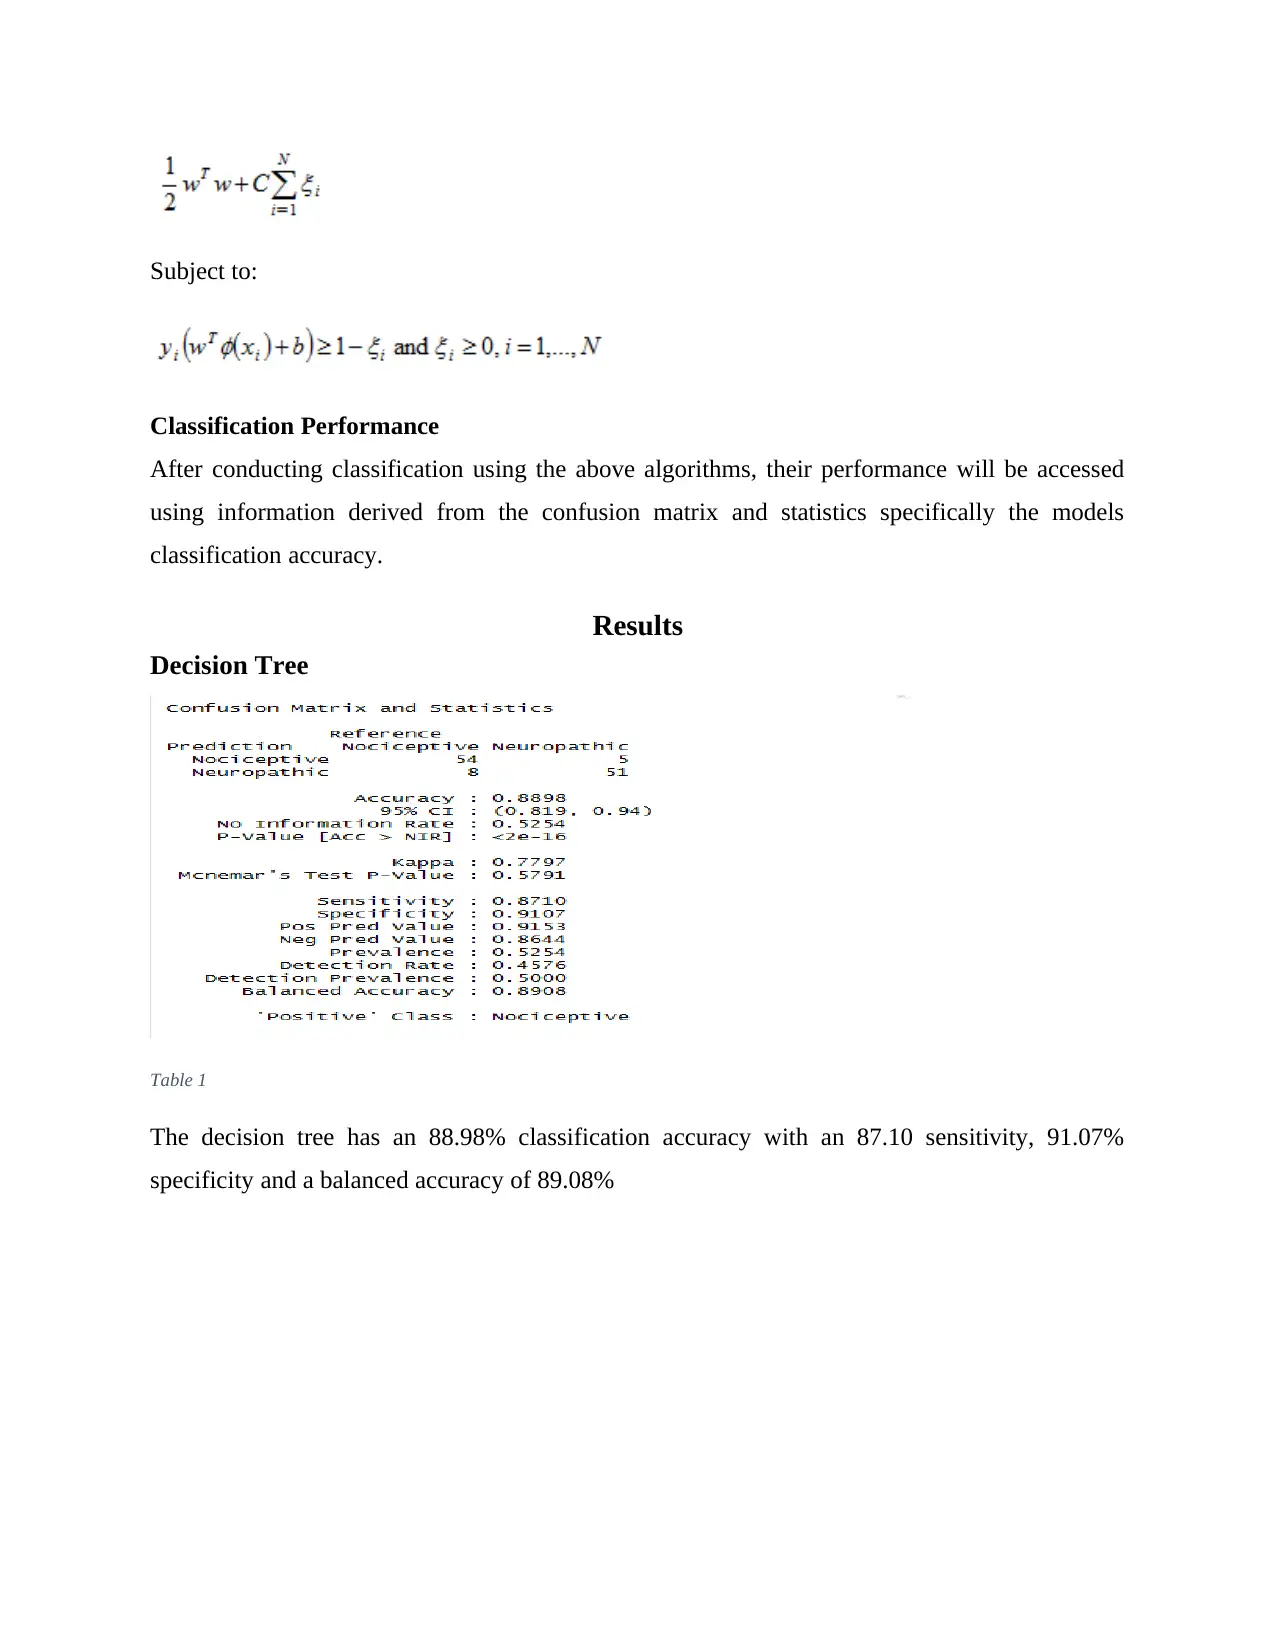
Decision Tree
Table 1
The decision tree has an 88.98% classification accuracy with an 87.10 sensitivity, 91.07%
specificity and a balanced accuracy of 89.08%
Classification Performance
After conducting classification using the above algorithms, their performance will be accessed
using information derived from the confusion matrix and statistics specifically the models
classification accuracy.
Results
Decision Tree
Table 1
The decision tree has an 88.98% classification accuracy with an 87.10 sensitivity, 91.07%
specificity and a balanced accuracy of 89.08%
⊘ This is a preview!⊘
Do you want full access?
Subscribe today to unlock all pages.
Trusted by 1+ million students worldwide
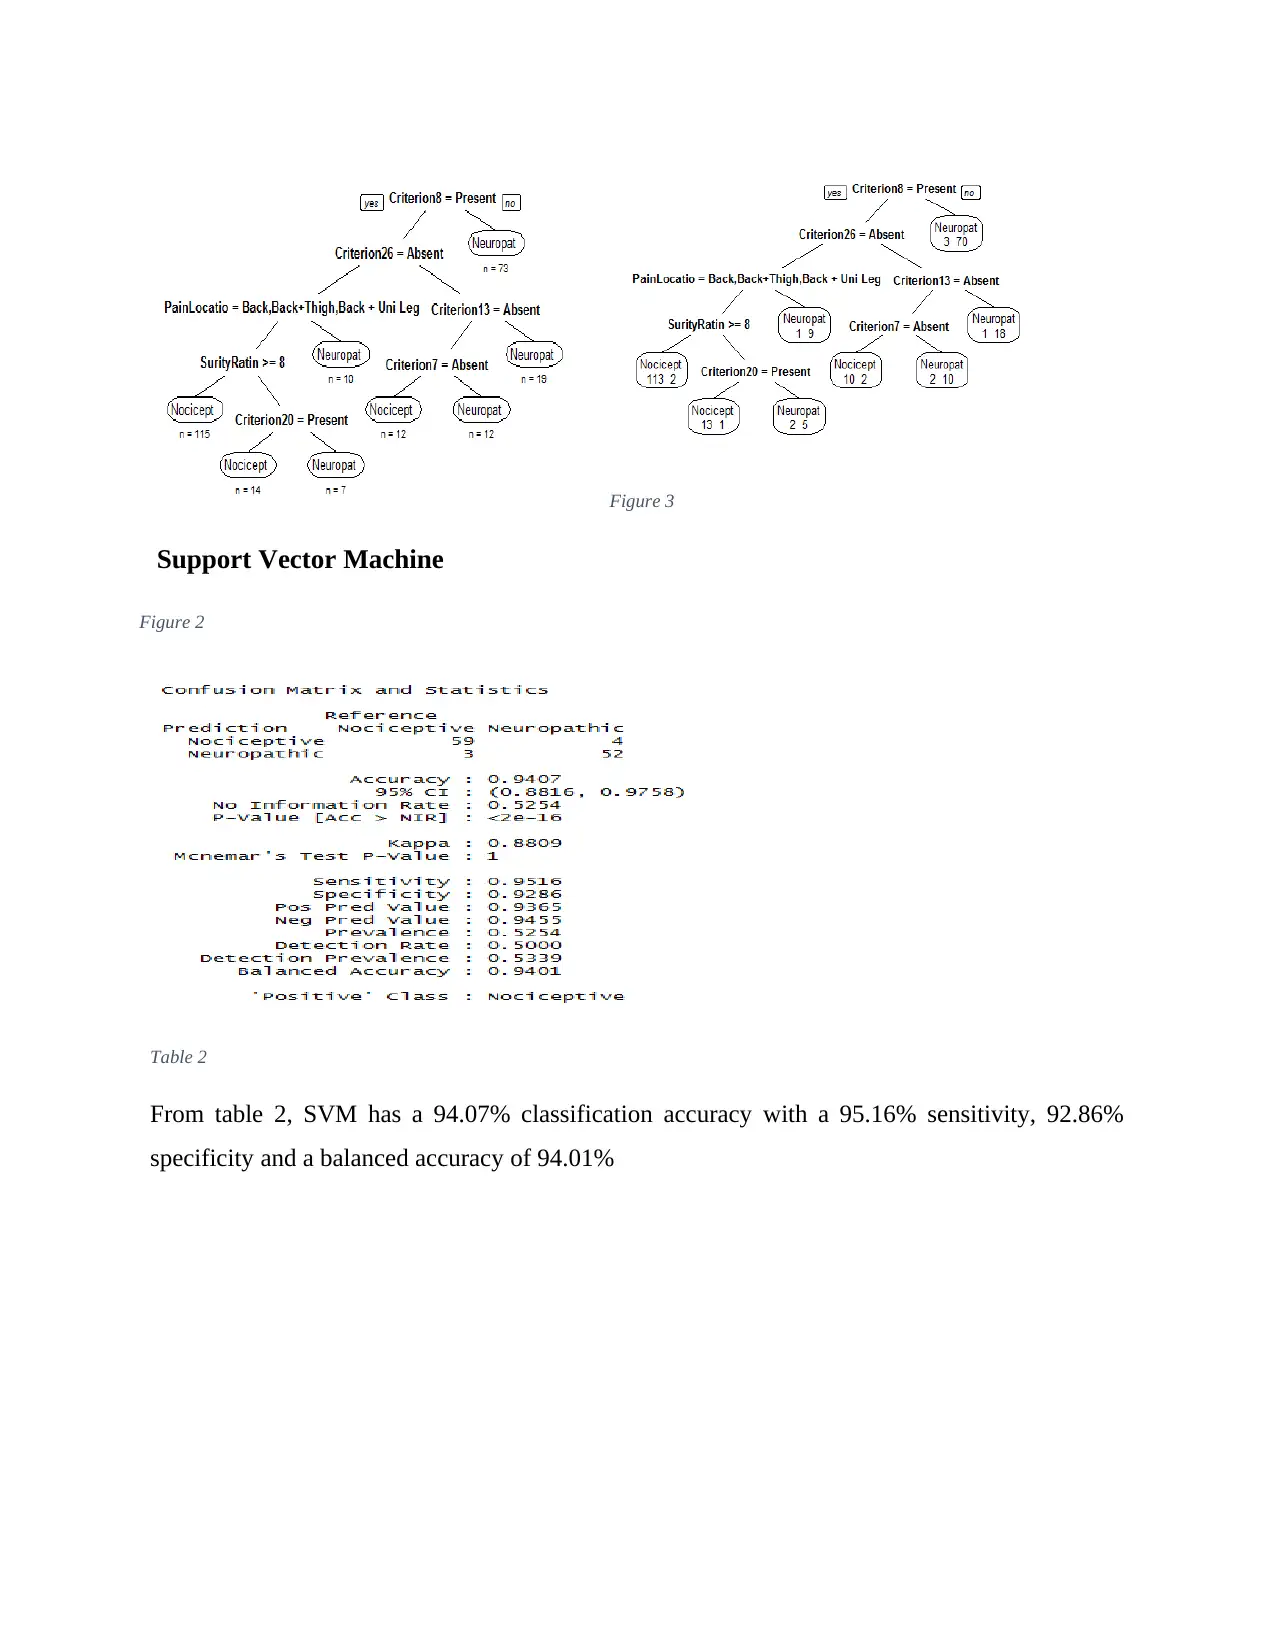
Figure 3
Support Vector Machine
Table 2
From table 2, SVM has a 94.07% classification accuracy with a 95.16% sensitivity, 92.86%
specificity and a balanced accuracy of 94.01%
Figure 2
Support Vector Machine
Table 2
From table 2, SVM has a 94.07% classification accuracy with a 95.16% sensitivity, 92.86%
specificity and a balanced accuracy of 94.01%
Figure 2
Paraphrase This Document
Need a fresh take? Get an instant paraphrase of this document with our AI Paraphraser
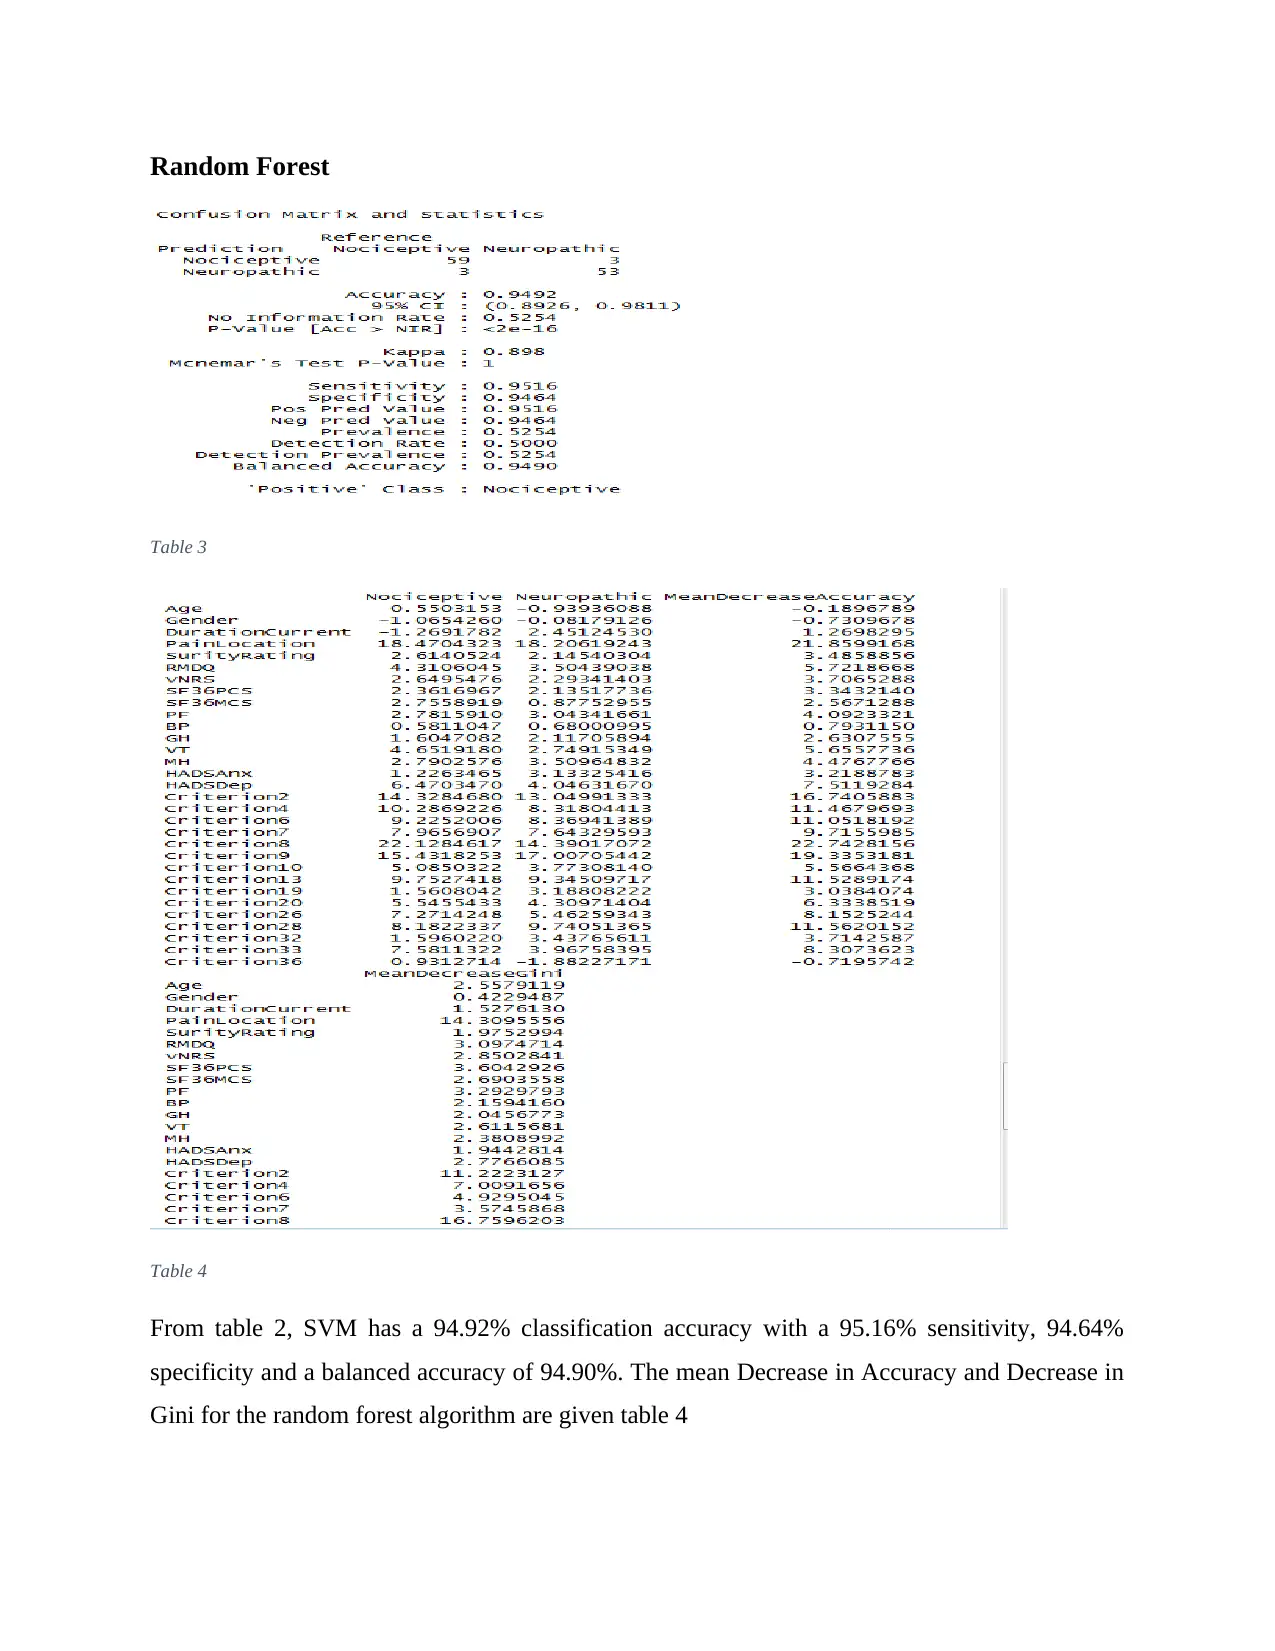
Random Forest
Table 3
Table 4
From table 2, SVM has a 94.92% classification accuracy with a 95.16% sensitivity, 94.64%
specificity and a balanced accuracy of 94.90%. The mean Decrease in Accuracy and Decrease in
Gini for the random forest algorithm are given table 4
Table 3
Table 4
From table 2, SVM has a 94.92% classification accuracy with a 95.16% sensitivity, 94.64%
specificity and a balanced accuracy of 94.90%. The mean Decrease in Accuracy and Decrease in
Gini for the random forest algorithm are given table 4
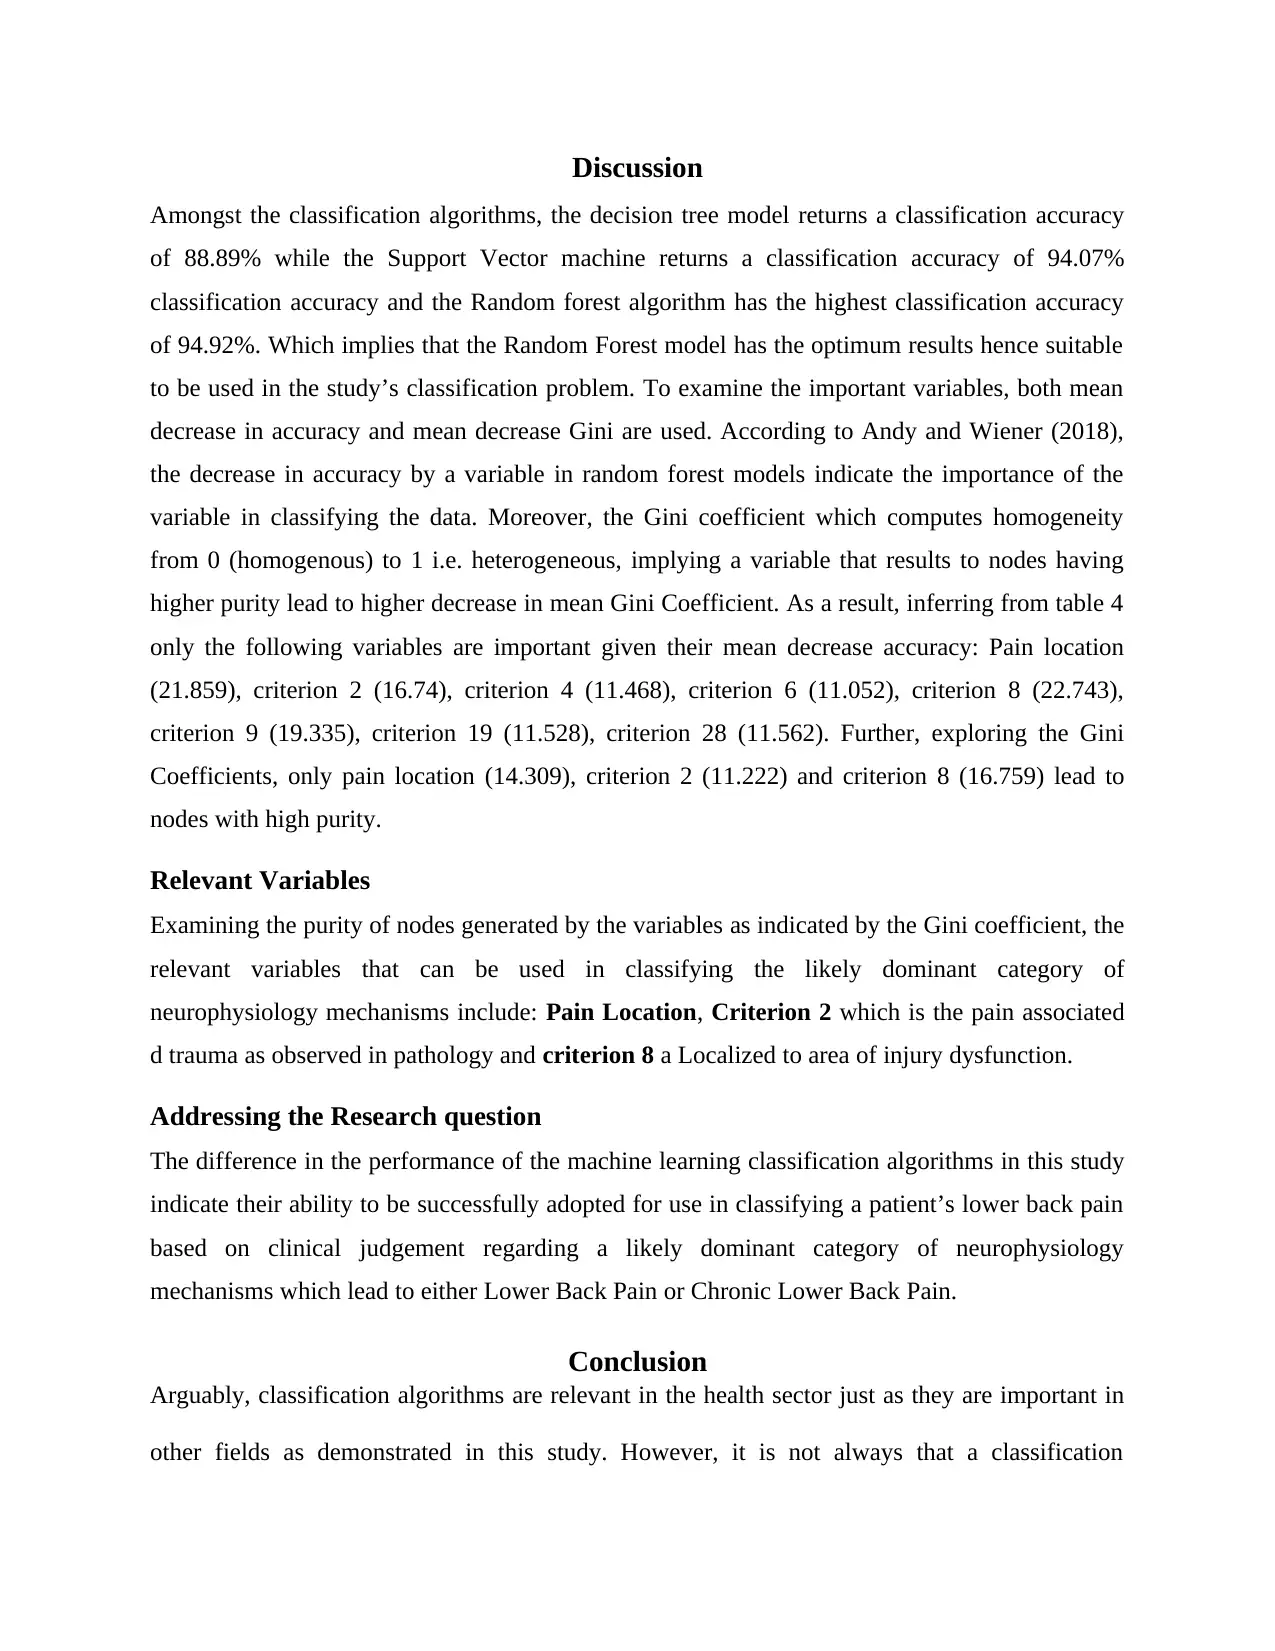
Discussion
Amongst the classification algorithms, the decision tree model returns a classification accuracy
of 88.89% while the Support Vector machine returns a classification accuracy of 94.07%
classification accuracy and the Random forest algorithm has the highest classification accuracy
of 94.92%. Which implies that the Random Forest model has the optimum results hence suitable
to be used in the study’s classification problem. To examine the important variables, both mean
decrease in accuracy and mean decrease Gini are used. According to Andy and Wiener (2018),
the decrease in accuracy by a variable in random forest models indicate the importance of the
variable in classifying the data. Moreover, the Gini coefficient which computes homogeneity
from 0 (homogenous) to 1 i.e. heterogeneous, implying a variable that results to nodes having
higher purity lead to higher decrease in mean Gini Coefficient. As a result, inferring from table 4
only the following variables are important given their mean decrease accuracy: Pain location
(21.859), criterion 2 (16.74), criterion 4 (11.468), criterion 6 (11.052), criterion 8 (22.743),
criterion 9 (19.335), criterion 19 (11.528), criterion 28 (11.562). Further, exploring the Gini
Coefficients, only pain location (14.309), criterion 2 (11.222) and criterion 8 (16.759) lead to
nodes with high purity.
Relevant Variables
Examining the purity of nodes generated by the variables as indicated by the Gini coefficient, the
relevant variables that can be used in classifying the likely dominant category of
neurophysiology mechanisms include: Pain Location, Criterion 2 which is the pain associated
d trauma as observed in pathology and criterion 8 a Localized to area of injury dysfunction.
Addressing the Research question
The difference in the performance of the machine learning classification algorithms in this study
indicate their ability to be successfully adopted for use in classifying a patient’s lower back pain
based on clinical judgement regarding a likely dominant category of neurophysiology
mechanisms which lead to either Lower Back Pain or Chronic Lower Back Pain.
Conclusion
Arguably, classification algorithms are relevant in the health sector just as they are important in
other fields as demonstrated in this study. However, it is not always that a classification
⊘ This is a preview!⊘
Do you want full access?
Subscribe today to unlock all pages.
Trusted by 1+ million students worldwide

algorithm performance or output is the same as another. For instance, the three algorithms
adopted in the paper perform differently and it is left for the analyst to adopt whichever is the
best based on the performance metrics in which case the Random Forest algorithm was adopted.
Nevertheless, studies indicate there is no “best” algorithms implying it is often better to try many
classification algorithms in order to be able to determine which algorithm is suitable for the
current problem. Further, the original research supposition on the role of classification in
enabling determination of the factors that lead to either LBP and CLBP has been met given that
the causes have been narrowed down to Pain Location, Criterion 2 and criterion 8. Such will
enable faster decision making in offering treatment to victims of LBP and CLBP sine it offers a
means to make informed decision to clinicians who are to offer treatments that are known or
hypothesized in targeting the three mechanisms hence ensure optimal clinical outcomes.
Paraphrase This Document
Need a fresh take? Get an instant paraphrase of this document with our AI Paraphraser
References
Allegri, M., Silvana, M., Fabiana, S., Adriana, V., Maurizio, M, Christian, C., Marco, B., Maria,
E., and Guido, F. (2016). Mechanisms of low back pain: a guide for diagnosis and
therapy. Biotechnology Information, 2 (1), pp 1-19. DOI: 10.12688/f1000research.8105.2
Balagué, F., Mannion, A., Pellisé, F., and Cedraschi, C. (2012). Non-specific low back pain.
Pubmed, 379 (9814), pp. 482-91. DOI: 10.1016/S0140-6736(11)60610-7
Chou, R., Deyo, R., & Jarvik, J. (2012). Appropriate use of lumbar imaging for evaluation of low
back pain. Radiol Clin North Am, 50(4) pp.569–85. DOI:10.1016/j.rcl.2012.04.00
Drabiková, E., Fecková, E. (2017). Decision trees - a powerful tool in mathematical and
economic
modeling. International Carpathian Control Conference, 18(1). DOI:
10.1109/CarpathianCC.2017.7970367
Garland, E. (2012). Pain processing in the human nervous system: a selective review of
nociceptive
and biobehavioral pathways. Prim Care, 39(3) pp.561–71. DOI:
10.1016/j.pop.2012.06.013
Louppe, G. (2014). Understanding Random Forests: From Theory to Practice. Retrieved from:
https://arxiv.org/abs/1407.7502
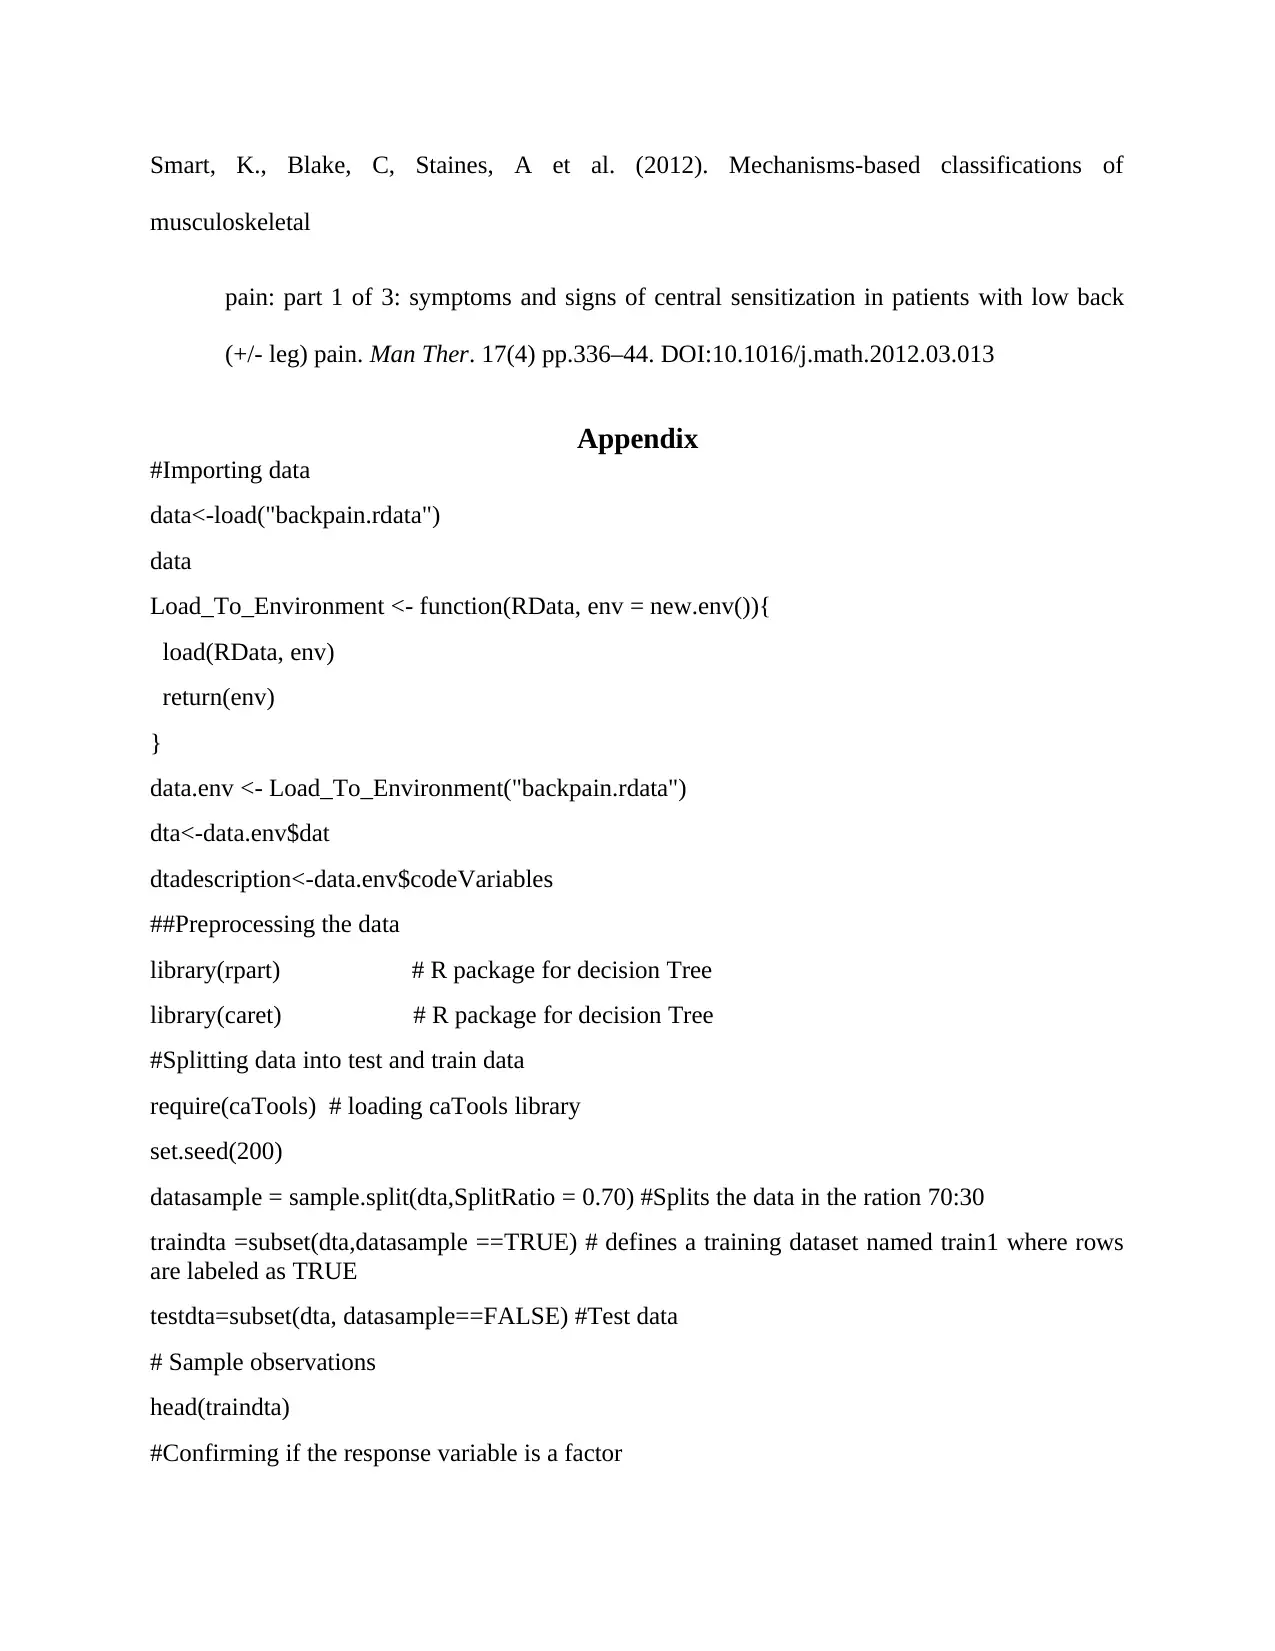
Smart, K., Blake, C, Staines, A et al. (2012). Mechanisms-based classifications of
musculoskeletal
pain: part 1 of 3: symptoms and signs of central sensitization in patients with low back
(+/- leg) pain. Man Ther. 17(4) pp.336–44. DOI:10.1016/j.math.2012.03.013
Appendix
#Importing data
data<-load("backpain.rdata")
data
Load_To_Environment <- function(RData, env = new.env()){
load(RData, env)
return(env)
}
data.env <- Load_To_Environment("backpain.rdata")
dta<-data.env$dat
dtadescription<-data.env$codeVariables
##Preprocessing the data
library(rpart) # R package for decision Tree
library(caret) # R package for decision Tree
#Splitting data into test and train data
require(caTools) # loading caTools library
set.seed(200)
datasample = sample.split(dta,SplitRatio = 0.70) #Splits the data in the ration 70:30
traindta =subset(dta,datasample ==TRUE) # defines a training dataset named train1 where rows
are labeled as TRUE
testdta=subset(dta, datasample==FALSE) #Test data
# Sample observations
head(traindta)
#Confirming if the response variable is a factor
⊘ This is a preview!⊘
Do you want full access?
Subscribe today to unlock all pages.
Trusted by 1+ million students worldwide
1 out of 14
Your All-in-One AI-Powered Toolkit for Academic Success.
+13062052269
info@desklib.com
Available 24*7 on WhatsApp / Email
![[object Object]](/_next/static/media/star-bottom.7253800d.svg)
Unlock your academic potential
Copyright © 2020–2026 A2Z Services. All Rights Reserved. Developed and managed by ZUCOL.