Machine Learning and Predictive Analytics on Business System Analysts
VerifiedAdded on 2022/08/24
|19
|4253
|14
Report
AI Summary
This report delves into the realm of machine learning and predictive analytics, evaluating their profound influence on business system analysts. It meticulously outlines the current trends in this field, highlighting how businesses are leveraging advanced analytics to gain insights and make data-driven decisions. The report identifies key challenges faced by system analysts, such as the need for reliable data and the integration of new technologies, as well as the opportunities presented by these advancements, including improved decision-making and proactive analysis. Furthermore, it explores the considerations and impacts of these trends, providing a comprehensive understanding of how business analysis practices are evolving. The report includes an abstract, research methodology, detailed trend descriptions, challenges, opportunities, considerations, impact analysis, and a conclusion, supported by references to industry research and reports from Gartner and KPMG.

Running head: MACHINE LEARNING AND PREDICTIVE ANALYTICS
Machine Learning and predictive Analytics on Business System Analysts
Student’s Name
Institution
Date
Machine Learning and predictive Analytics on Business System Analysts
Student’s Name
Institution
Date
Paraphrase This Document
Need a fresh take? Get an instant paraphrase of this document with our AI Paraphraser

MACHINE LEARNING AND PREDICTIVE ANALYTICS 2
Table of Contents
Abstract.......................................................................................................................................................3
Research Approach and Methodology.........................................................................................................3
Detailed description of the significant trend identified................................................................................3
Challenges...................................................................................................................................................6
Opportunity.................................................................................................................................................8
Considerations...........................................................................................................................................11
Impact of trend on business analysts.........................................................................................................12
Conclusion.................................................................................................................................................16
References.................................................................................................................................................18

MACHINE LEARNING AND PREDICTIVE ANALYTICS 3
Abstract
Machine learning and predictive analytics are very common in our lives today. It can
affect almost everything we do, including retail and wholesale pricing, consumer habits and
behavior, marketing, entertainment, medicine, logistics, gaming, AI speech recognition, AI
image recognition, self-driving cars and robots. There are many other things. However, being a
new mode of doing things, system analysts may experience some challenges. Understanding the
implication of predictive analytics on system analysts could help companies prepare
appropriately in order to embrace the concept of predictive analytics. The paper will explore the
issue of predictive analytics and its impacts on system data analysts.
Research Approach and Methodology
To achieve the goal of the paper, case studies and the findings from major research companies
such as Gartner and KPMG on how the companies are implementing machine learning and
predictive analytics would be reviewed. The paper would cover such aspects as the current trend
of the issue, the challenges, opportunities, and the impact of the trend on data analysts
Detailed description of the significant trend identified
Business analysis has evolved from static reports telling what happened to interactive
dashboards that help you dig deeper into data and try to understand why this happened. New
sources of big data, including the Internet of things devices, are pushing businesses to move from
passive analytics - when we look at a period in the past and look for trends, or check once a day
for problems - to active analytics that can warn of something in advance and allowing you to
create dashboards with real-time updates. This helps to make better use of operational data,
which is much more useful if it was received “just now”, while conditions have not changed yet.
Many companies are interested in such active analytics, which allows you to keep abreast of the
pulse of your business. But even dashboards show only what has already happened.
⊘ This is a preview!⊘
Do you want full access?
Subscribe today to unlock all pages.
Trusted by 1+ million students worldwide
MACHINE LEARNING AND PREDICTIVE ANALYTICS 4
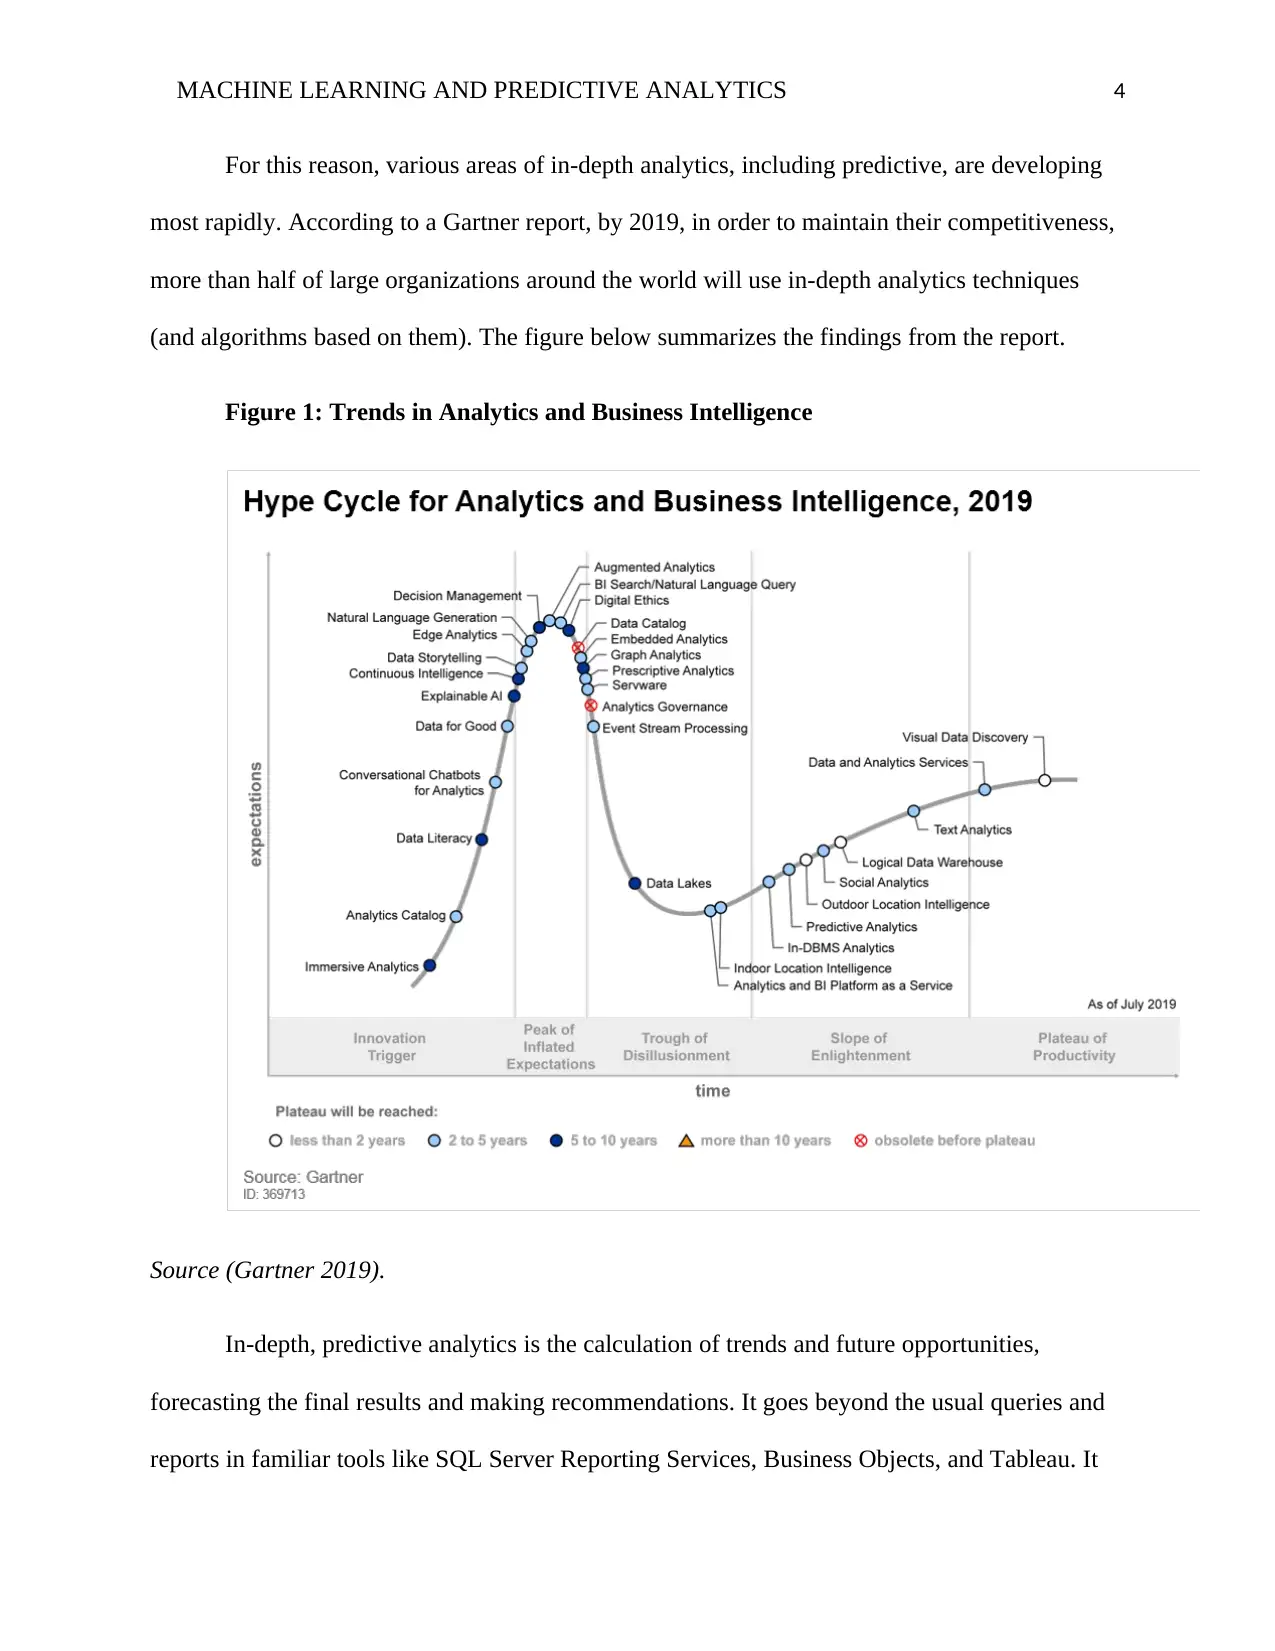
For this reason, various areas of in-depth analytics, including predictive, are developing
most rapidly. According to a Gartner report, by 2019, in order to maintain their competitiveness,
more than half of large organizations around the world will use in-depth analytics techniques
(and algorithms based on them). The figure below summarizes the findings from the report.
Figure 1: Trends in Analytics and Business Intelligence
Source (Gartner 2019).
In-depth, predictive analytics is the calculation of trends and future opportunities,
forecasting the final results and making recommendations. It goes beyond the usual queries and
reports in familiar tools like SQL Server Reporting Services, Business Objects, and Tableau. It
Paraphrase This Document
Need a fresh take? Get an instant paraphrase of this document with our AI Paraphraser
MACHINE LEARNING AND PREDICTIVE ANALYTICS 5
uses sophisticated statistical calculations, descriptive and predictive data mining, machine
learning, simulations and optimizations. And all this for the sake of searching for signs of likely
trends and patterns in the data, both structured and unstructured (Gartner 2019).
Similar tools are used today by marketers and analysts to understand the processes of
outflow of customers, customer life cycles, opportunities for cross-selling, customer preferences,
evaluating borrowers and identifying fraudsters. For example, many telecommunication
companies today are trying to switch from passive to active analytics, in order to determine
which subscribers want to switch to competitors based on user profiles and call history.
Companies of almost any market segment are interested in such tools (Cearley et al 2017).
In addition to predicting customer behavior, there are many other areas of application for
in-depth analytics. For example, the timely implementation of preventive maintenance, which
implies the search for anomalies in products and the operation of services. But one of the most
interesting areas is the creation of systems to support decision-making that answer the questions
“what can happen?” what am I supposed to do?" (Panetta, 2019).
The main difficulty for the business remains the same: how to extract from the
accumulated data some deep causal relationships or non-obvious information that allows you to
perform some actions or move the business forward.
The usual way to move from data to solution is to create a static report. For example, the
sales director wants to know how the company was trading in the last quarter in different
regions. And in order to make further decisions, it is necessary to perform a series of procedures
for compiling a report. But to make decisions, you need not only to know what happened in the
last quarter, but also why it happened. Let's say sales have fallen. Because the last three deals

MACHINE LEARNING AND PREDICTIVE ANALYTICS 6
have not burned out? Or because the average transaction volume has decreased? What do I need
to do with the available statistics to figure this out?
For example, in the Cortana Analytics dashboard, you can generate all kinds of reports
that reduce the number of manual data manipulations. Thanks to machine learning technologies,
the system can predict a decline in sales in advance, for example, in a month, and not report it in
fact. Also, automation of making recommendations and making decisions is widely used here
(Batra, 2014).
Such in-depth analytics systems that use machine learning technologies to predict and
support decision making should ideally inform you in advance not only of what might happen,
but also what you can do about it.
For example, the system has detected that your sales forecast for the next week will not
be fulfilled. At the same time, you have two marketing campaigns planned in CRM. Due to the
expected recession, you have the opportunity to launch stocks a week earlier in order to support
sales. You activate promotions in the system and start automated business processes so that all
necessary activities start a week earlier.
Such in-depth analytics systems can be used to answer questions like which of the clients
are most likely to leave you in the next quarter, and can also warn that a large client will be 90%
likely to leave to competitors within the next 30 days.
Challenges
Do CEOs trust predictive analytics? According to a KPMG report, most do not. More
than half of CEOs "are less confident in the accuracy of predictive analytics compared to
historical data," according to the report, Global CEO Outlook 2018. However, the opportunity to
⊘ This is a preview!⊘
Do you want full access?
Subscribe today to unlock all pages.
Trusted by 1+ million students worldwide

MACHINE LEARNING AND PREDICTIVE ANALYTICS 7
gain valuable business impact from business statistical analysis powered by Artificial
Intelligence (AI) as predictive analytics is more than great. McKinsey says three deep learning
techniques - feedback neural networks, recurring neural networks, and convolutional neural
networks - could allow for the creation of between $ 3.5 billion and $ 5.8 billion in value each
year.
Still, KPMG in their 2019 Global CEO Outlook report found that only 16% of CEOs said
they had already implemented AI to automate their processes; 31% are just testing the
technology; and 53% have started limited implementation.
Predictive analytics is "the use of data, statistical algorithms, and machine learning
techniques to identify the likelihood of future results based on historical data." However, CEOs
and, in particular, startups in general should be careful when using predictive analytics, because
they use historical data, so they cannot always explain changes in the behavior of buyers and
competitors (Batra, 2014).
Predictive analytics decisions start and end with data. Consider the quality of the data
collected, the methods for data collection and ask if the data has been skewed and you are
working with purged / cleaned data. These are all considerations for CEOs when they are based
on decision making with predictive analytics. Executives like CDOs and CIOs need to invest
time to ensure data is clean before management teams and CEOs begin to trust the
recommendations of systems based on predictive analytics.
Those considering implementing predictive analytics for their businesses should keep in
mind that a well-prepared prediction and well-performed predictive analytics program can be
Paraphrase This Document
Need a fresh take? Get an instant paraphrase of this document with our AI Paraphraser

MACHINE LEARNING AND PREDICTIVE ANALYTICS 8
trusted. So it's important to recognize when predictive analytics is performing poorly. Look for
these possible problems:
Selection of design personnel without relevant experience and knowledge.
Selection of inappropriate prediction tools and methods.
Incorrect selection of data, i.e. incorrectly selected time series (for example, too short, too
long, lack of seasonality, etc.)
Incorrect reasoning, especially in the context of evaluating the correlation between
variables
Opportunity
Proper business data management acquires added value as it enables companies from all
sectors to position themselves in the market thanks to predictive analysis, pushing companies to
transition from a reactive model to a proactive model. In this way, we can anticipate future
events or trends in our sector.
The predictive analysis feeds on historical data, which, with the aid of machine learning
(known as machine learning) and based on a learning algorithms, we reveal key information for
our business that we can make predictions about a target variables, determining drivers in our
KPIs, which will determine the decision making. In this way, the data becomes an asset that will
exponentially facilitate the profitability of our business (Panetta, 2019).
Although accuracy is the most common evaluation indicator for laymen, other evaluation
indicators are of concern to data scientists, domain experts, and business professionals. For
example, suppose a model needs to predict a rare disease that is present in 0.01% of the

MACHINE LEARNING AND PREDICTIVE ANALYTICS 9
population. If this model predicts that no one is sick, then the model's accuracy is 99.9%, but the
person who really has the disease cannot be identified (Phelan, 2018).
The F1 score is a comprehensive score that takes into account both recall and accuracy,
which are the two most commonly used indicators when evaluating the performance of a
classification model. F1 is a good measure of overall model performance, but should not be
considered alone. It is mainly used to check the range of performance indicators to really
understand how the model performs.
⊘ This is a preview!⊘
Do you want full access?
Subscribe today to unlock all pages.
Trusted by 1+ million students worldwide

MACHINE LEARNING AND PREDICTIVE ANALYTICS 10
Regression models predict actual numbers, such as prices, quantities, or
measurements. These are not categories and therefore cannot be evaluated with categorical
performance indicators such as accuracy and recall. We must use statistical analysis tools for
regression models.
The most popular regression evaluation metric is root mean square error (RMSE, also
known as standard error). We assume that a regression model predicts that the price of Amazon
stock will be 936.89, 939.16, 949.88, 960.34, 962.36 in the next 5 days, and the actual price is
939.79, 938.60, 950.87, 956.40, 961.35. The difference between the first predicted value and the
first actual value is 2.9. The difference between the second predicted value and the second actual
value is 0.56. Square each difference to ensure that negative numbers do not negatively affect the
metric. The difference is called the "error"; when it is squared, it is called the squared error. This
is an indicator of how close the forecast is to actual value. Then, all squared errors are added and
divided by the predicted total and then rooted. RMSE is a very good indicator of the performance
of regression models.
Improve model performance
If we are satisfied with the performance of the model, we can skip this step. But usually,
there is always room for improvement. Just like when we learn new skills in life, such as boxing
or playing the piano, there is always room for improvement in our performance.
Paraphrase This Document
Need a fresh take? Get an instant paraphrase of this document with our AI Paraphraser

MACHINE LEARNING AND PREDICTIVE ANALYTICS 11
If the performance of our model is poor, we will go back to the second stage, or even the
first stage. The terrible performance may be a model error, but when we really perform poorly,
more often it is the error in the data. Perhaps the data itself is of poor quality and no model can
speak. Or maybe the data is not cleaned properly because we need to go back to the original data
and re-examine how we cleaned the data. In this case, the data analyst is best to consult with
experts in the data field. If the data performs better than expected, the best approach may be to
stick to the current model and tune the model's hyperparameters. The hyperparameters of the
model are set before the model is trained on the data. Most models will contain multiple
hyperparameters, and each hyperparameter can be adjusted in multiple ways. In fact, for any
given model, there are usually hundreds to thousands of combinations of hyperparameters. For
some models, adjusting hyperparameters can have a significant impact on model performance
(Phelan, 2018).
Considerations
Today, companies are accumulating more and more data on the basis of which business
decisions can be made. And the next stage in the development of decision-making systems based
on available data are automated decision support systems. That is - intelligent electronic
assistants giving advice on maintaining and developing a business. But are we ready for this?
According to a recent studyconducted among 50,000 American manufacturing companies
from 2005 to 2010, the number of enterprises in which business decisions were made based on
data has tripled. True, this is only 30% of companies. And when in 2015, Colt
telecommunications provider conducted a survey among European IT company executives, then
71% said that intuition and personal experience in making decisions work better than data
analysis (although 76% said that their intuition did not always coincide with the received their

MACHINE LEARNING AND PREDICTIVE ANALYTICS 12
data). Avanade research, on the other handshowed that company executives generally plan to use
digital assistants and automated intelligent systems to solve problems, analyze data, collaborate
and make decisions. And they expect this to increase revenue by more than a third. Moreover,
54% of executives said they would be happy to work with such systems.
Pioneer companies that already use machine learning to manage customer service,
financial resources, risk and compliance, both in sales and marketing, and in emerging business
areas, have found “ significant, even exponential increases in benefits” in terms of costs, revenue
and consumer properties. These campaigns use what is known as perceptual intelligence — a
combination of speech and voice recognition, deep analytics, and business decision support.
According to the study, quick tracking of customer behavior, increasing their satisfaction
by speeding up and increasing the accuracy of call processing, can reduce costs by 70% and
achieve a 20-fold increase in revenue (Jain & Laney 2018).
The involvement of business users in their construction will also facilitate the
implementation of such systems. The demand for specialists in the field of data analysis exceeds
the supply, which means that companies that do not have their own serious developments will
turn to third-party analytical services. And experienced users (referred to in Gartner as “citizen
data scientists”) will take over these tools and create their own deep analytics systems (Borra &
Rieder, 2014).
Impact of trend on business analysts
The first impact of trend on business analysts relates how data is collected. The data
collection process can be easy or difficult. When the data is stored in a location (such as a
relational database), the process of extracting the data is very simple and can be completed
within a few hours, but the reality is often not so simple. Typically, data is distributed across
⊘ This is a preview!⊘
Do you want full access?
Subscribe today to unlock all pages.
Trusted by 1+ million students worldwide
1 out of 19
Related Documents


Your All-in-One AI-Powered Toolkit for Academic Success.
+13062052269
info@desklib.com
Available 24*7 on WhatsApp / Email
![[object Object]](/_next/static/media/star-bottom.7253800d.svg)
Unlock your academic potential
Copyright © 2020–2026 A2Z Services. All Rights Reserved. Developed and managed by ZUCOL.