Downtime Analysis and Criticality Ranking of Industrial Machinery

Verified

Added on  2022/10/04

|4
|1005
|61
Report
AI Summary
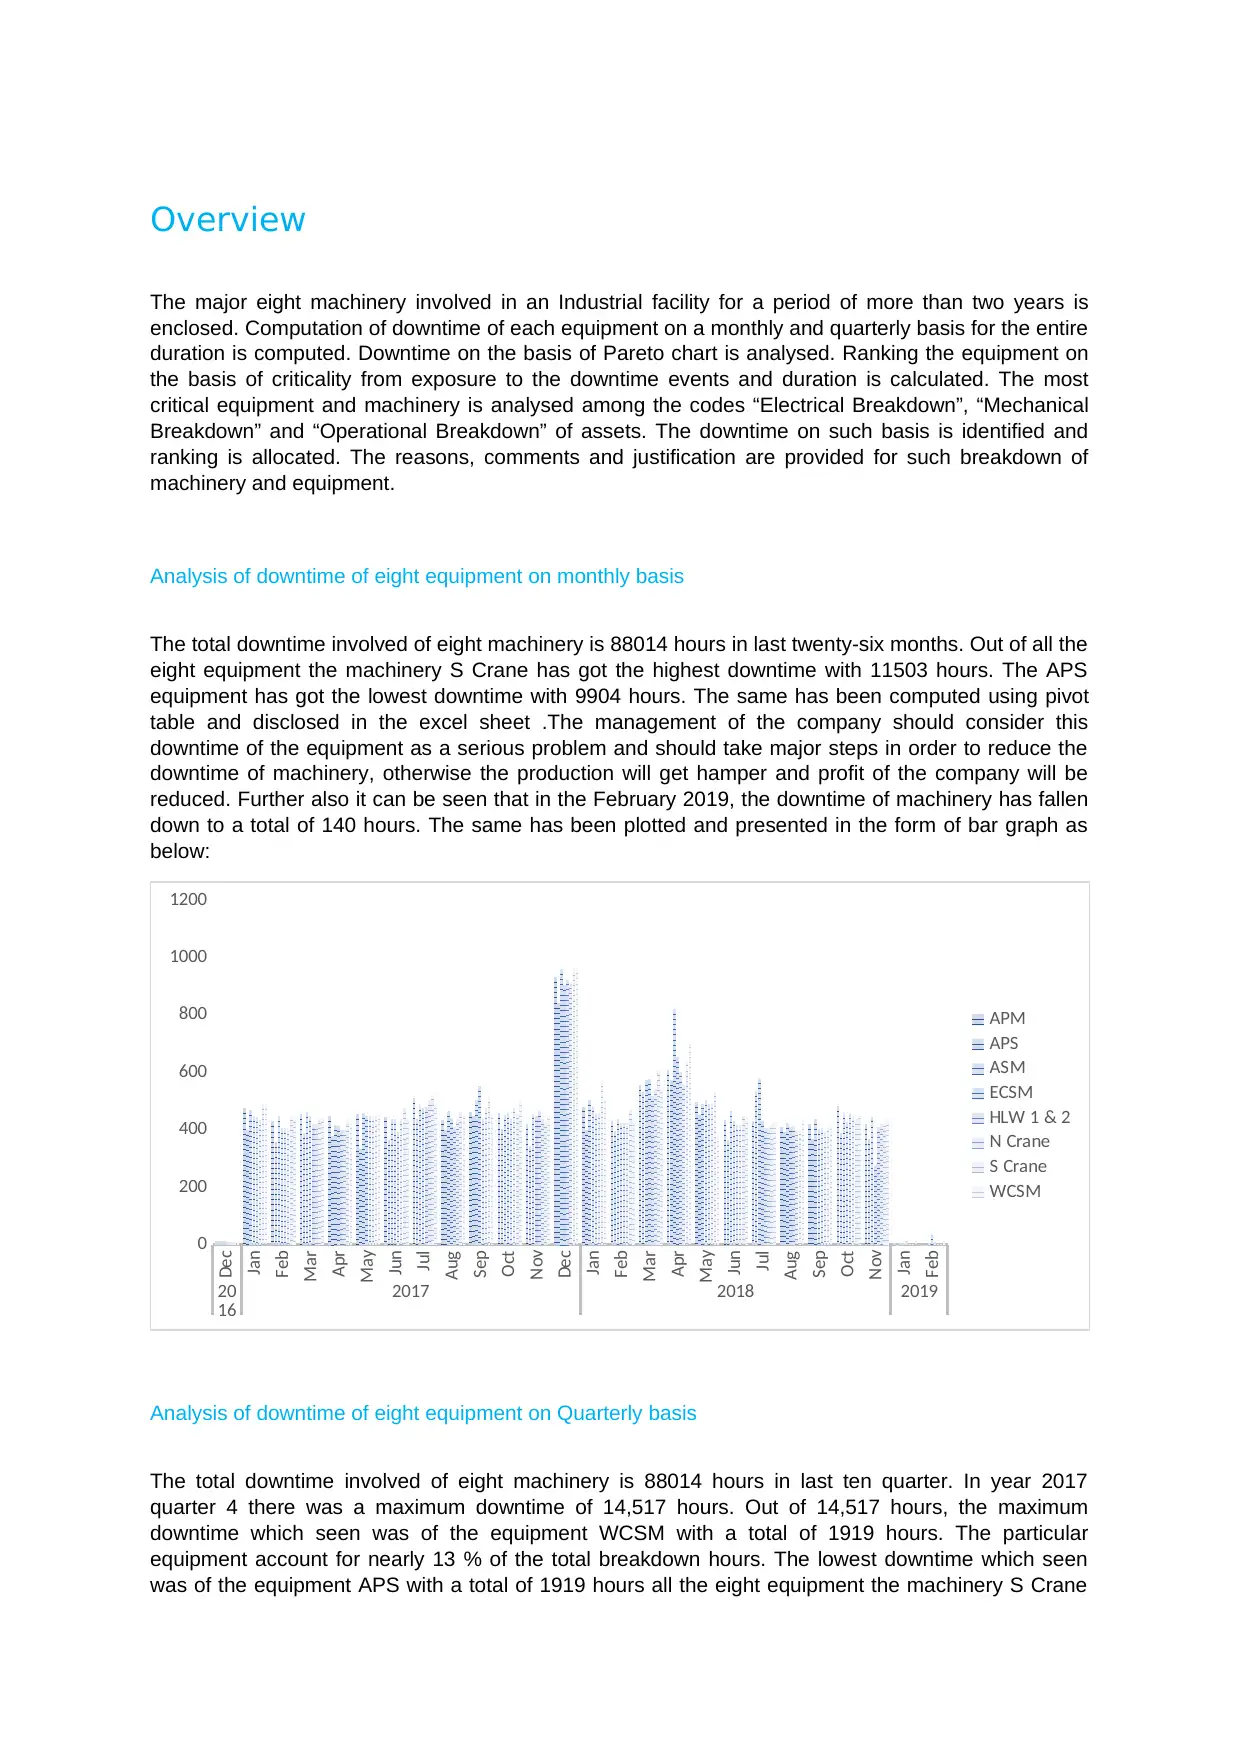
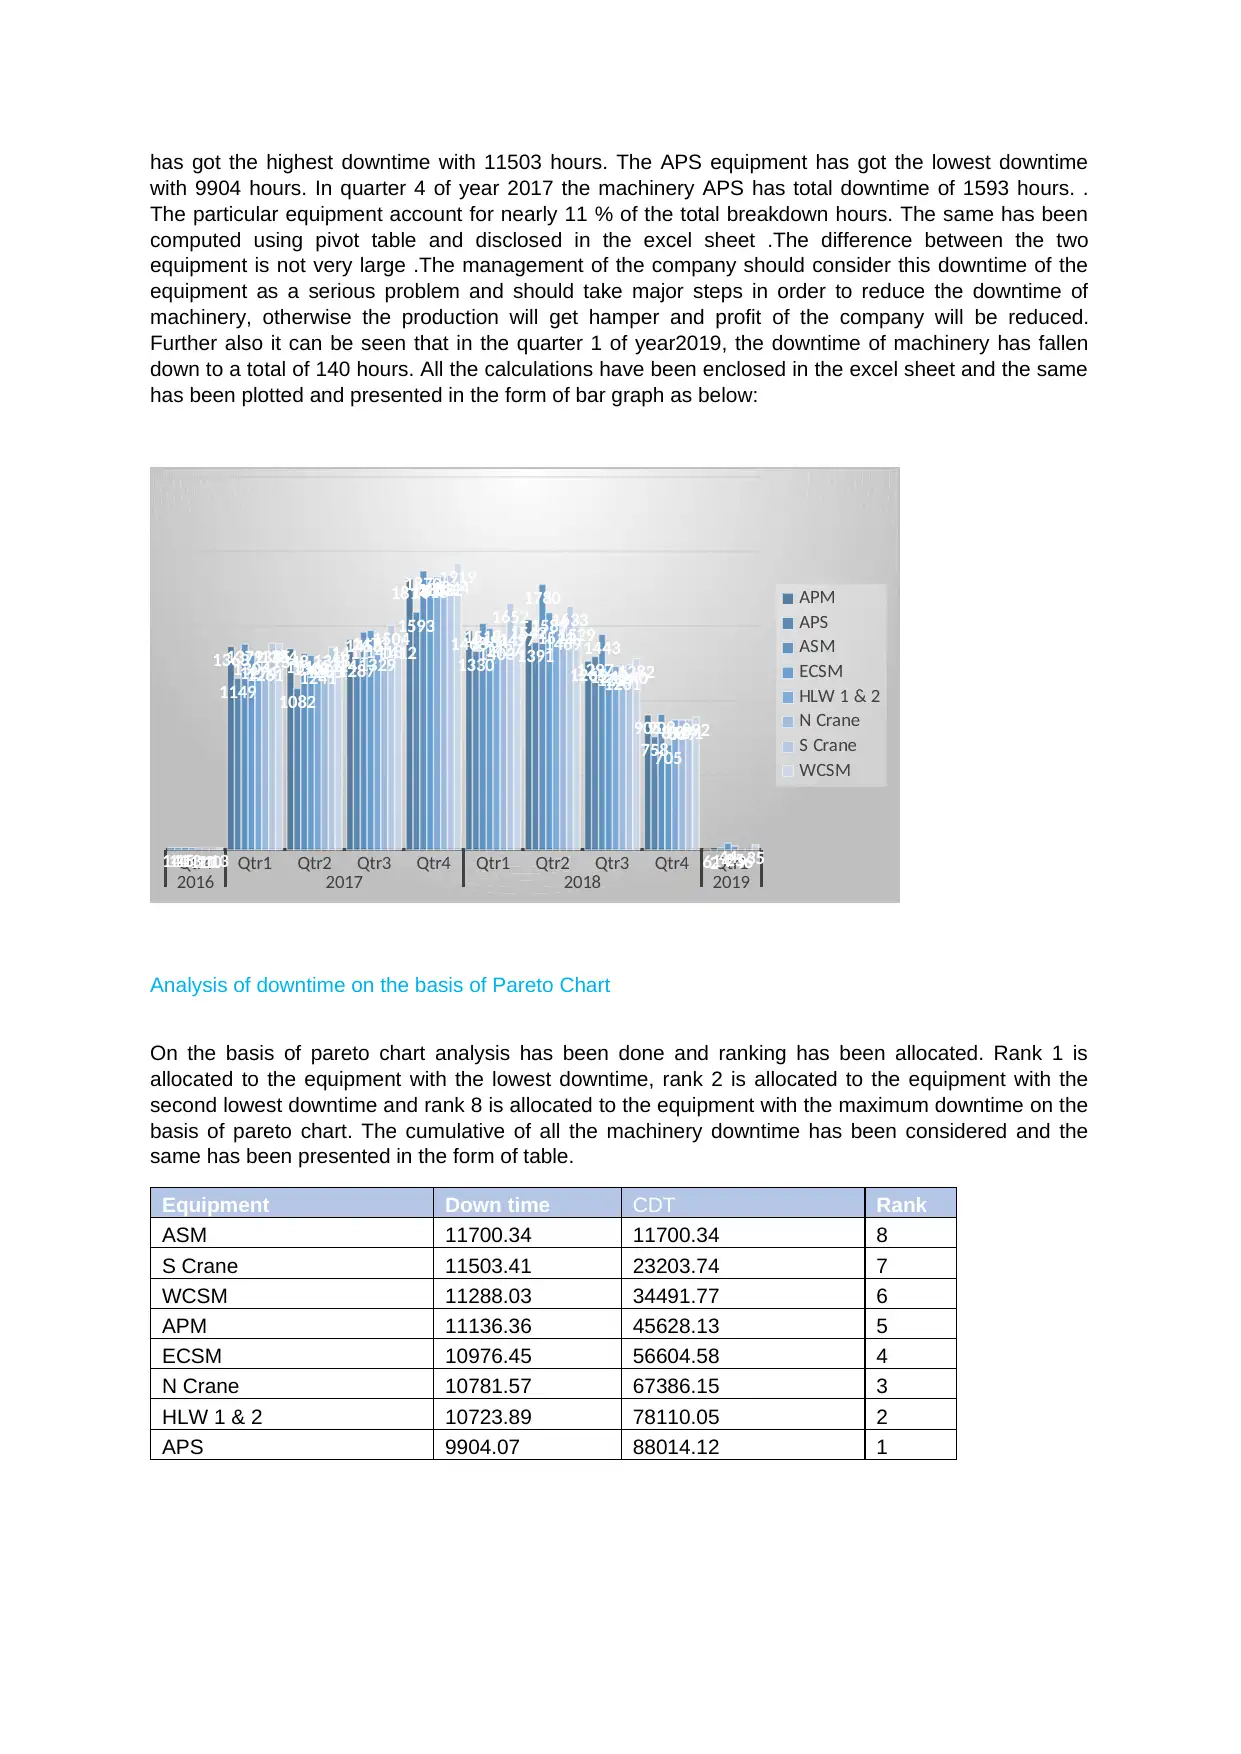
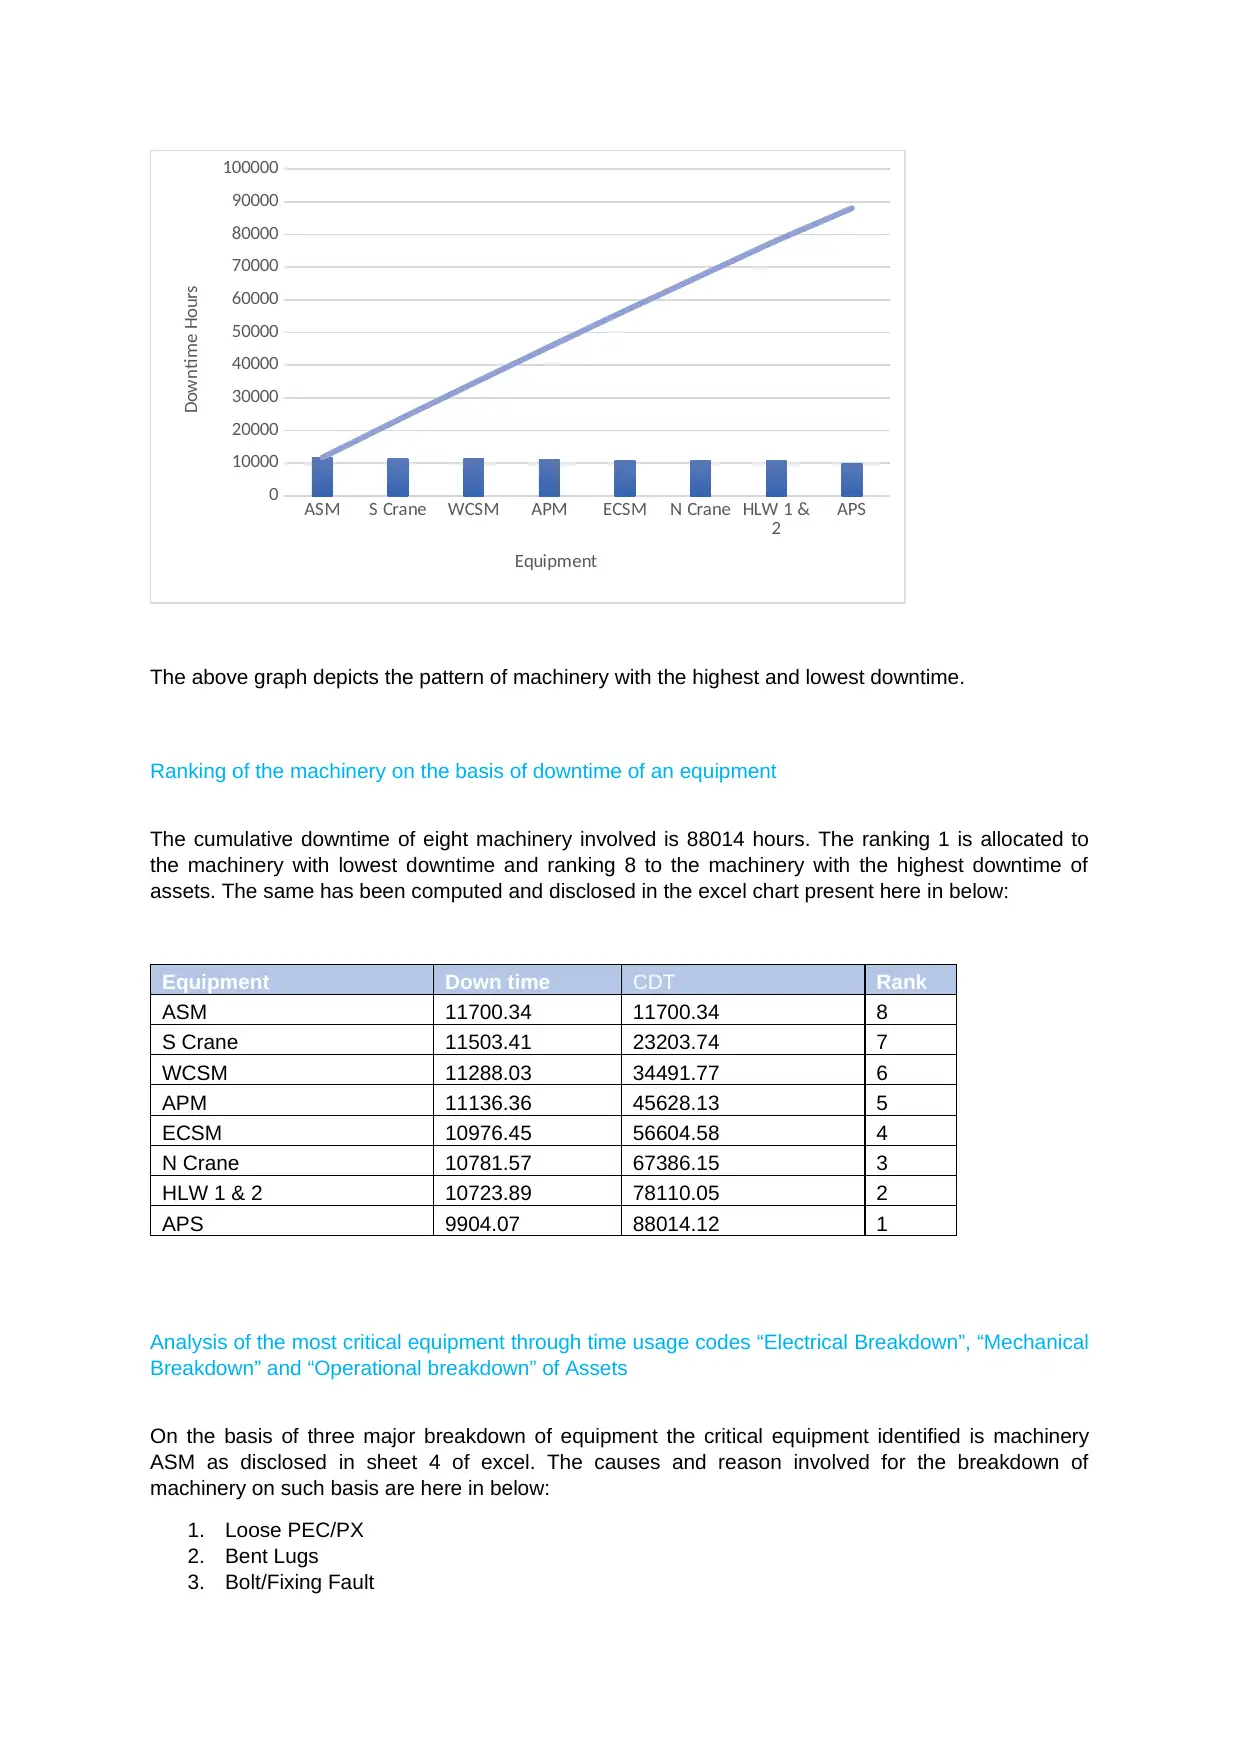
This report analyzes the downtime of eight major machinery in an industrial facility over a period exceeding two years. It computes downtime on a monthly and quarterly basis, identifying the equipment with the highest and lowest downtime. Pareto charts are generated to analyze downtime events and durations. The equipment is ranked based on criticality, considering downtime events and durations. The report also analyzes the most critical equipment by examining the causes of downtime, categorized as "Electrical Breakdown," "Mechanical Breakdown," and "Operational Breakdown," providing reasons and justifications for the breakdowns. The analysis includes detailed data from pivot tables and bar graphs, highlighting trends and critical areas for improvement to reduce production downtime and maintain profitability. The report concludes with recommendations for management to address the identified issues.
Document Page
Overview
The major eight machinery involved in an Industrial facility for a period of more than two years is
enclosed. Computation of downtime of each equipment on a monthly and quarterly basis for the entire
duration is computed. Downtime on the basis of Pareto chart is analysed. Ranking the equipment on
the basis of criticality from exposure to the downtime events and duration is calculated. The most
critical equipment and machinery is analysed among the codes “Electrical Breakdown”, “Mechanical
Breakdown” and “Operational Breakdown” of assets. The downtime on such basis is identified and
ranking is allocated. The reasons, comments and justification are provided for such breakdown of
machinery and equipment.
Analysis of downtime of eight equipment on monthly basis
The total downtime involved of eight machinery is 88014 hours in last twenty-six months. Out of all the
eight equipment the machinery S Crane has got the highest downtime with 11503 hours. The APS
equipment has got the lowest downtime with 9904 hours. The same has been computed using pivot
table and disclosed in the excel sheet .The management of the company should consider this
downtime of the equipment as a serious problem and should take major steps in order to reduce the
downtime of machinery, otherwise the production will get hamper and profit of the company will be
reduced. Further also it can be seen that in the February 2019, the downtime of machinery has fallen
down to a total of 140 hours. The same has been plotted and presented in the form of bar graph as
below:
Dec
Jan
Feb
Mar
Apr
May
Jun
Jul
Aug
Sep
Oct
Nov
Dec
Jan
Feb
Mar
Apr
May
Jun
Jul
Aug
Sep
Oct
Nov
Jan
Feb
20
16 2017 2018 2019
0
200
400
600
800
1000
1200
APM
APS
ASM
ECSM
HLW 1 & 2
N Crane
S Crane
WCSM
Analysis of downtime of eight equipment on Quarterly basis
The total downtime involved of eight machinery is 88014 hours in last ten quarter. In year 2017
quarter 4 there was a maximum downtime of 14,517 hours. Out of 14,517 hours, the maximum
downtime which seen was of the equipment WCSM with a total of 1919 hours. The particular
equipment account for nearly 13 % of the total breakdown hours. The lowest downtime which seen
was of the equipment APS with a total of 1919 hours all the eight equipment the machinery S Crane
tabler-icon-diamond-filled.svg

Paraphrase This Document

Need a fresh take? Get an instant paraphrase of this document with our AI Paraphraser
Document Page
has got the highest downtime with 11503 hours. The APS equipment has got the lowest downtime
with 9904 hours. In quarter 4 of year 2017 the machinery APS has total downtime of 1593 hours. .
The particular equipment account for nearly 11 % of the total breakdown hours. The same has been
computed using pivot table and disclosed in the excel sheet .The difference between the two
equipment is not very large .The management of the company should consider this downtime of the
equipment as a serious problem and should take major steps in order to reduce the downtime of
machinery, otherwise the production will get hamper and profit of the company will be reduced.
Further also it can be seen that in the quarter 1 of year2019, the downtime of machinery has fallen
down to a total of 140 hours. All the calculations have been enclosed in the excel sheet and the same
has been plotted and presented in the form of bar graph as below:
Qtr4 Qtr1 Qtr2 Qtr3 Qtr4 Qtr1 Qtr2 Qtr3 Qtr4 Qtr1
2016 2017 2018 2019
14
1363 1348 1411
1814
1468 1542
1265
905
614
1149 1082
1287
1593
1330 1391 1297
758
215
1379 1316
1458
1870
1518
1780
1443
908
1413
1304 1303
1471
1815
1484 1589
1248
705
4411
1274 1241 1329
1830
1403 1511
1229
872
2511
1261 1285
1418
1832
1427 1469
1201
869
910
1385 1358
1504
1844
1652 1633
1240
871
613
1384 1324 1412
1919
1497 1529
1282
892
35
APM
APS
ASM
ECSM
HLW 1 & 2
N Crane
S Crane
WCSM
Analysis of downtime on the basis of Pareto Chart
On the basis of pareto chart analysis has been done and ranking has been allocated. Rank 1 is
allocated to the equipment with the lowest downtime, rank 2 is allocated to the equipment with the
second lowest downtime and rank 8 is allocated to the equipment with the maximum downtime on the
basis of pareto chart. The cumulative of all the machinery downtime has been considered and the
same has been presented in the form of table.
Equipment Down time CDT Rank
ASM 11700.34 11700.34 8
S Crane 11503.41 23203.74 7
WCSM 11288.03 34491.77 6
APM 11136.36 45628.13 5
ECSM 10976.45 56604.58 4
N Crane 10781.57 67386.15 3
HLW 1 & 2 10723.89 78110.05 2
APS 9904.07 88014.12 1
Document Page
ASM S Crane WCSM APM ECSM N Crane HLW 1 &
2 APS
0
10000
20000
30000
40000
50000
60000
70000
80000
90000
100000
Equipment
Downtime Hours
The above graph depicts the pattern of machinery with the highest and lowest downtime.
Ranking of the machinery on the basis of downtime of an equipment
The cumulative downtime of eight machinery involved is 88014 hours. The ranking 1 is allocated to
the machinery with lowest downtime and ranking 8 to the machinery with the highest downtime of
assets. The same has been computed and disclosed in the excel chart present here in below:
Equipment Down time CDT Rank
ASM 11700.34 11700.34 8
S Crane 11503.41 23203.74 7
WCSM 11288.03 34491.77 6
APM 11136.36 45628.13 5
ECSM 10976.45 56604.58 4
N Crane 10781.57 67386.15 3
HLW 1 & 2 10723.89 78110.05 2
APS 9904.07 88014.12 1
Analysis of the most critical equipment through time usage codes “Electrical Breakdown”, “Mechanical
Breakdown” and “Operational breakdown” of Assets
On the basis of three major breakdown of equipment the critical equipment identified is machinery
ASM as disclosed in sheet 4 of excel. The causes and reason involved for the breakdown of
machinery on such basis are here in below:
1. Loose PEC/PX
2. Bent Lugs
3. Bolt/Fixing Fault
Document Page
4. Broken Bridge of the equipment
5. Chain/Conveyor/Link failure
6. Check sheet
7. Communications/Programming Fault
8. Component Damage
9. Conveyor Tension or alignment fault
10. Electrical Drive Fault
11. Fallen Product
12. Heavy scrap
13. Hydraulic Cylindrical fault
14. Hydraulic System Fault
15. Hydraulic hose leak
16. Machine Isolated
17. Machine Fault
18. Position Fault
19. ‘Over run Fault
20. Product misalignment
21. Pull Chord Fault
22. Safety Relay
23. Turntable fault
24. Utilities Fault
25. Weld Repair
The above may be the reasons for the breakdown of the machinery. The management of the
company should take a note of it so that the same problem does not repeat in the near future in any
situation. As this particular situation increases the idle time of the machinery and stop the production
flow which leads to decrease in the profit of the company.
chevron_up_icon
1 out of 4
circle_padding
hide_on_mobile
zoom_out_icon
[object Object]