Report: Analysis of Downtime for Industrial Machinery Over 2 Years

Verified

Added on  2022/10/17

|5
|1126
|351
Report
AI Summary
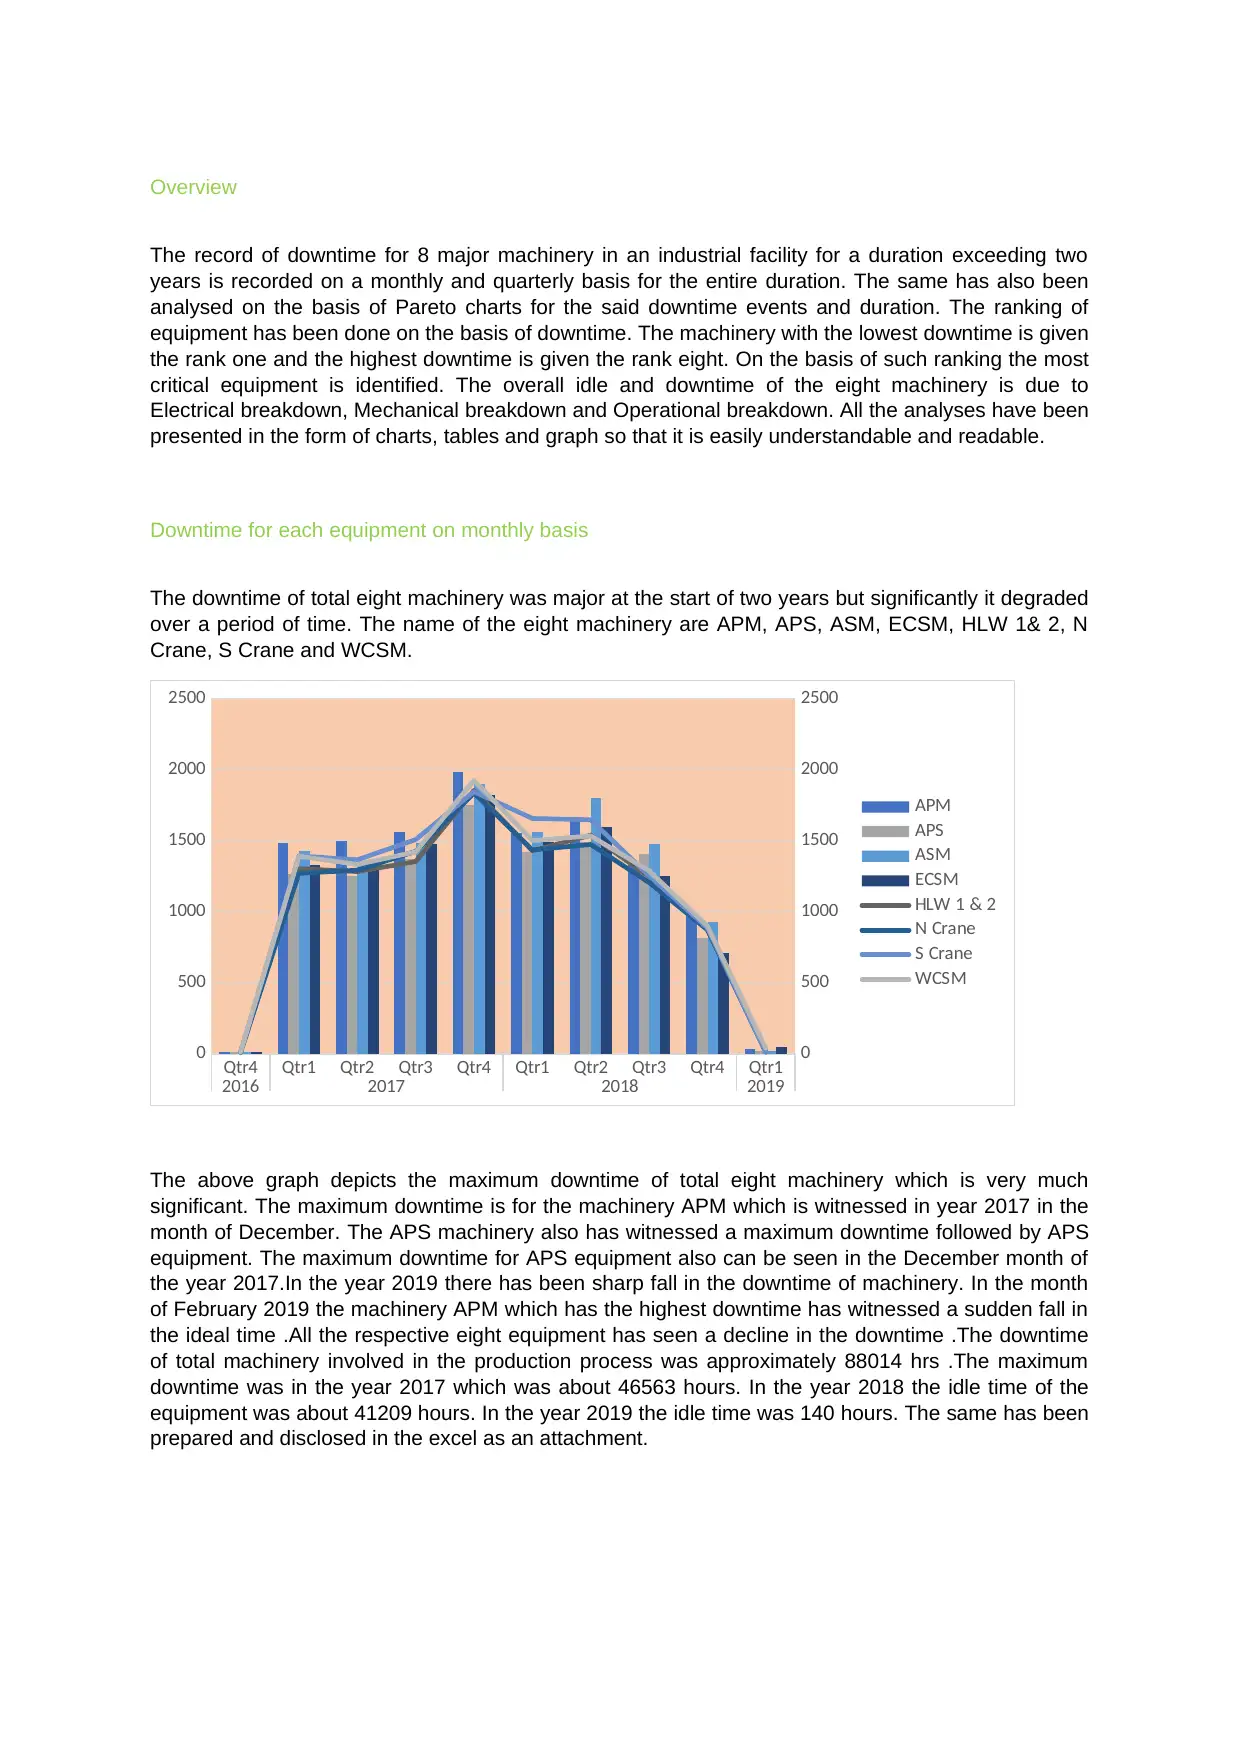
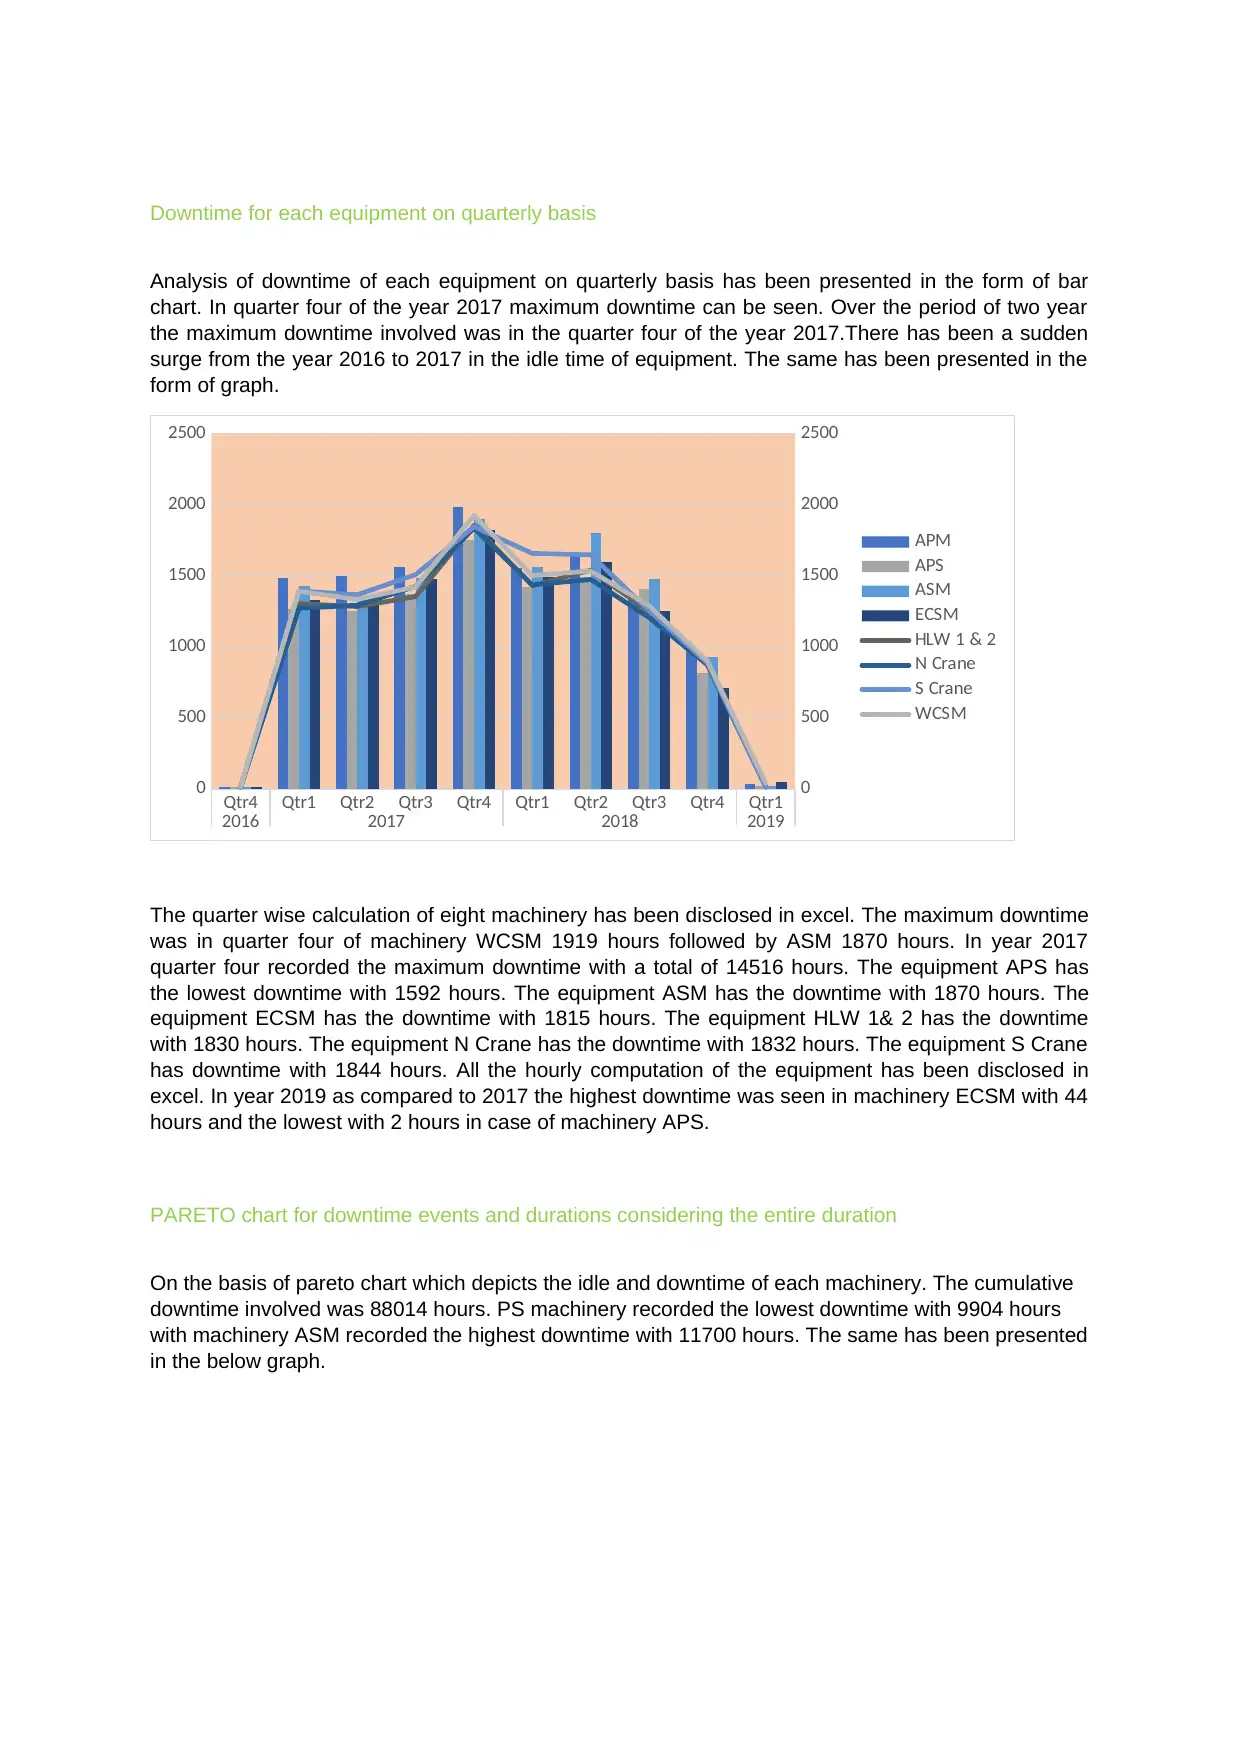
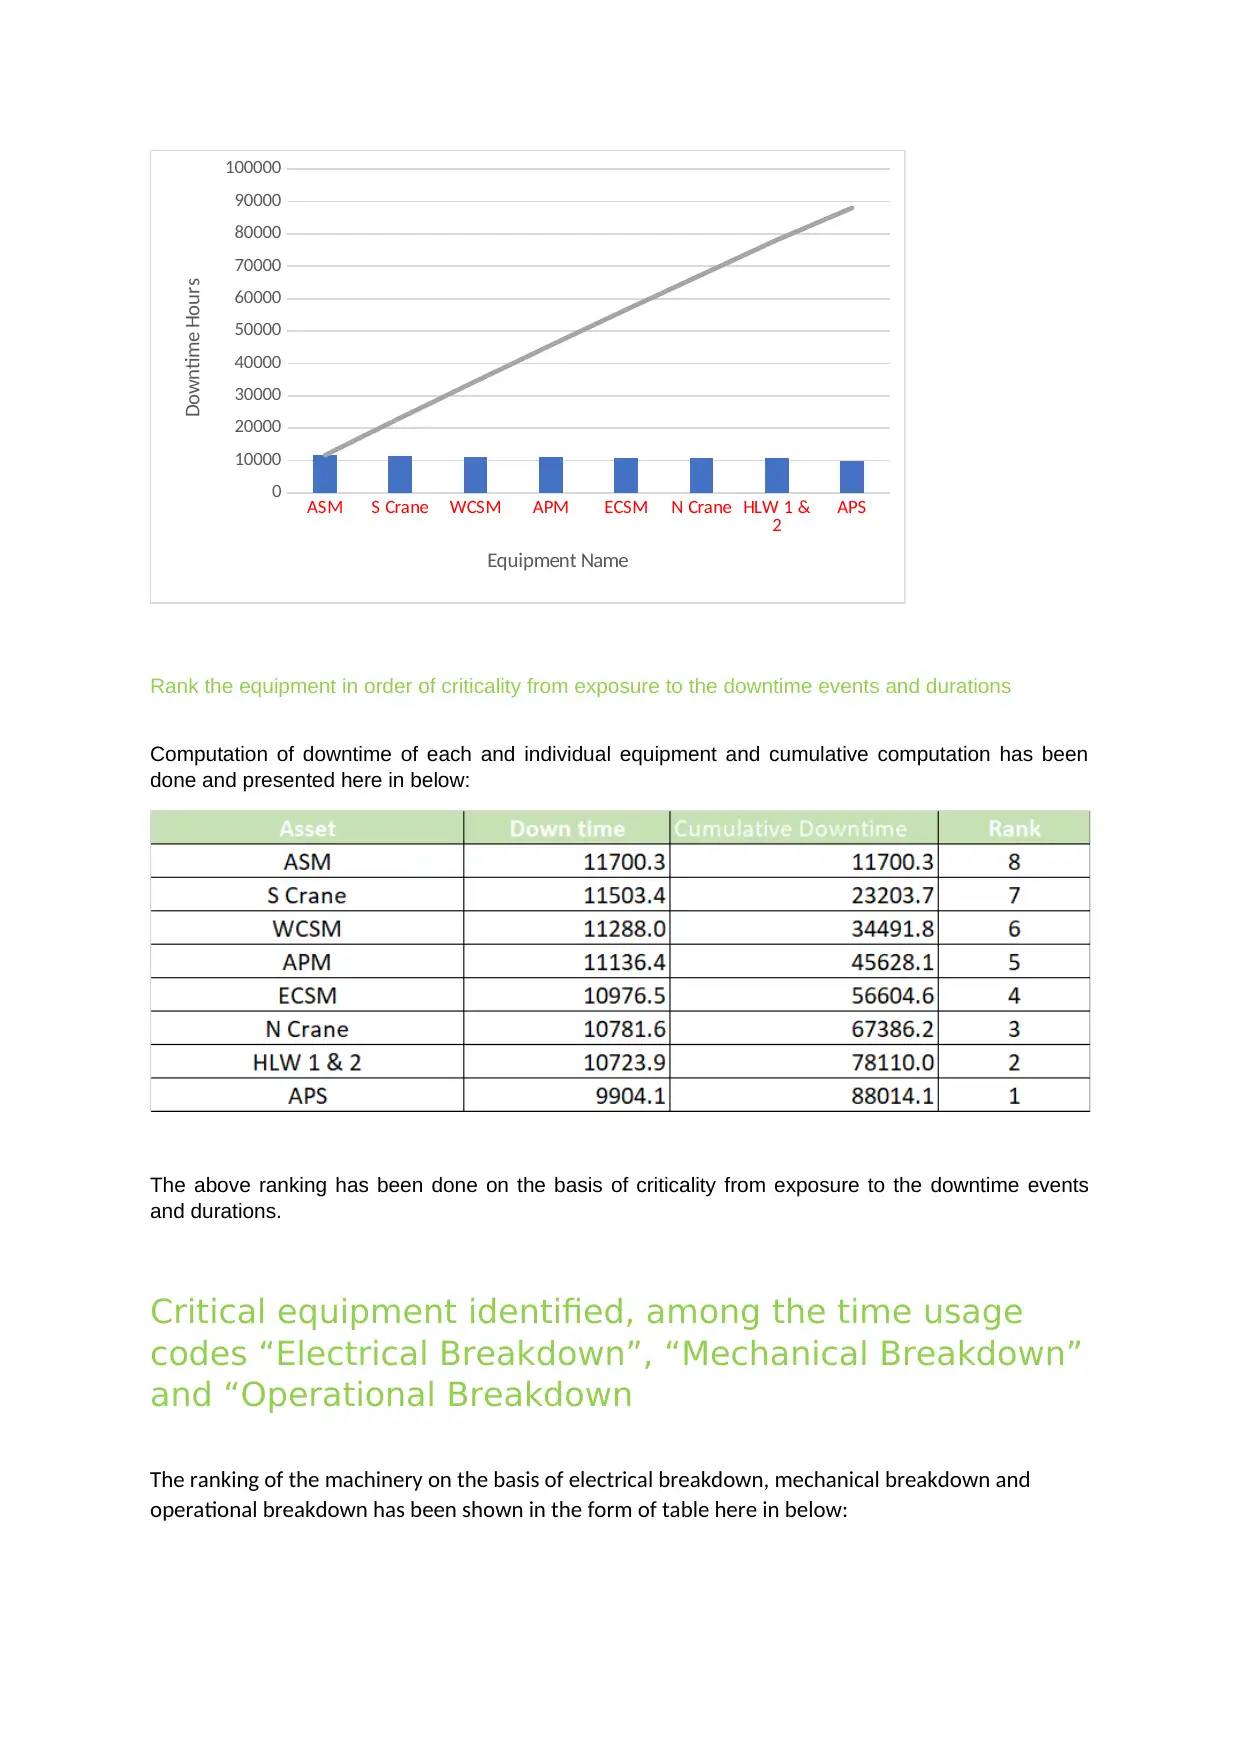
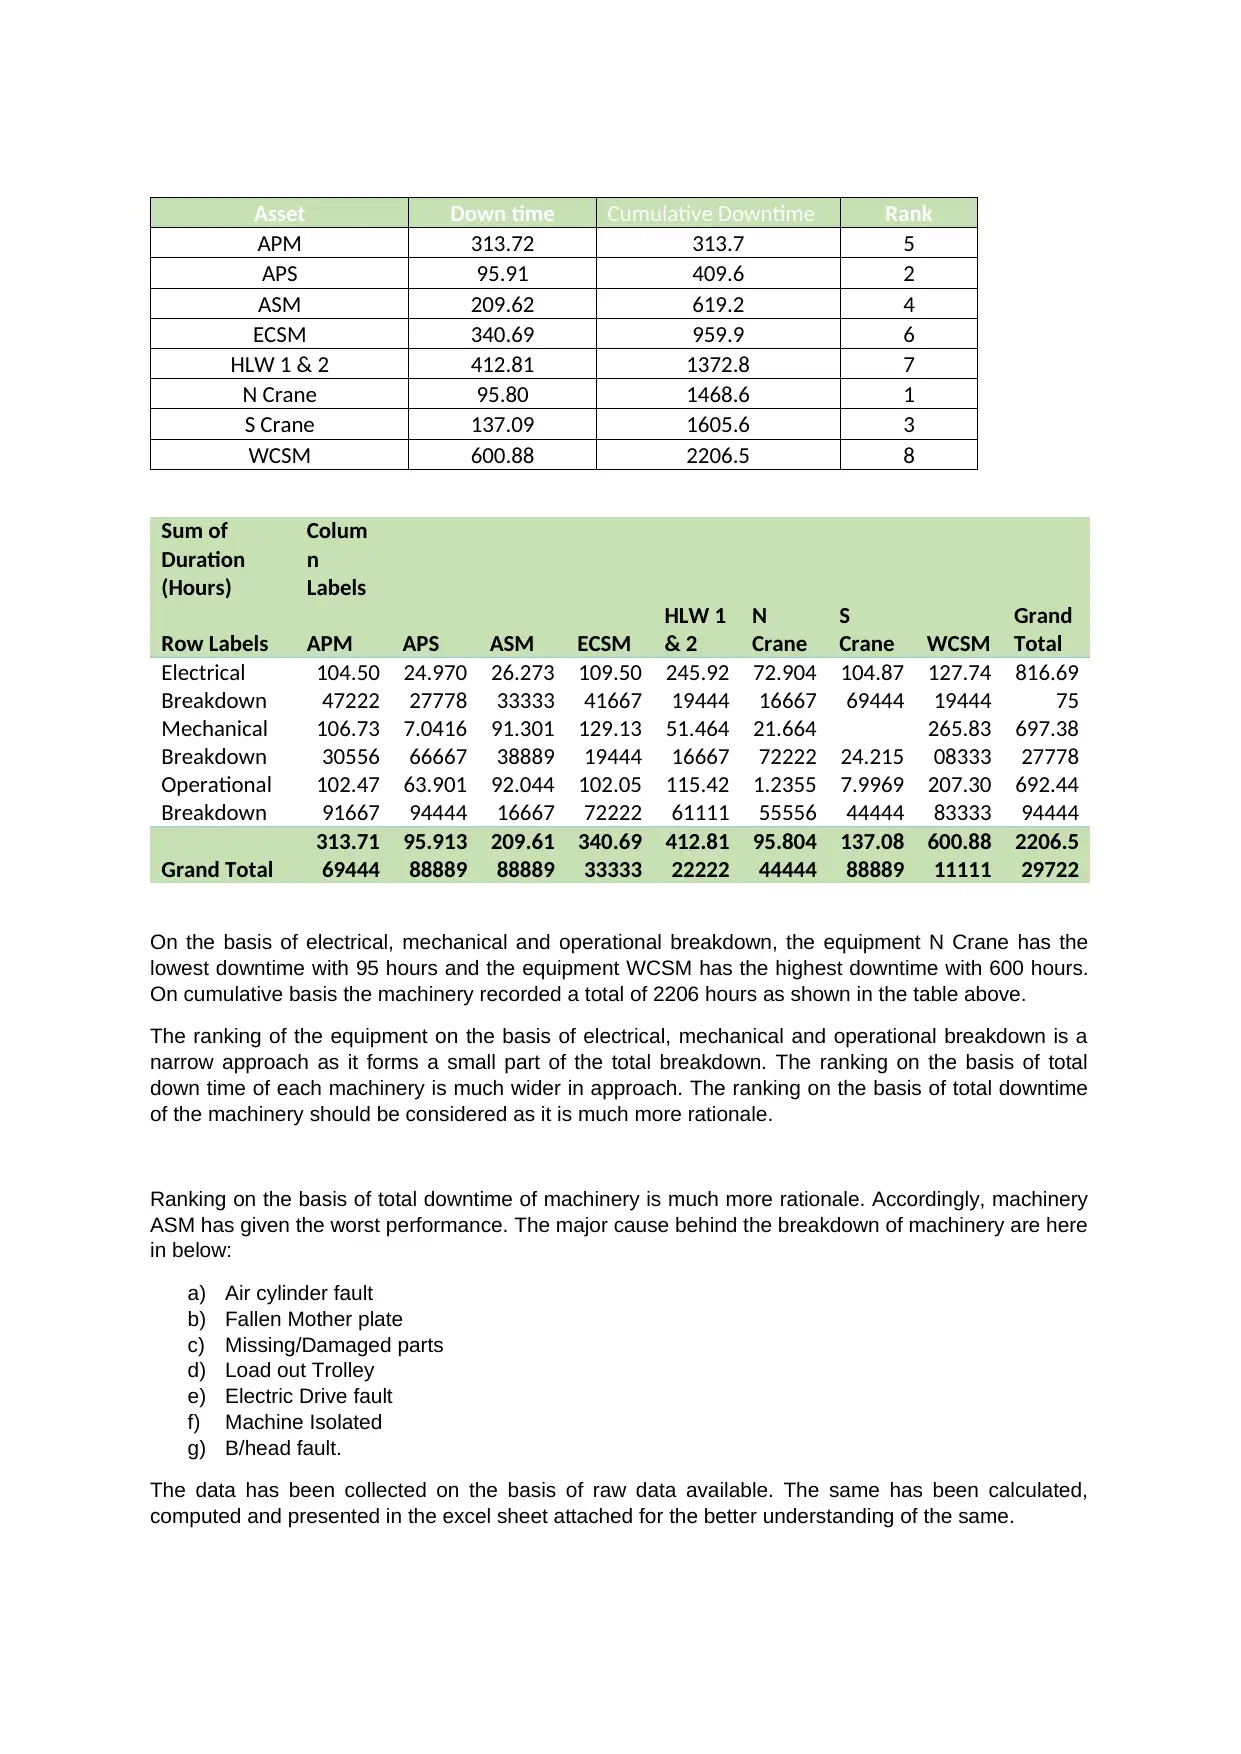
This report presents a detailed analysis of downtime for eight major machinery within an industrial facility, spanning over two years. The analysis includes monthly and quarterly downtime trends, visualized through charts and graphs, highlighting peak downtime periods and equipment performance variations. Pareto charts are utilized to analyze downtime events and durations, aiding in the identification of critical equipment. The machinery is ranked based on downtime exposure, with justifications provided for the ranking methodology. Furthermore, the report investigates the causes of downtime for the most critical equipment, categorizing them into electrical, mechanical, and operational breakdowns, and analyzing underlying reasons and comments. The findings are presented in a professional report format, supported by data, tables, and plots, providing a comprehensive overview of the equipment's performance and potential areas for improvement. The report also includes an excel file with all the data and calculations.
Document Page
Overview
The record of downtime for 8 major machinery in an industrial facility for a duration exceeding two
years is recorded on a monthly and quarterly basis for the entire duration. The same has also been
analysed on the basis of Pareto charts for the said downtime events and duration. The ranking of
equipment has been done on the basis of downtime. The machinery with the lowest downtime is given
the rank one and the highest downtime is given the rank eight. On the basis of such ranking the most
critical equipment is identified. The overall idle and downtime of the eight machinery is due to
Electrical breakdown, Mechanical breakdown and Operational breakdown. All the analyses have been
presented in the form of charts, tables and graph so that it is easily understandable and readable.
Downtime for each equipment on monthly basis
The downtime of total eight machinery was major at the start of two years but significantly it degraded
over a period of time. The name of the eight machinery are APM, APS, ASM, ECSM, HLW 1& 2, N
Crane, S Crane and WCSM.
Qtr4 Qtr1 Qtr2 Qtr3 Qtr4 Qtr1 Qtr2 Qtr3 Qtr4 Qtr1
2016 2017 2018 2019
0
500
1000
1500
2000
2500
0
500
1000
1500
2000
2500
APM
APS
ASM
ECSM
HLW 1 & 2
N Crane
S Crane
WCSM
The above graph depicts the maximum downtime of total eight machinery which is very much
significant. The maximum downtime is for the machinery APM which is witnessed in year 2017 in the
month of December. The APS machinery also has witnessed a maximum downtime followed by APS
equipment. The maximum downtime for APS equipment also can be seen in the December month of
the year 2017.In the year 2019 there has been sharp fall in the downtime of machinery. In the month
of February 2019 the machinery APM which has the highest downtime has witnessed a sudden fall in
the ideal time .All the respective eight equipment has seen a decline in the downtime .The downtime
of total machinery involved in the production process was approximately 88014 hrs .The maximum
downtime was in the year 2017 which was about 46563 hours. In the year 2018 the idle time of the
equipment was about 41209 hours. In the year 2019 the idle time was 140 hours. The same has been
prepared and disclosed in the excel as an attachment.
tabler-icon-diamond-filled.svg

Paraphrase This Document

Need a fresh take? Get an instant paraphrase of this document with our AI Paraphraser
Document Page
Downtime for each equipment on quarterly basis
Analysis of downtime of each equipment on quarterly basis has been presented in the form of bar
chart. In quarter four of the year 2017 maximum downtime can be seen. Over the period of two year
the maximum downtime involved was in the quarter four of the year 2017.There has been a sudden
surge from the year 2016 to 2017 in the idle time of equipment. The same has been presented in the
form of graph.
Qtr4 Qtr1 Qtr2 Qtr3 Qtr4 Qtr1 Qtr2 Qtr3 Qtr4 Qtr1
2016 2017 2018 2019
0
500
1000
1500
2000
2500
0
500
1000
1500
2000
2500
APM
APS
ASM
ECSM
HLW 1 & 2
N Crane
S Crane
WCSM
The quarter wise calculation of eight machinery has been disclosed in excel. The maximum downtime
was in quarter four of machinery WCSM 1919 hours followed by ASM 1870 hours. In year 2017
quarter four recorded the maximum downtime with a total of 14516 hours. The equipment APS has
the lowest downtime with 1592 hours. The equipment ASM has the downtime with 1870 hours. The
equipment ECSM has the downtime with 1815 hours. The equipment HLW 1& 2 has the downtime
with 1830 hours. The equipment N Crane has the downtime with 1832 hours. The equipment S Crane
has downtime with 1844 hours. All the hourly computation of the equipment has been disclosed in
excel. In year 2019 as compared to 2017 the highest downtime was seen in machinery ECSM with 44
hours and the lowest with 2 hours in case of machinery APS.
PARETO chart for downtime events and durations considering the entire duration
On the basis of pareto chart which depicts the idle and downtime of each machinery. The cumulative
downtime involved was 88014 hours. PS machinery recorded the lowest downtime with 9904 hours
with machinery ASM recorded the highest downtime with 11700 hours. The same has been presented
in the below graph.
Document Page
ASM S Crane WCSM APM ECSM N Crane HLW 1 &
2 APS
0
10000
20000
30000
40000
50000
60000
70000
80000
90000
100000
Equipment Name
Downtime Hours
Rank the equipment in order of criticality from exposure to the downtime events and durations
Computation of downtime of each and individual equipment and cumulative computation has been
done and presented here in below:
The above ranking has been done on the basis of criticality from exposure to the downtime events
and durations.
Critical equipment identified, among the time usage
codes “Electrical Breakdown”, “Mechanical Breakdown”
and “Operational Breakdown
The ranking of the machinery on the basis of electrical breakdown, mechanical breakdown and
operational breakdown has been shown in the form of table here in below:
Document Page
Asset Down time Cumulative Downtime Rank
APM 313.72 313.7 5
APS 95.91 409.6 2
ASM 209.62 619.2 4
ECSM 340.69 959.9 6
HLW 1 & 2 412.81 1372.8 7
N Crane 95.80 1468.6 1
S Crane 137.09 1605.6 3
WCSM 600.88 2206.5 8
Sum of
Duration
(Hours)
Colum
n
Labels
Row Labels APM APS ASM ECSM
HLW 1
& 2
N
Crane
S
Crane WCSM
Grand
Total
Electrical
Breakdown
104.50
47222
24.970
27778
26.273
33333
109.50
41667
245.92
19444
72.904
16667
104.87
69444
127.74
19444
816.69
75
Mechanical
Breakdown
106.73
30556
7.0416
66667
91.301
38889
129.13
19444
51.464
16667
21.664
72222 24.215
265.83
08333
697.38
27778
Operational
Breakdown
102.47
91667
63.901
94444
92.044
16667
102.05
72222
115.42
61111
1.2355
55556
7.9969
44444
207.30
83333
692.44
94444
Grand Total
313.71
69444
95.913
88889
209.61
88889
340.69
33333
412.81
22222
95.804
44444
137.08
88889
600.88
11111
2206.5
29722
On the basis of electrical, mechanical and operational breakdown, the equipment N Crane has the
lowest downtime with 95 hours and the equipment WCSM has the highest downtime with 600 hours.
On cumulative basis the machinery recorded a total of 2206 hours as shown in the table above.
The ranking of the equipment on the basis of electrical, mechanical and operational breakdown is a
narrow approach as it forms a small part of the total breakdown. The ranking on the basis of total
down time of each machinery is much wider in approach. The ranking on the basis of total downtime
of the machinery should be considered as it is much more rationale.
Ranking on the basis of total downtime of machinery is much more rationale. Accordingly, machinery
ASM has given the worst performance. The major cause behind the breakdown of machinery are here
in below:
a) Air cylinder fault
b) Fallen Mother plate
c) Missing/Damaged parts
d) Load out Trolley
e) Electric Drive fault
f) Machine Isolated
g) B/head fault.
The data has been collected on the basis of raw data available. The same has been calculated,
computed and presented in the excel sheet attached for the better understanding of the same.
tabler-icon-diamond-filled.svg

Paraphrase This Document

Need a fresh take? Get an instant paraphrase of this document with our AI Paraphraser
Document Page
chevron_up_icon
1 out of 5
circle_padding
hide_on_mobile
zoom_out_icon
[object Object]