JCU EG5220: Analysis of Downtime of Production Machinery (2017-2019)
VerifiedAdded on 2022/10/08
|5
|1550
|14
Report
AI Summary
This report analyzes the downtime of eight key machinery components (APM, APS, ECSM, HLW 1&2, ASM, N Crane, S Crane, and WCSM) within a production flow from January 2017 to February 2019. The analysis includes monthly and quarterly trend generation, revealing the highest downtime in December 2017 and April 2018, with ASM identified as the most critical equipment based on Pareto chart analysis and ranking. The report investigates the causes of downtime for the critical equipment, identifying electrical, mechanical, and operational breakdowns, along with specific reasons like adjustment issues, bolt faults, and weld repairs. The findings are supported by data analysis and justifications, culminating in the conclusion that ASM is the most critical machine due to its high downtime hours.
Analysis of downtime of Machinery of Production Flow
Brief
The assignment seeks to explore the regular downtime issue of equipment by analysing the downtime
time of machinery for the period January 2017 to February, 2019. The analysis involve data for both
downtime and slowdown of machinery. However, the data for downtime has been used for analysing
the impact on the production flow. The analysis encompass the worst hit machinery and
understanding the possible reason for downtime of those machinery over the period of 2017 to 2019.
Also, the report ranks the machinery based on the downtime hours, being an ideal method on the
basis of data provided. Further, the report addresses the following questions and present a brief
overview of the issues:
Analysis of Data and resultant solutions
Part A- Analysis of Past data and drawing trend of downtime over the past 24 months
The report presents the downtime of 8 specific assets involved in the production process. The product
flow displays them as integral to each other. The name of 8 machinery has been detailed as under:
(a) APM;
(b) APS;
(c) ECSM;
(d) HLW 1& 2;
(e) ASM;
(f) N Crane;
(g) S Crane;
(h) WCSM.
A detailed flow of the machinery and the production process is enclosed herewith and marked as
Annexure-1.
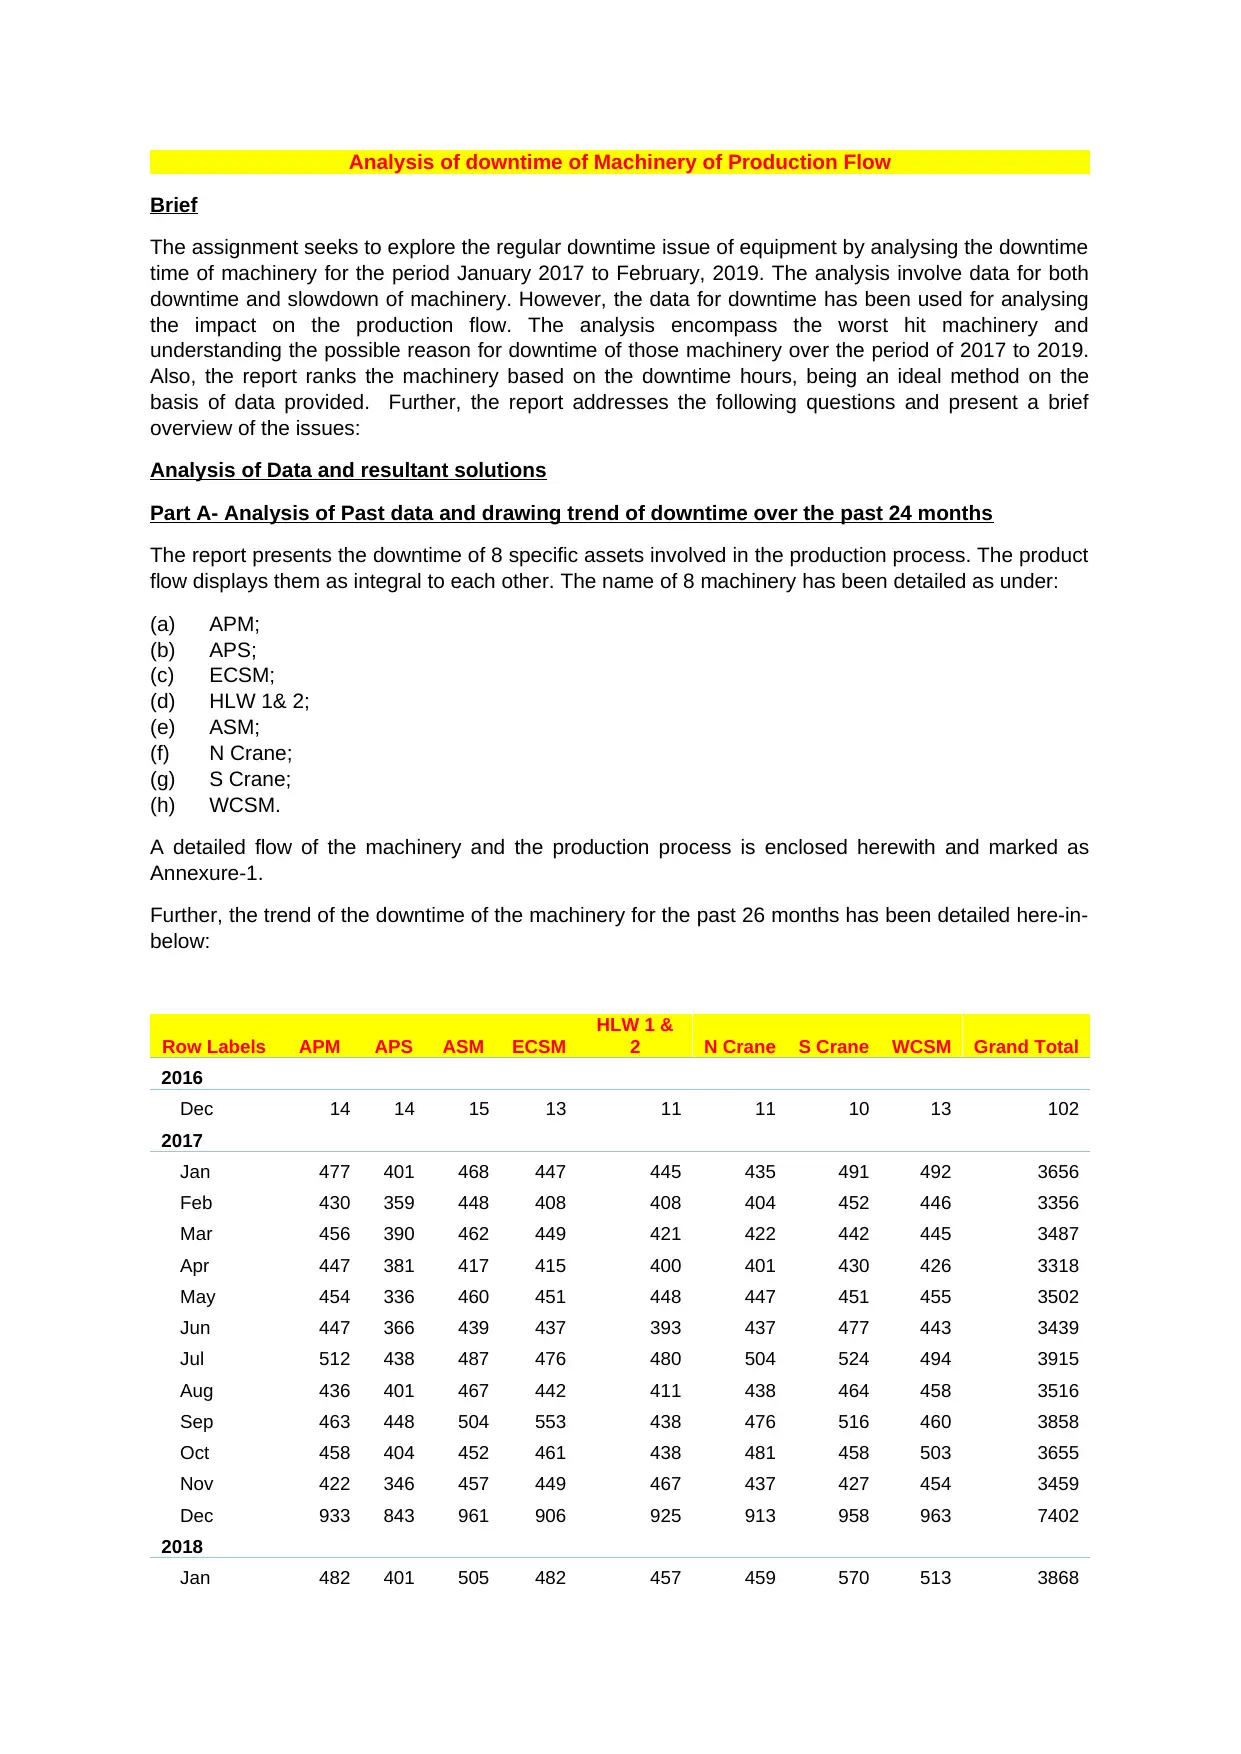
Further, the trend of the downtime of the machinery for the past 26 months has been detailed here-in-
below:
Row Labels APM APS ASM ECSM
HLW 1 &
2 N Crane S Crane WCSM Grand Total
2016
Dec 14 14 15 13 11 11 10 13 102
2017
Jan 477 401 468 447 445 435 491 492 3656
Feb 430 359 448 408 408 404 452 446 3356
Mar 456 390 462 449 421 422 442 445 3487
Apr 447 381 417 415 400 401 430 426 3318
May 454 336 460 451 448 447 451 455 3502
Jun 447 366 439 437 393 437 477 443 3439
Jul 512 438 487 476 480 504 524 494 3915
Aug 436 401 467 442 411 438 464 458 3516
Sep 463 448 504 553 438 476 516 460 3858
Oct 458 404 452 461 438 481 458 503 3655
Nov 422 346 457 449 467 437 427 454 3459
Dec 933 843 961 906 925 913 958 963 7402
2018
Jan 482 401 505 482 457 459 570 513 3868
Brief
The assignment seeks to explore the regular downtime issue of equipment by analysing the downtime
time of machinery for the period January 2017 to February, 2019. The analysis involve data for both
downtime and slowdown of machinery. However, the data for downtime has been used for analysing
the impact on the production flow. The analysis encompass the worst hit machinery and
understanding the possible reason for downtime of those machinery over the period of 2017 to 2019.
Also, the report ranks the machinery based on the downtime hours, being an ideal method on the
basis of data provided. Further, the report addresses the following questions and present a brief
overview of the issues:
Analysis of Data and resultant solutions
Part A- Analysis of Past data and drawing trend of downtime over the past 24 months
The report presents the downtime of 8 specific assets involved in the production process. The product
flow displays them as integral to each other. The name of 8 machinery has been detailed as under:
(a) APM;
(b) APS;
(c) ECSM;
(d) HLW 1& 2;
(e) ASM;
(f) N Crane;
(g) S Crane;
(h) WCSM.
A detailed flow of the machinery and the production process is enclosed herewith and marked as
Annexure-1.
Further, the trend of the downtime of the machinery for the past 26 months has been detailed here-in-
below:
Row Labels APM APS ASM ECSM
HLW 1 &
2 N Crane S Crane WCSM Grand Total
2016
Dec 14 14 15 13 11 11 10 13 102
2017
Jan 477 401 468 447 445 435 491 492 3656
Feb 430 359 448 408 408 404 452 446 3356
Mar 456 390 462 449 421 422 442 445 3487
Apr 447 381 417 415 400 401 430 426 3318
May 454 336 460 451 448 447 451 455 3502
Jun 447 366 439 437 393 437 477 443 3439
Jul 512 438 487 476 480 504 524 494 3915
Aug 436 401 467 442 411 438 464 458 3516
Sep 463 448 504 553 438 476 516 460 3858
Oct 458 404 452 461 438 481 458 503 3655
Nov 422 346 457 449 467 437 427 454 3459
Dec 933 843 961 906 925 913 958 963 7402
2018
Jan 482 401 505 482 457 459 570 513 3868
Paraphrase This Document
Need a fresh take? Get an instant paraphrase of this document with our AI Paraphraser
Feb 431 398 439 424 426 425 472 434 3450
Mar 556 531 574 578 520 543 610 550 4462
Apr 609 575 823 653 604 560 642 708 5174
May 497 452 492 503 490 493 537 380 3844
Jun 436 364 465 433 418 417 454 441 3428
Jul 432 537 582 432 409 407 423 425 3648
Aug 411 392 423 412 413 400 404 437 3291
Sep 422 368 438 404 407 394 412 419 3265
Oct 482 390 461 428 460 448 439 458 3566
Nov 422 368 447 277 411 421 432 435 3214
2019
Jan 6 1 7 7 13 5 3 21 63
Feb 0 1 7 37 11 4 3 15 77
Grand
Total 11136 9904
1170
0 10976 10724 10782 11503 11288 88014
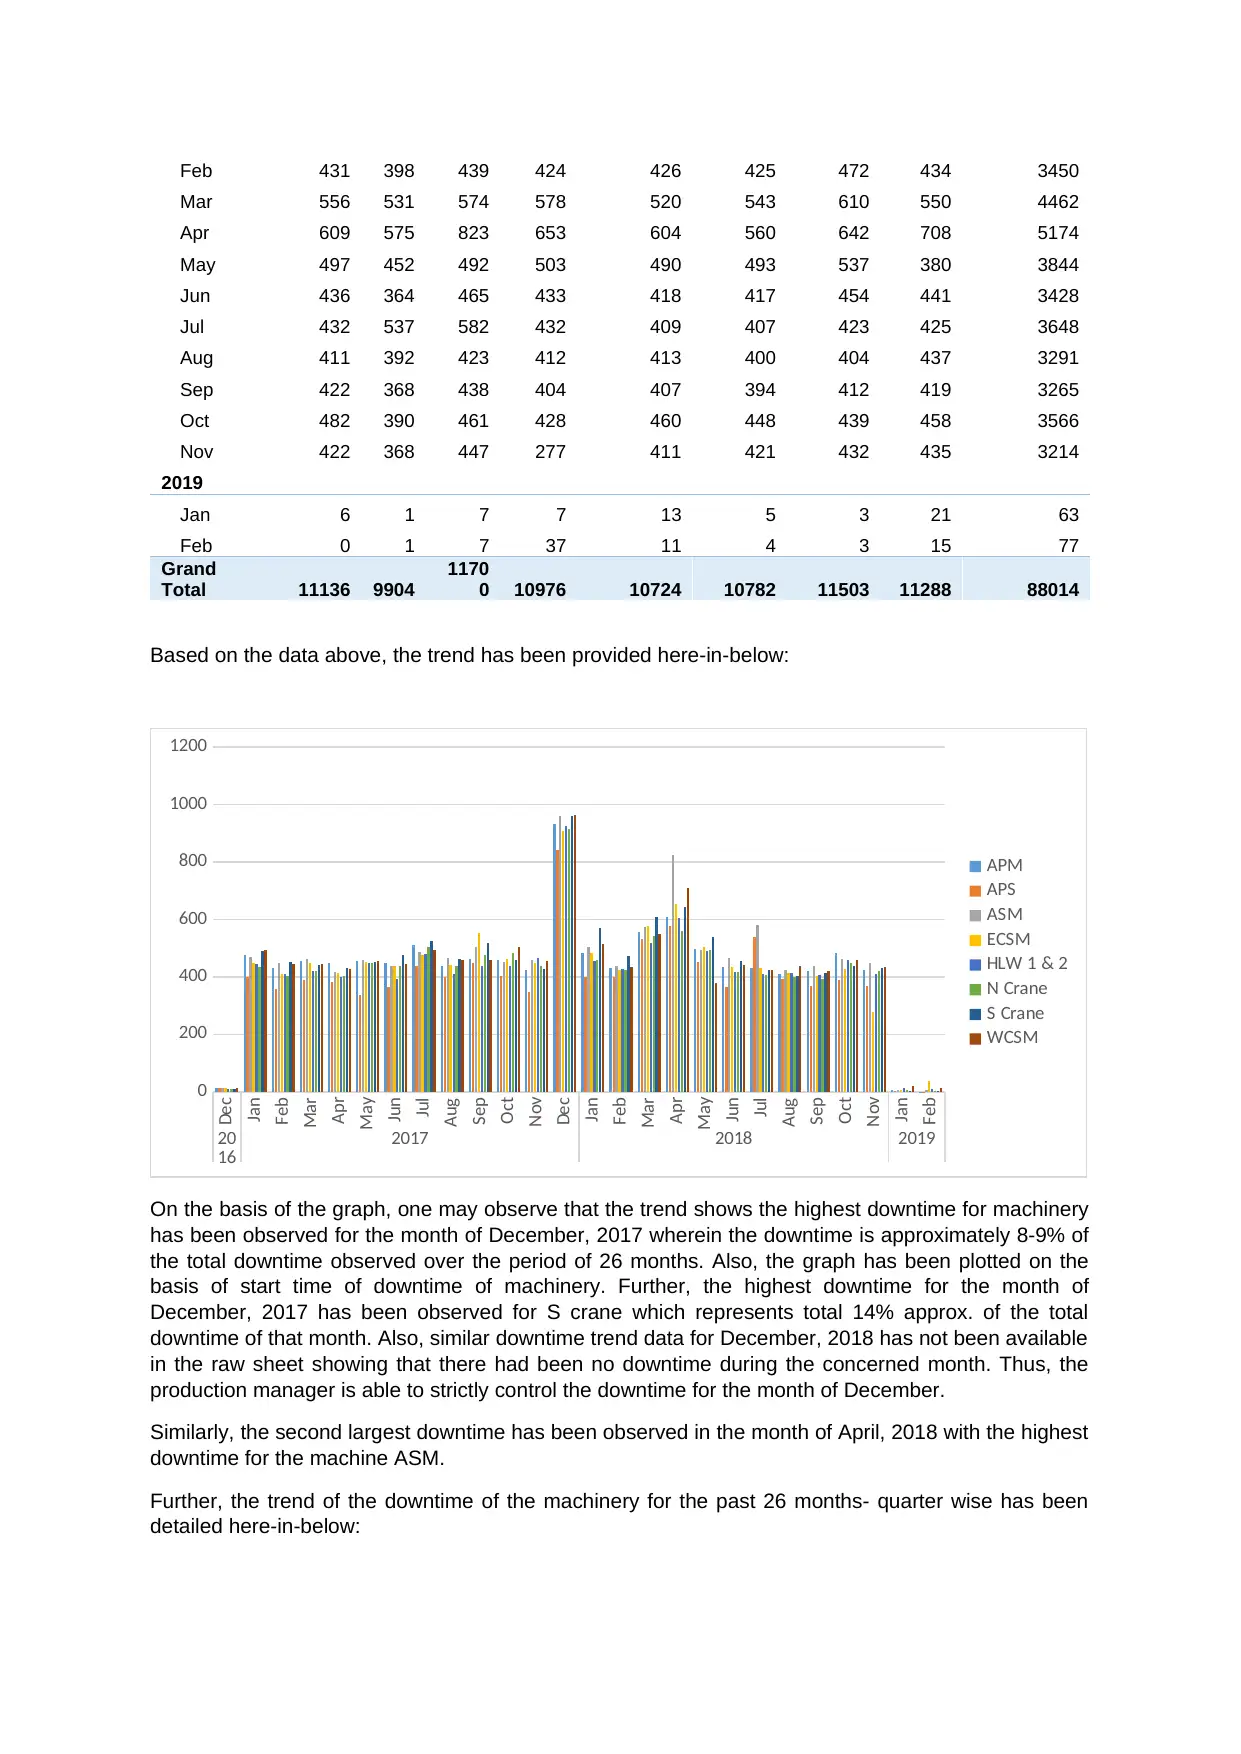
Based on the data above, the trend has been provided here-in-below:
Dec
Jan
Feb
Mar
Apr
May
Jun
Jul
Aug
Sep
Oct
Nov
Dec
Jan
Feb
Mar
Apr
May
Jun
Jul
Aug
Sep
Oct
Nov
Jan
Feb
20
16 2017 2018 2019
0
200
400
600
800
1000
1200
APM
APS
ASM
ECSM
HLW 1 & 2
N Crane
S Crane
WCSM
On the basis of the graph, one may observe that the trend shows the highest downtime for machinery
has been observed for the month of December, 2017 wherein the downtime is approximately 8-9% of
the total downtime observed over the period of 26 months. Also, the graph has been plotted on the
basis of start time of downtime of machinery. Further, the highest downtime for the month of
December, 2017 has been observed for S crane which represents total 14% approx. of the total
downtime of that month. Also, similar downtime trend data for December, 2018 has not been available
in the raw sheet showing that there had been no downtime during the concerned month. Thus, the
production manager is able to strictly control the downtime for the month of December.
Similarly, the second largest downtime has been observed in the month of April, 2018 with the highest
downtime for the machine ASM.
Further, the trend of the downtime of the machinery for the past 26 months- quarter wise has been
detailed here-in-below:
Mar 556 531 574 578 520 543 610 550 4462
Apr 609 575 823 653 604 560 642 708 5174
May 497 452 492 503 490 493 537 380 3844
Jun 436 364 465 433 418 417 454 441 3428
Jul 432 537 582 432 409 407 423 425 3648
Aug 411 392 423 412 413 400 404 437 3291
Sep 422 368 438 404 407 394 412 419 3265
Oct 482 390 461 428 460 448 439 458 3566
Nov 422 368 447 277 411 421 432 435 3214
2019
Jan 6 1 7 7 13 5 3 21 63
Feb 0 1 7 37 11 4 3 15 77
Grand
Total 11136 9904
1170
0 10976 10724 10782 11503 11288 88014
Based on the data above, the trend has been provided here-in-below:
Dec
Jan
Feb
Mar
Apr
May
Jun
Jul
Aug
Sep
Oct
Nov
Dec
Jan
Feb
Mar
Apr
May
Jun
Jul
Aug
Sep
Oct
Nov
Jan
Feb
20
16 2017 2018 2019
0
200
400
600
800
1000
1200
APM
APS
ASM
ECSM
HLW 1 & 2
N Crane
S Crane
WCSM
On the basis of the graph, one may observe that the trend shows the highest downtime for machinery
has been observed for the month of December, 2017 wherein the downtime is approximately 8-9% of
the total downtime observed over the period of 26 months. Also, the graph has been plotted on the
basis of start time of downtime of machinery. Further, the highest downtime for the month of
December, 2017 has been observed for S crane which represents total 14% approx. of the total
downtime of that month. Also, similar downtime trend data for December, 2018 has not been available
in the raw sheet showing that there had been no downtime during the concerned month. Thus, the
production manager is able to strictly control the downtime for the month of December.
Similarly, the second largest downtime has been observed in the month of April, 2018 with the highest
downtime for the machine ASM.
Further, the trend of the downtime of the machinery for the past 26 months- quarter wise has been
detailed here-in-below:
Row Labels APM APS ASM ECSM
HLW 1 &
2 N Crane
S
Crane WCSM Grand Total
2016
Qtr4 14 14 15 13 11 11 10 13 102
2017
Qtr1 1363 1149 1379 1304 1274 1261 1385 1384 10499
Qtr2 1348 1082 1316 1303 1241 1285 1358 1324 10258
Qtr3 1411 1287 1458 1471 1329 1418 1504 1412 11289
Qtr4 1814 1593 1870 1815 1830 1832 1844 1919 14517
2018
Qtr1 1468 1330 1518 1484 1403 1427 1652 1497 11779
Qtr2 1542 1391 1780 1589 1511 1469 1633 1529 12445
Qtr3 1265 1297 1443 1248 1229 1201 1240 1282 10205
Qtr4 905 758 908 705 872 869 871 892 6780
2019
Qtr1 6 2 14 44 25 9 6 35 140
Grand Total 11136 9904 11700 10976 10724 10782 11503 11288 88014
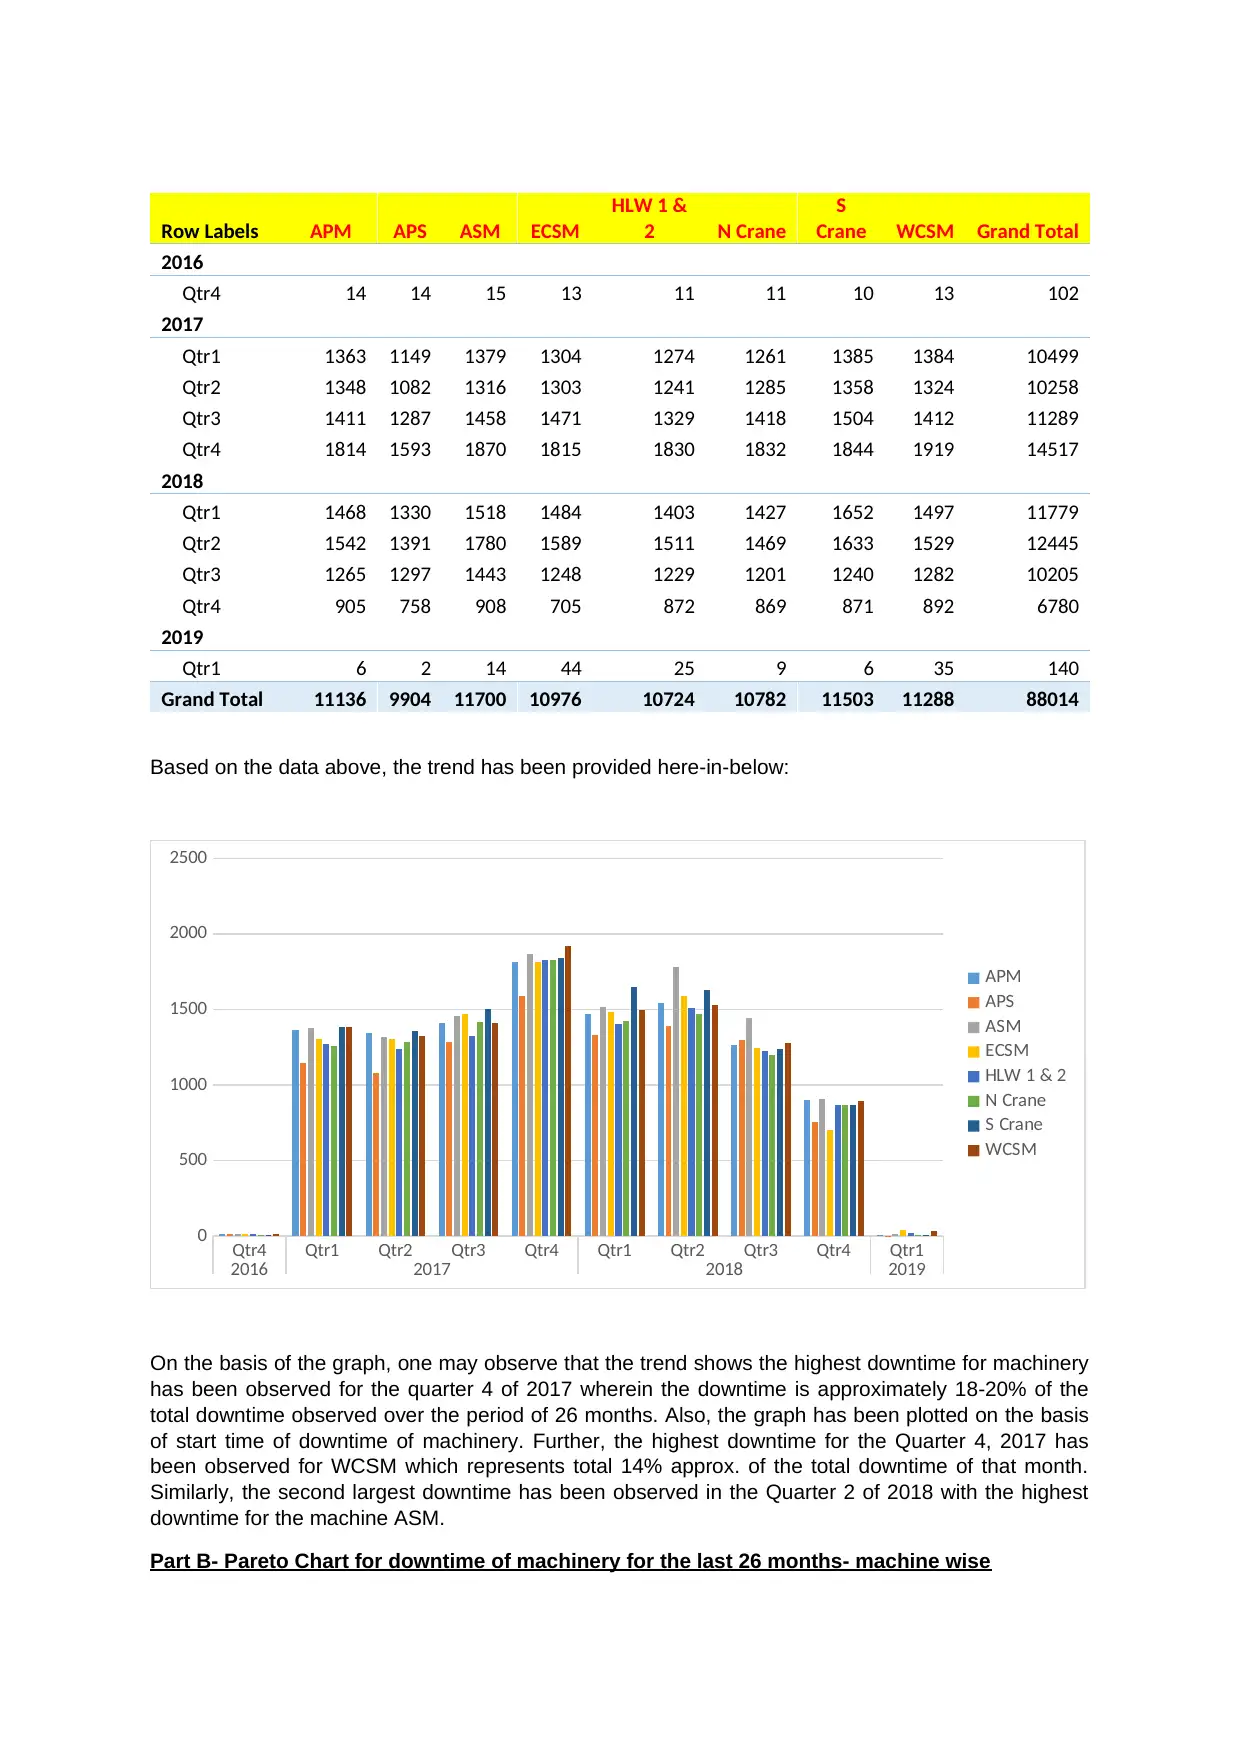
Based on the data above, the trend has been provided here-in-below:
Qtr4 Qtr1 Qtr2 Qtr3 Qtr4 Qtr1 Qtr2 Qtr3 Qtr4 Qtr1
2016 2017 2018 2019
0
500
1000
1500
2000
2500
APM
APS
ASM
ECSM
HLW 1 & 2
N Crane
S Crane
WCSM
On the basis of the graph, one may observe that the trend shows the highest downtime for machinery
has been observed for the quarter 4 of 2017 wherein the downtime is approximately 18-20% of the
total downtime observed over the period of 26 months. Also, the graph has been plotted on the basis
of start time of downtime of machinery. Further, the highest downtime for the Quarter 4, 2017 has
been observed for WCSM which represents total 14% approx. of the total downtime of that month.
Similarly, the second largest downtime has been observed in the Quarter 2 of 2018 with the highest
downtime for the machine ASM.
Part B- Pareto Chart for downtime of machinery for the last 26 months- machine wise
HLW 1 &
2 N Crane
S
Crane WCSM Grand Total
2016
Qtr4 14 14 15 13 11 11 10 13 102
2017
Qtr1 1363 1149 1379 1304 1274 1261 1385 1384 10499
Qtr2 1348 1082 1316 1303 1241 1285 1358 1324 10258
Qtr3 1411 1287 1458 1471 1329 1418 1504 1412 11289
Qtr4 1814 1593 1870 1815 1830 1832 1844 1919 14517
2018
Qtr1 1468 1330 1518 1484 1403 1427 1652 1497 11779
Qtr2 1542 1391 1780 1589 1511 1469 1633 1529 12445
Qtr3 1265 1297 1443 1248 1229 1201 1240 1282 10205
Qtr4 905 758 908 705 872 869 871 892 6780
2019
Qtr1 6 2 14 44 25 9 6 35 140
Grand Total 11136 9904 11700 10976 10724 10782 11503 11288 88014
Based on the data above, the trend has been provided here-in-below:
Qtr4 Qtr1 Qtr2 Qtr3 Qtr4 Qtr1 Qtr2 Qtr3 Qtr4 Qtr1
2016 2017 2018 2019
0
500
1000
1500
2000
2500
APM
APS
ASM
ECSM
HLW 1 & 2
N Crane
S Crane
WCSM
On the basis of the graph, one may observe that the trend shows the highest downtime for machinery
has been observed for the quarter 4 of 2017 wherein the downtime is approximately 18-20% of the
total downtime observed over the period of 26 months. Also, the graph has been plotted on the basis
of start time of downtime of machinery. Further, the highest downtime for the Quarter 4, 2017 has
been observed for WCSM which represents total 14% approx. of the total downtime of that month.
Similarly, the second largest downtime has been observed in the Quarter 2 of 2018 with the highest
downtime for the machine ASM.
Part B- Pareto Chart for downtime of machinery for the last 26 months- machine wise
⊘ This is a preview!⊘
Do you want full access?
Subscribe today to unlock all pages.
Trusted by 1+ million students worldwide
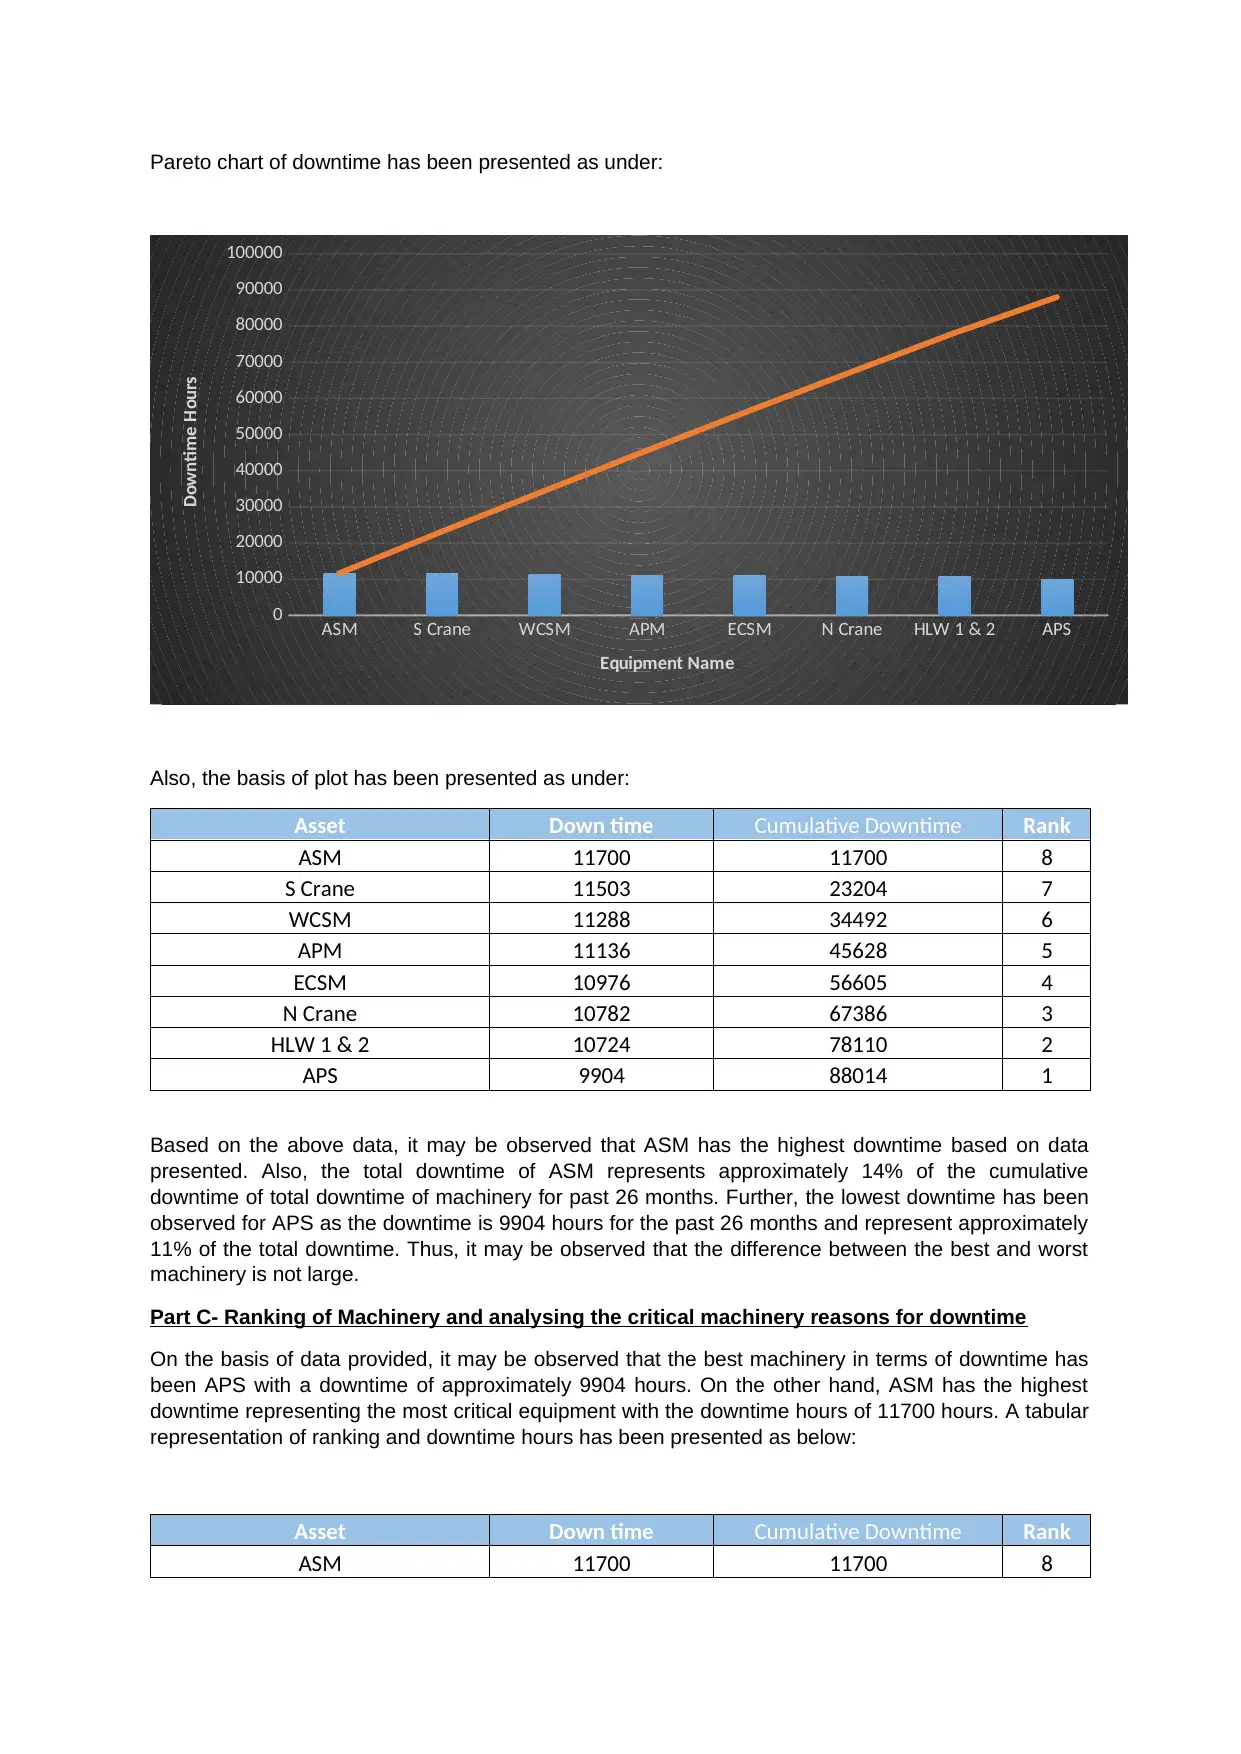
Pareto chart of downtime has been presented as under:
ASM S Crane WCSM APM ECSM N Crane HLW 1 & 2 APS
0
10000
20000
30000
40000
50000
60000
70000
80000
90000
100000
Equipment Name
Downtime Hours
Also, the basis of plot has been presented as under:
Asset Down time Cumulative Downtime Rank
ASM 11700 11700 8
S Crane 11503 23204 7
WCSM 11288 34492 6
APM 11136 45628 5
ECSM 10976 56605 4
N Crane 10782 67386 3
HLW 1 & 2 10724 78110 2
APS 9904 88014 1
Based on the above data, it may be observed that ASM has the highest downtime based on data
presented. Also, the total downtime of ASM represents approximately 14% of the cumulative
downtime of total downtime of machinery for past 26 months. Further, the lowest downtime has been
observed for APS as the downtime is 9904 hours for the past 26 months and represent approximately
11% of the total downtime. Thus, it may be observed that the difference between the best and worst
machinery is not large.
Part C- Ranking of Machinery and analysing the critical machinery reasons for downtime
On the basis of data provided, it may be observed that the best machinery in terms of downtime has
been APS with a downtime of approximately 9904 hours. On the other hand, ASM has the highest
downtime representing the most critical equipment with the downtime hours of 11700 hours. A tabular
representation of ranking and downtime hours has been presented as below:
Asset Down time Cumulative Downtime Rank
ASM 11700 11700 8
Paraphrase This Document
Need a fresh take? Get an instant paraphrase of this document with our AI Paraphraser
Asset Down time Cumulative Downtime Rank
S Crane 11503 23204 7
WCSM 11288 34492 6
APM 11136 45628 5
ECSM 10976 56605 4
N Crane 10782 67386 3
HLW 1 & 2 10724 78110 2
APS 9904 88014 1
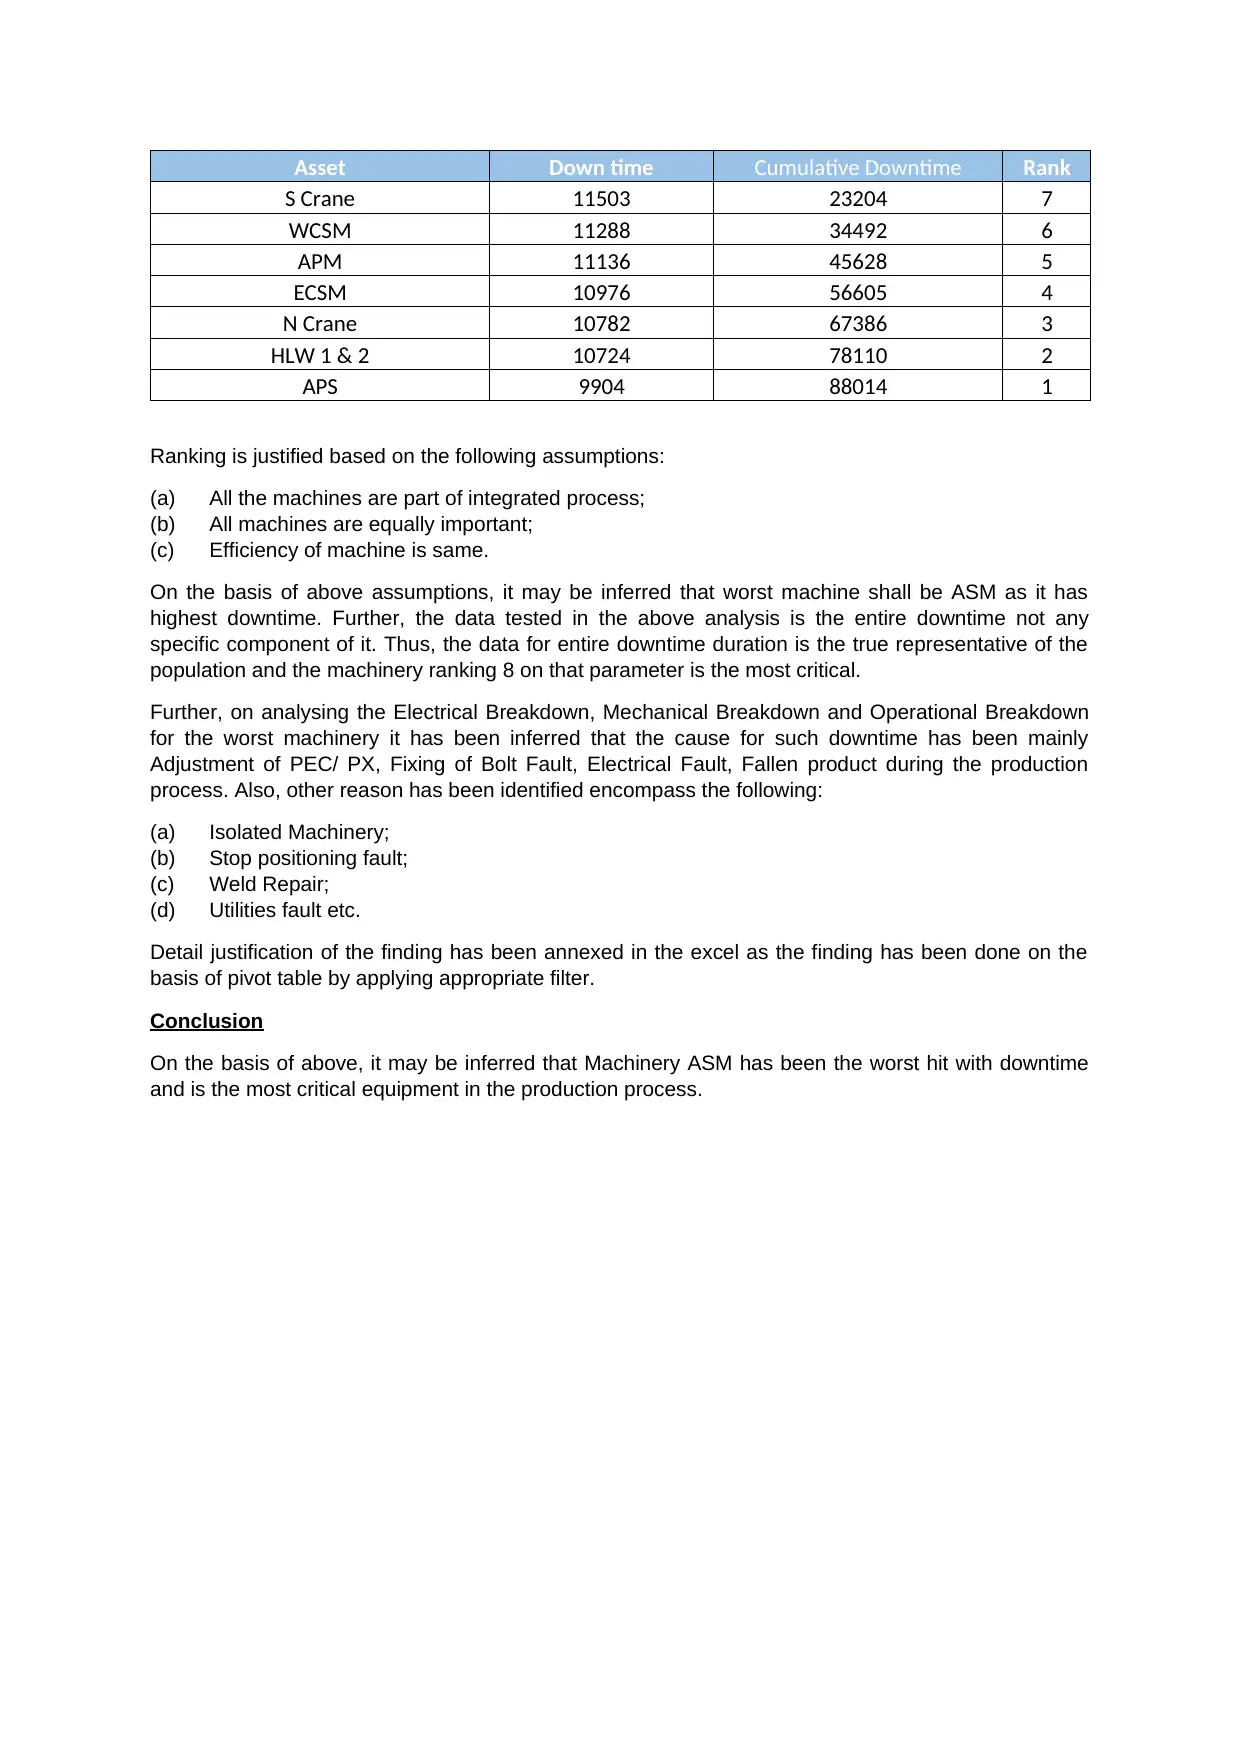
Ranking is justified based on the following assumptions:
(a) All the machines are part of integrated process;
(b) All machines are equally important;
(c) Efficiency of machine is same.
On the basis of above assumptions, it may be inferred that worst machine shall be ASM as it has
highest downtime. Further, the data tested in the above analysis is the entire downtime not any
specific component of it. Thus, the data for entire downtime duration is the true representative of the
population and the machinery ranking 8 on that parameter is the most critical.
Further, on analysing the Electrical Breakdown, Mechanical Breakdown and Operational Breakdown
for the worst machinery it has been inferred that the cause for such downtime has been mainly
Adjustment of PEC/ PX, Fixing of Bolt Fault, Electrical Fault, Fallen product during the production
process. Also, other reason has been identified encompass the following:
(a) Isolated Machinery;
(b) Stop positioning fault;
(c) Weld Repair;
(d) Utilities fault etc.
Detail justification of the finding has been annexed in the excel as the finding has been done on the
basis of pivot table by applying appropriate filter.
Conclusion
On the basis of above, it may be inferred that Machinery ASM has been the worst hit with downtime
and is the most critical equipment in the production process.
S Crane 11503 23204 7
WCSM 11288 34492 6
APM 11136 45628 5
ECSM 10976 56605 4
N Crane 10782 67386 3
HLW 1 & 2 10724 78110 2
APS 9904 88014 1
Ranking is justified based on the following assumptions:
(a) All the machines are part of integrated process;
(b) All machines are equally important;
(c) Efficiency of machine is same.
On the basis of above assumptions, it may be inferred that worst machine shall be ASM as it has
highest downtime. Further, the data tested in the above analysis is the entire downtime not any
specific component of it. Thus, the data for entire downtime duration is the true representative of the
population and the machinery ranking 8 on that parameter is the most critical.
Further, on analysing the Electrical Breakdown, Mechanical Breakdown and Operational Breakdown
for the worst machinery it has been inferred that the cause for such downtime has been mainly
Adjustment of PEC/ PX, Fixing of Bolt Fault, Electrical Fault, Fallen product during the production
process. Also, other reason has been identified encompass the following:
(a) Isolated Machinery;
(b) Stop positioning fault;
(c) Weld Repair;
(d) Utilities fault etc.
Detail justification of the finding has been annexed in the excel as the finding has been done on the
basis of pivot table by applying appropriate filter.
Conclusion
On the basis of above, it may be inferred that Machinery ASM has been the worst hit with downtime
and is the most critical equipment in the production process.
1 out of 5
Your All-in-One AI-Powered Toolkit for Academic Success.
+13062052269
info@desklib.com
Available 24*7 on WhatsApp / Email
![[object Object]](/_next/static/media/star-bottom.7253800d.svg)
Unlock your academic potential
Copyright © 2020–2026 A2Z Services. All Rights Reserved. Developed and managed by ZUCOL.