Macho Vintage Brand Plan: Sales Forecasting, Range, and Cost Analysis
VerifiedAdded on 2020/04/15
|12
|2511
|49
Report
AI Summary
This report details the development of a new house brand, "Macho Vintage," for Glue Store to address issues of late deliveries and high costs associated with The Academy Brand. The report includes a brand description, trend analysis, and sales forecasts for the high summer season. It formulates an Open-to-Buy plan, outlines a range plan, calculates target costs, and presents monthly phasing strategies. The analysis covers sales forecasting, open-to-buy calculations, range planning, and financial analysis, providing a comprehensive overview of the brand's potential within the Glue Store environment, including detailed tables illustrating sales forecasts, markdown values, open-to-buy calculations, range plans, target cost calculations, and monthly phasing for various product classes like Trees, Tanks, Shirts, Swim Shorts, Walk Shorts, and Chinos. The report aims to provide a strategic plan for the successful launch and management of the Macho Vintage brand.
Buying and Merchandise Planning
Paraphrase This Document
Need a fresh take? Get an instant paraphrase of this document with our AI Paraphraser
Table of Contents
Part 1: Brand description and trend analysis...................................................................................1
Brand description.........................................................................................................................1
Brand essence..............................................................................................................................1
Trend analysis..............................................................................................................................2
Part 2: Sales Forecast for High Summer..........................................................................................2
Part 3: Formulate Open to Buy........................................................................................................3
Part -4 Range Plan...........................................................................................................................5
Part-5 Calculation of Target Cost....................................................................................................6
Part-6 Monthly Phasing...................................................................................................................8
References......................................................................................................................................10
Part 1: Brand description and trend analysis
The main issue faced by Glue Store is of late deliveries and increased cost prices associated with
The Academy Brand which causes a reduction in profits. To overcome such issue buying head
wants to design a new house brand to replace The Academy Brand business across Glue Stores.
Brand description
Name: “Macho Vintage”
Description: Macho Vintage will be a new brand of Glue Store that will be a modern and
sophisticated label for fashion conscious men. The Macho Vintage will market its clothing
towards adults and teenager who are looking for affordable, yet chic items to complete their
wardrobe. Looking towards the demand for designer clothes, the brand will more focus on the
newest and latest style. The new brand will concentrate to achieve the aim of Glue Store which is
to deliver the products on time and reduction in operating cost. This brand will be specifically
directed to design cloths for young males nowadays. The Glue Store is known for offering
quality products. However, it shows that the people behind the brand are knowledgeable in
selling and have presented a great idea.
Brand essence
“Men’s Quality clothing that will allow customers to enjoy the great outdoors while staying
warm and looking stylish.”
1 | P a g e
⊘ This is a preview!⊘
Do you want full access?
Subscribe today to unlock all pages.
Trusted by 1+ million students worldwide
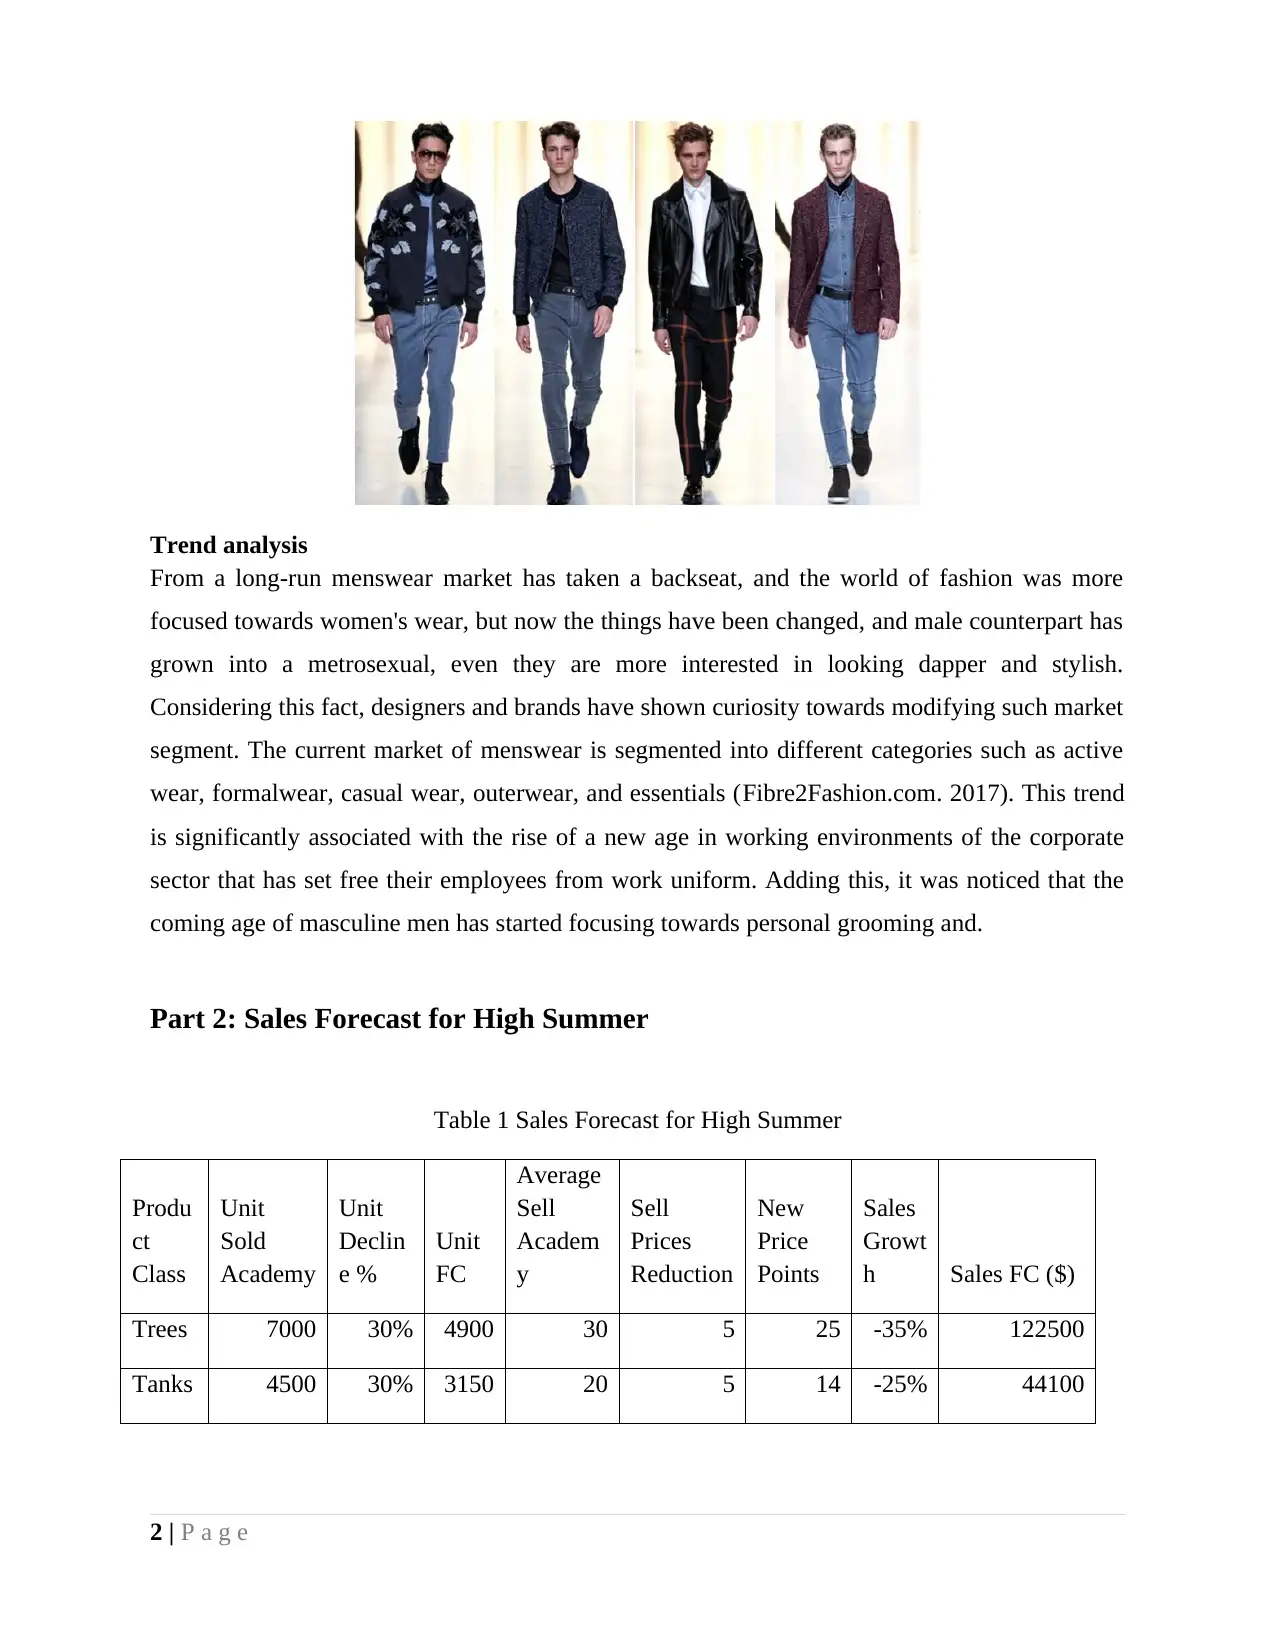
Trend analysis
From a long-run menswear market has taken a backseat, and the world of fashion was more
focused towards women's wear, but now the things have been changed, and male counterpart has
grown into a metrosexual, even they are more interested in looking dapper and stylish.
Considering this fact, designers and brands have shown curiosity towards modifying such market
segment. The current market of menswear is segmented into different categories such as active
wear, formalwear, casual wear, outerwear, and essentials (Fibre2Fashion.com. 2017). This trend
is significantly associated with the rise of a new age in working environments of the corporate
sector that has set free their employees from work uniform. Adding this, it was noticed that the
coming age of masculine men has started focusing towards personal grooming and.
Part 2: Sales Forecast for High Summer
Table 1 Sales Forecast for High Summer
Produ
ct
Class
Unit
Sold
Academy
Unit
Declin
e %
Unit
FC
Average
Sell
Academ
y
Sell
Prices
Reduction
New
Price
Points
Sales
Growt
h Sales FC ($)
Trees 7000 30% 4900 30 5 25 -35% 122500
Tanks 4500 30% 3150 20 5 14 -25% 44100
2 | P a g e
Paraphrase This Document
Need a fresh take? Get an instant paraphrase of this document with our AI Paraphraser
Shirts
SS 2700 30% 1890 45 5 38 15% 71820
Swim
Shorts 5500 30% 3850 40 5 32 8% 123200
Walk
shorts 6000 30% 4200 50 5 41 9% 172200
Chino
s 1700 30% 1190 90 5 80 6% 95200
27400
1918
0 FC 629020
Table 2 Calculation of Sales Growth
Previous
sales unit
Less : 20% margin
Previous sales unit
which are unsold Current sales unit % Sales Growth
7000 5600 8641 -35%
4500 3600 5761 -25%
2700 2160 900 15%
5500 4400 3703 8%
6000 4800 4000 9%
1700 1360 847 6%
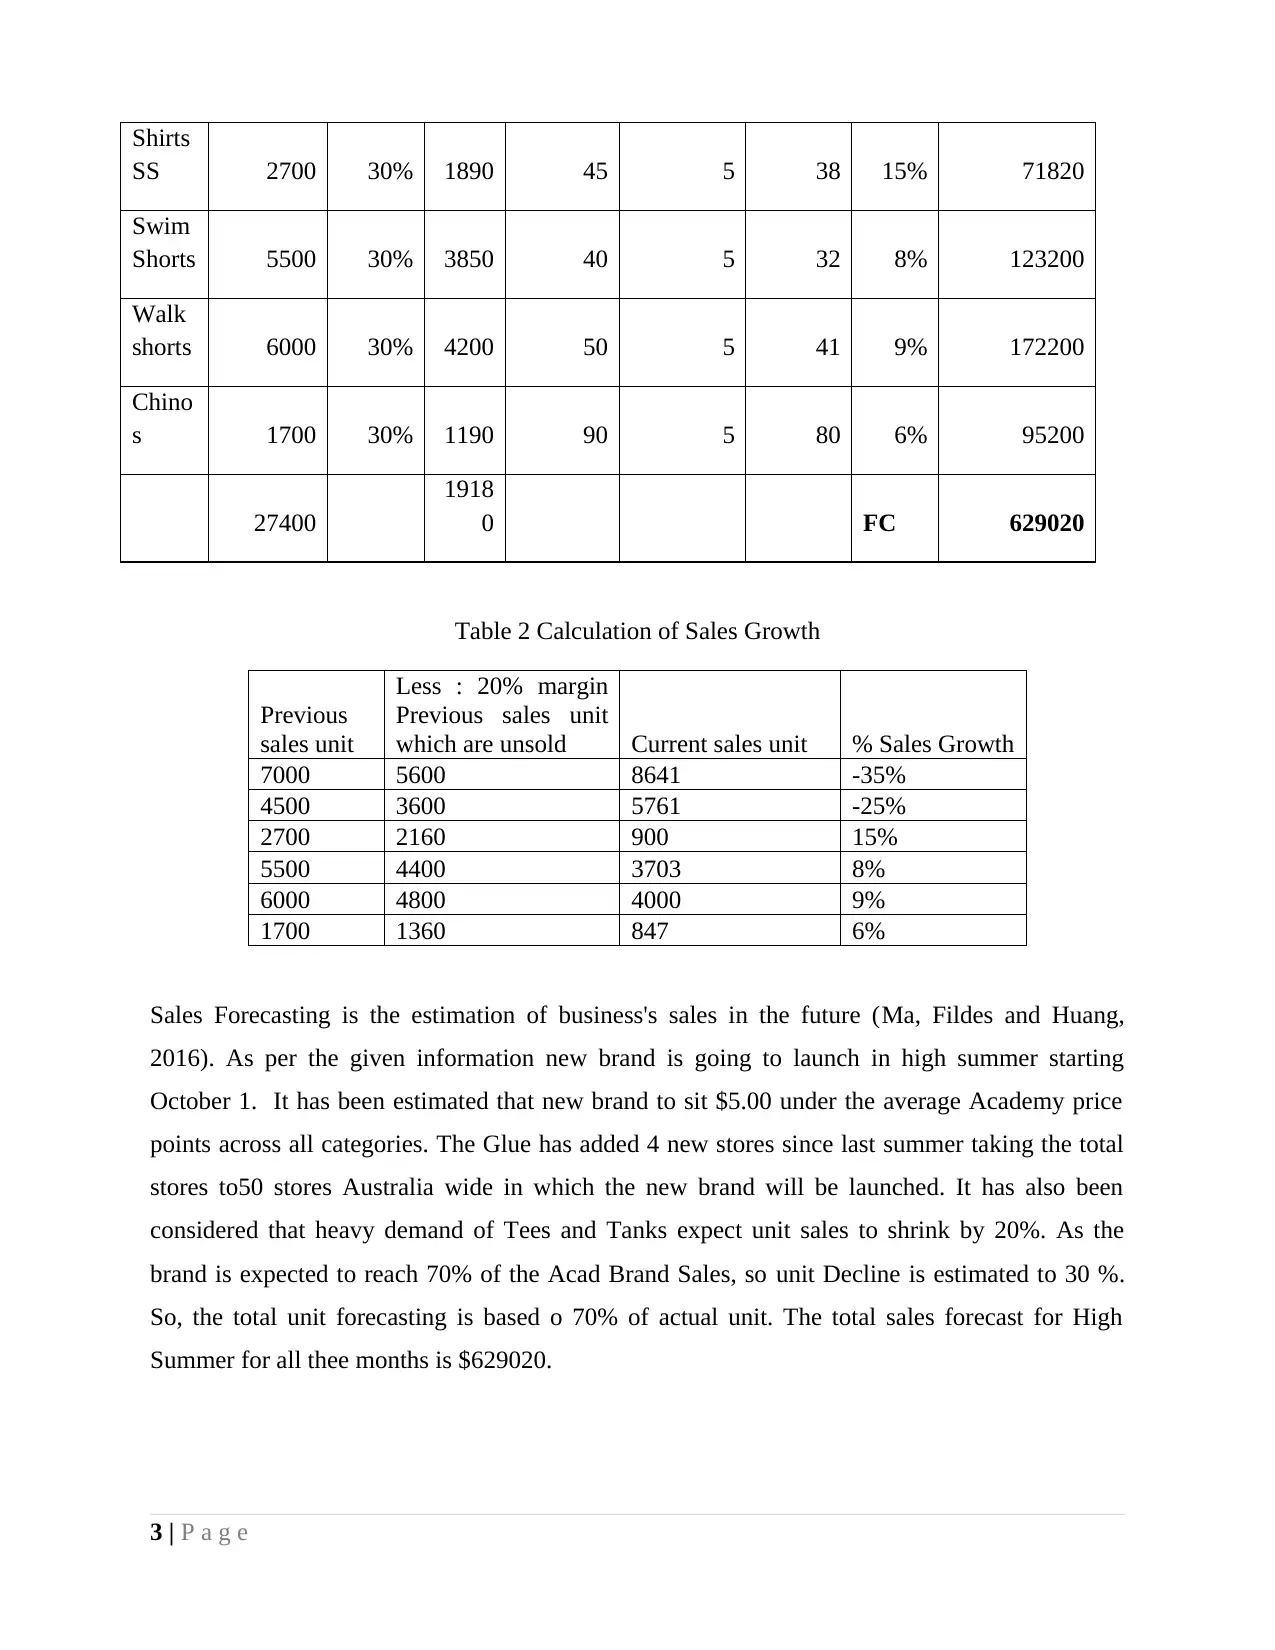
Sales Forecasting is the estimation of business's sales in the future (Ma, Fildes and Huang,
2016). As per the given information new brand is going to launch in high summer starting
October 1. It has been estimated that new brand to sit $5.00 under the average Academy price
points across all categories. The Glue has added 4 new stores since last summer taking the total
stores to50 stores Australia wide in which the new brand will be launched. It has also been
considered that heavy demand of Tees and Tanks expect unit sales to shrink by 20%. As the
brand is expected to reach 70% of the Acad Brand Sales, so unit Decline is estimated to 30 %.
So, the total unit forecasting is based o 70% of actual unit. The total sales forecast for High
Summer for all thee months is $629020.
3 | P a g e
SS 2700 30% 1890 45 5 38 15% 71820
Swim
Shorts 5500 30% 3850 40 5 32 8% 123200
Walk
shorts 6000 30% 4200 50 5 41 9% 172200
Chino
s 1700 30% 1190 90 5 80 6% 95200
27400
1918
0 FC 629020
Table 2 Calculation of Sales Growth
Previous
sales unit
Less : 20% margin
Previous sales unit
which are unsold Current sales unit % Sales Growth
7000 5600 8641 -35%
4500 3600 5761 -25%
2700 2160 900 15%
5500 4400 3703 8%
6000 4800 4000 9%
1700 1360 847 6%
Sales Forecasting is the estimation of business's sales in the future (Ma, Fildes and Huang,
2016). As per the given information new brand is going to launch in high summer starting
October 1. It has been estimated that new brand to sit $5.00 under the average Academy price
points across all categories. The Glue has added 4 new stores since last summer taking the total
stores to50 stores Australia wide in which the new brand will be launched. It has also been
considered that heavy demand of Tees and Tanks expect unit sales to shrink by 20%. As the
brand is expected to reach 70% of the Acad Brand Sales, so unit Decline is estimated to 30 %.
So, the total unit forecasting is based o 70% of actual unit. The total sales forecast for High
Summer for all thee months is $629020.
3 | P a g e
Part 3: Formulate Open to Buy
Table 3 Calculation for Open to Buy
Product
Class
Planned
Sales
Planned
Markdowns
Planned End of
Month Inventory
-Planned Beginning of
Month Inventory
Open-To-
Buy (retail)
Trees 122500 9072 12250 $150000
Tanks 44100 3499.2 4410
Shirts
SS 71820 4898.88 7182
Swim
Shorts 123200 8731.8 12320
Walk
shorts 172200 12247.2 17220
Chinos 95200 6554.52 9520
629020 45003.6 62902 $ 150000 $ 586925.6
Table 4 Calculation of mark down value
Product
Class
Sales
FC
Sales
Through
Unsold
Stock MD
MD
value
Trees 151200 80% 30240 30% 9072
Tanks 58320 80% 11664 30% 3499.2
Shirts SS 81648 80% 16329.6 30% 4898.88
Swim
Shorts 145530 80% 29106 30% 8731.8
Walk shorts 204120 80% 40824 30% 12247.2
Chinos 109242 80% 21848.4 30% 6554.52
750060
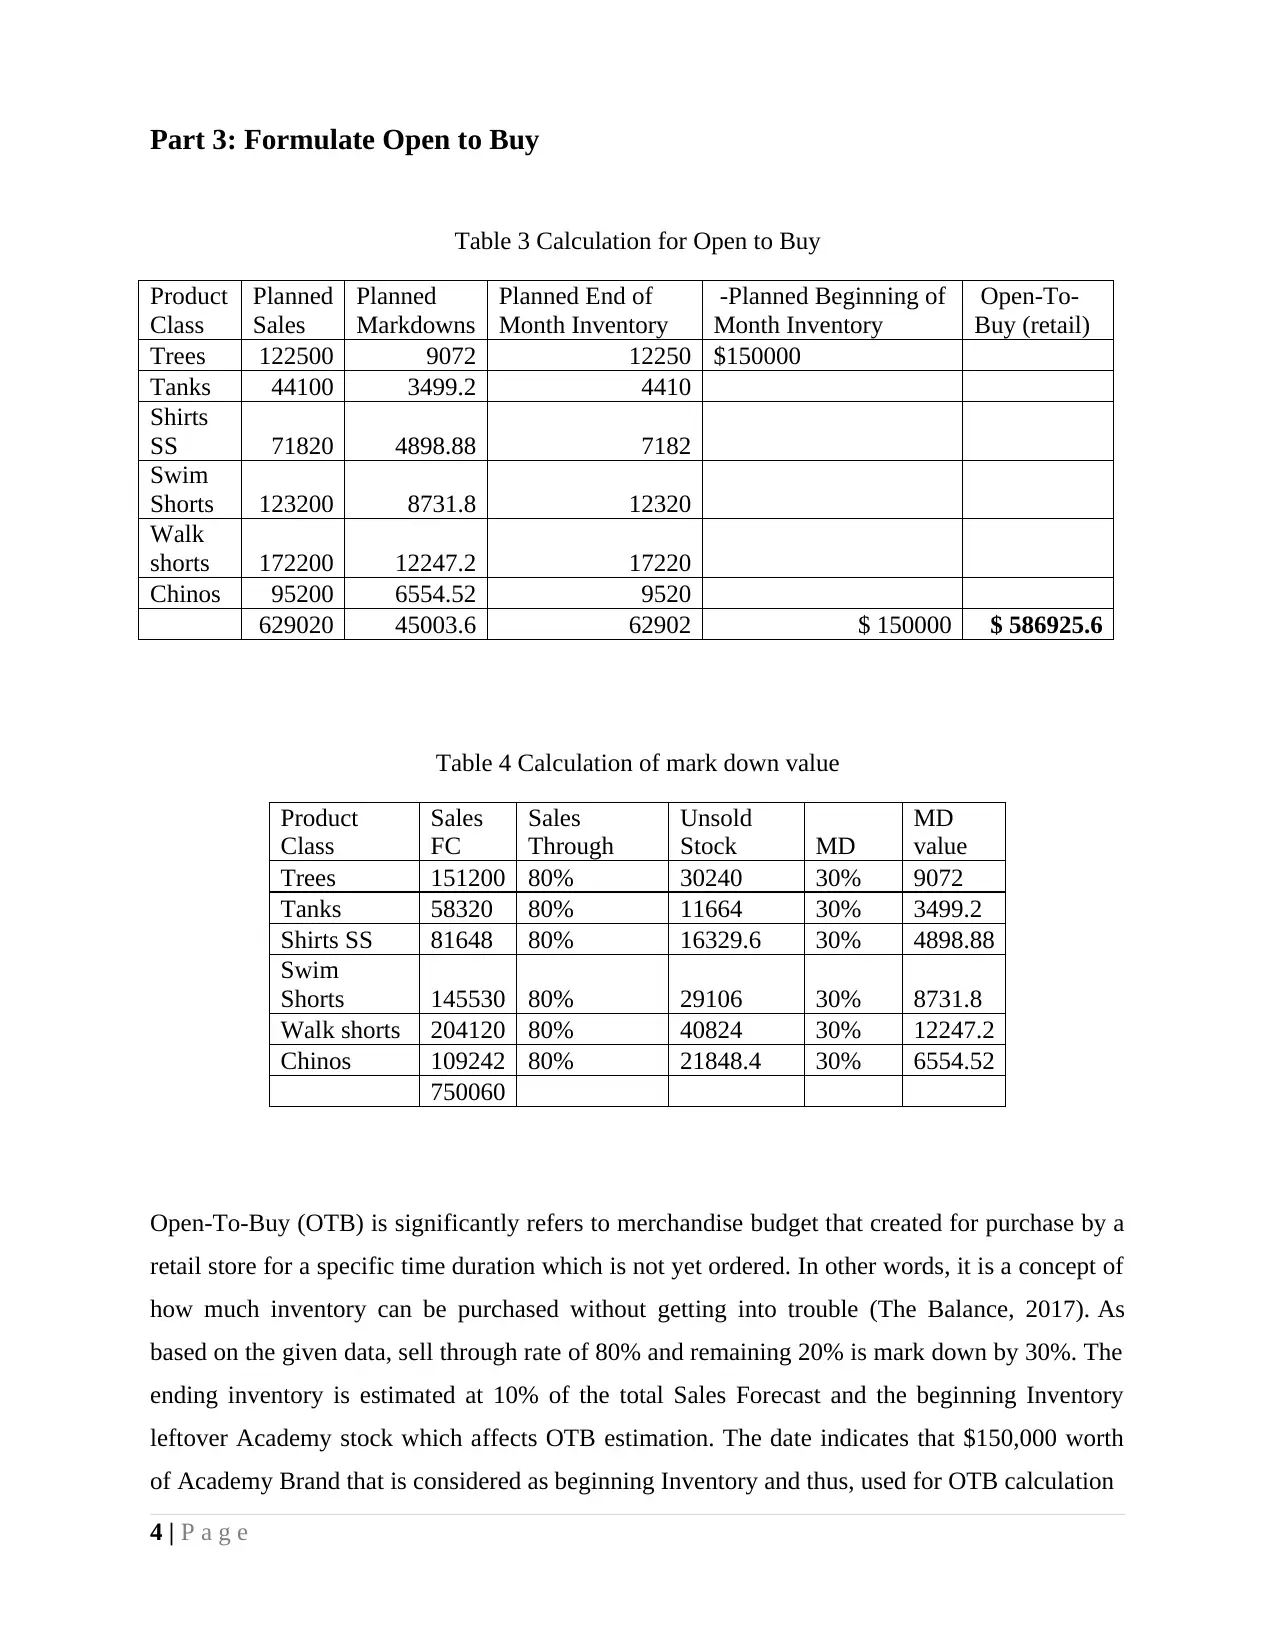
Open-To-Buy (OTB) is significantly refers to merchandise budget that created for purchase by a
retail store for a specific time duration which is not yet ordered. In other words, it is a concept of
how much inventory can be purchased without getting into trouble (The Balance, 2017). As
based on the given data, sell through rate of 80% and remaining 20% is mark down by 30%. The
ending inventory is estimated at 10% of the total Sales Forecast and the beginning Inventory
leftover Academy stock which affects OTB estimation. The date indicates that $150,000 worth
of Academy Brand that is considered as beginning Inventory and thus, used for OTB calculation
4 | P a g e
Table 3 Calculation for Open to Buy
Product
Class
Planned
Sales
Planned
Markdowns
Planned End of
Month Inventory
-Planned Beginning of
Month Inventory
Open-To-
Buy (retail)
Trees 122500 9072 12250 $150000
Tanks 44100 3499.2 4410
Shirts
SS 71820 4898.88 7182
Swim
Shorts 123200 8731.8 12320
Walk
shorts 172200 12247.2 17220
Chinos 95200 6554.52 9520
629020 45003.6 62902 $ 150000 $ 586925.6
Table 4 Calculation of mark down value
Product
Class
Sales
FC
Sales
Through
Unsold
Stock MD
MD
value
Trees 151200 80% 30240 30% 9072
Tanks 58320 80% 11664 30% 3499.2
Shirts SS 81648 80% 16329.6 30% 4898.88
Swim
Shorts 145530 80% 29106 30% 8731.8
Walk shorts 204120 80% 40824 30% 12247.2
Chinos 109242 80% 21848.4 30% 6554.52
750060
Open-To-Buy (OTB) is significantly refers to merchandise budget that created for purchase by a
retail store for a specific time duration which is not yet ordered. In other words, it is a concept of
how much inventory can be purchased without getting into trouble (The Balance, 2017). As
based on the given data, sell through rate of 80% and remaining 20% is mark down by 30%. The
ending inventory is estimated at 10% of the total Sales Forecast and the beginning Inventory
leftover Academy stock which affects OTB estimation. The date indicates that $150,000 worth
of Academy Brand that is considered as beginning Inventory and thus, used for OTB calculation
4 | P a g e
⊘ This is a preview!⊘
Do you want full access?
Subscribe today to unlock all pages.
Trusted by 1+ million students worldwide
Formula used for OTB =Planned Sales + Planned Markdowns + Planned End of Month
Inventory - Planned Beginning of Month Inventory
There are two forms to calculate Open-To-Buy, either units or dollars; however the best is to
calculate it in dollars as there can be some variations in costs of products. Total open to buy
inventory is $586925.6. As prior to calculate OTB, Mark-down percentage to the unsold stock
value is used to obtain mark down value.
Part -4 Range Plan
Table 5 Range plan
Product
Class
Range
Makeu
p
OTB
per
class
Avg
sellin
g
price
Units
require
d
Total
Store
s
Unit
s per
SKU
per
store
Quantit
y per
SKU
Total
SKU
require
d
Tees 30% 216021 25.00 8640.84 50 12 600.00 9240.84
Tanks 12% 86408.4 15.00 5760.56 50 12 600.00 6360.56
Shirts SS 5% 36003.5 40.00 900.088 50 10 500.00 1400.09
Swim Shorts 18%
129612.
6 35.00 3703.22 50 10 500.00 4203.22
Walk Shorts 25%
180017.
5 45.00 4000.39 50 12 600.00 4600.39
Chinos 10% 72007 85.00 847.141 50 8 400.00 1247.14
Total 100% 720070 23852.2
27052.2
3
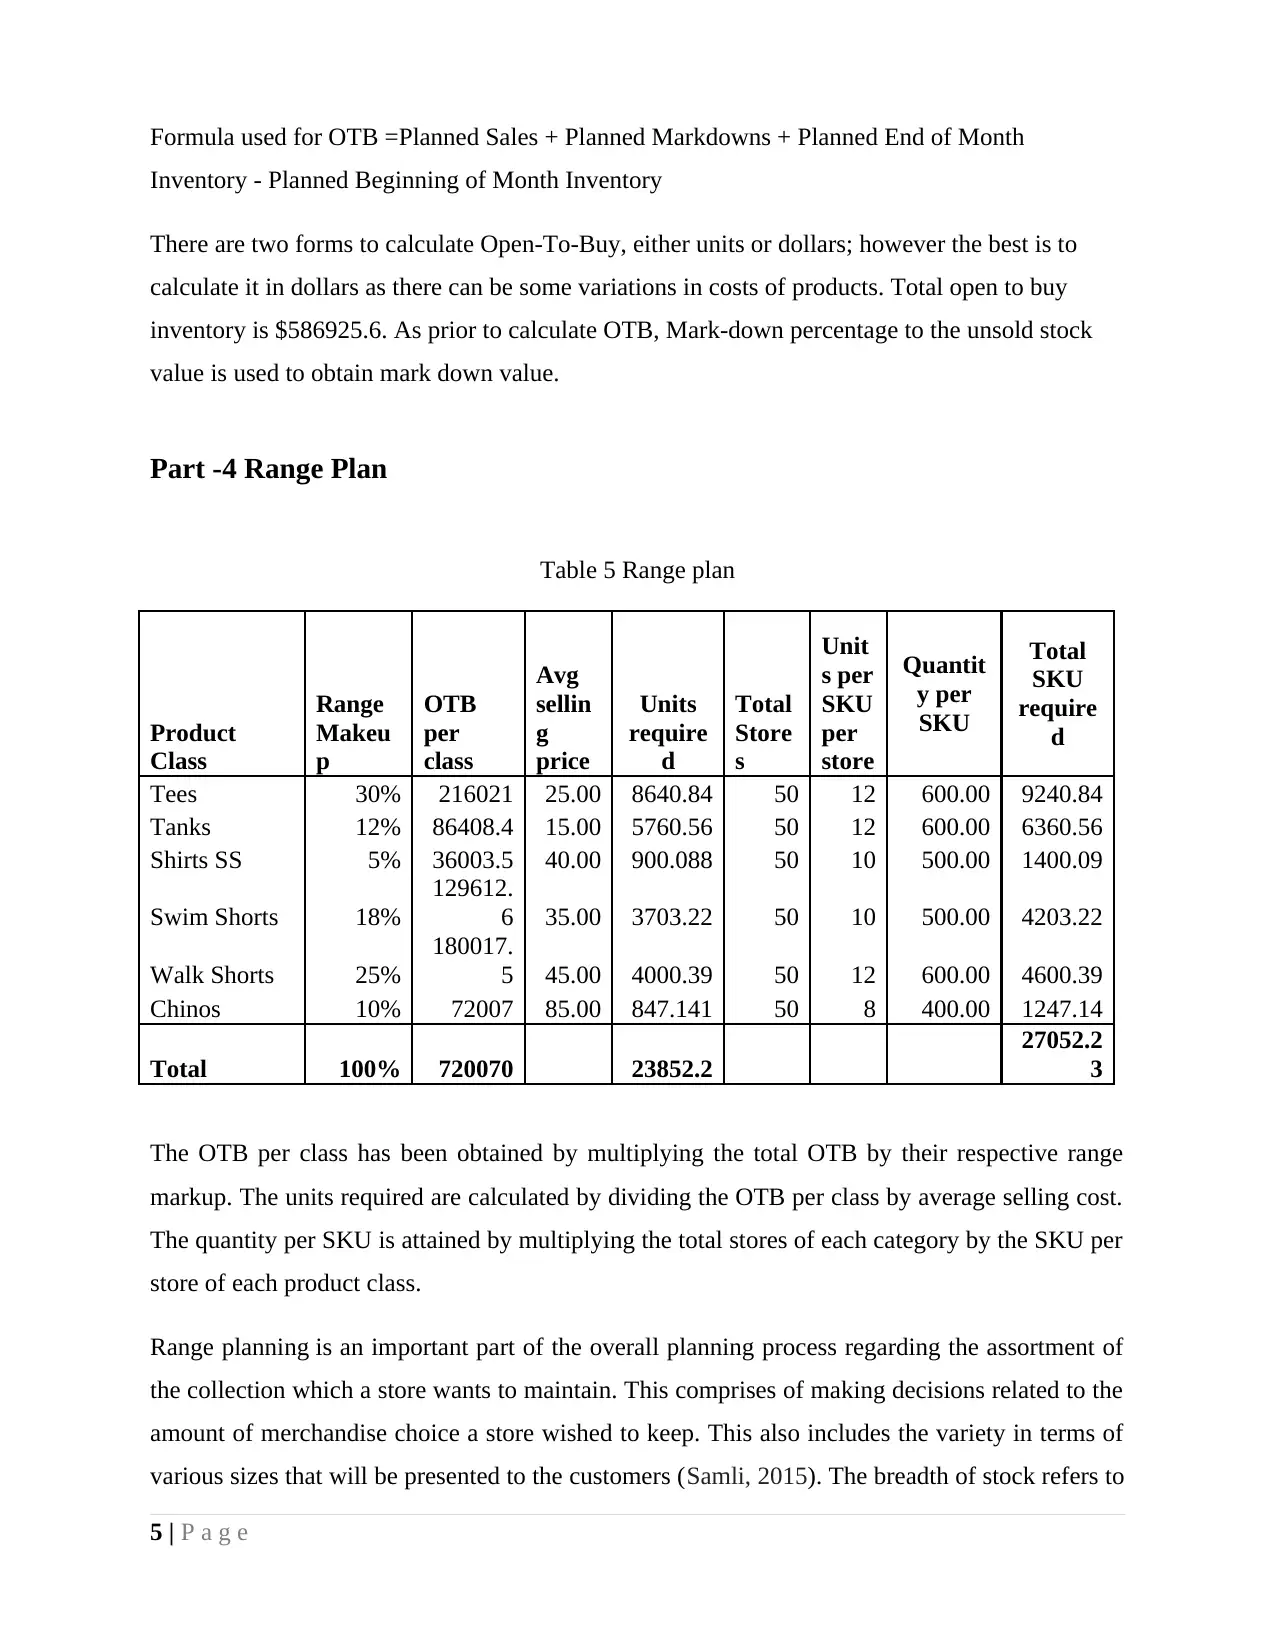
The OTB per class has been obtained by multiplying the total OTB by their respective range
markup. The units required are calculated by dividing the OTB per class by average selling cost.
The quantity per SKU is attained by multiplying the total stores of each category by the SKU per
store of each product class.
Range planning is an important part of the overall planning process regarding the assortment of
the collection which a store wants to maintain. This comprises of making decisions related to the
amount of merchandise choice a store wished to keep. This also includes the variety in terms of
various sizes that will be presented to the customers (Samli, 2015). The breadth of stock refers to
5 | P a g e
Inventory - Planned Beginning of Month Inventory
There are two forms to calculate Open-To-Buy, either units or dollars; however the best is to
calculate it in dollars as there can be some variations in costs of products. Total open to buy
inventory is $586925.6. As prior to calculate OTB, Mark-down percentage to the unsold stock
value is used to obtain mark down value.
Part -4 Range Plan
Table 5 Range plan
Product
Class
Range
Makeu
p
OTB
per
class
Avg
sellin
g
price
Units
require
d
Total
Store
s
Unit
s per
SKU
per
store
Quantit
y per
SKU
Total
SKU
require
d
Tees 30% 216021 25.00 8640.84 50 12 600.00 9240.84
Tanks 12% 86408.4 15.00 5760.56 50 12 600.00 6360.56
Shirts SS 5% 36003.5 40.00 900.088 50 10 500.00 1400.09
Swim Shorts 18%
129612.
6 35.00 3703.22 50 10 500.00 4203.22
Walk Shorts 25%
180017.
5 45.00 4000.39 50 12 600.00 4600.39
Chinos 10% 72007 85.00 847.141 50 8 400.00 1247.14
Total 100% 720070 23852.2
27052.2
3
The OTB per class has been obtained by multiplying the total OTB by their respective range
markup. The units required are calculated by dividing the OTB per class by average selling cost.
The quantity per SKU is attained by multiplying the total stores of each category by the SKU per
store of each product class.
Range planning is an important part of the overall planning process regarding the assortment of
the collection which a store wants to maintain. This comprises of making decisions related to the
amount of merchandise choice a store wished to keep. This also includes the variety in terms of
various sizes that will be presented to the customers (Samli, 2015). The breadth of stock refers to
5 | P a g e
Paraphrase This Document
Need a fresh take? Get an instant paraphrase of this document with our AI Paraphraser
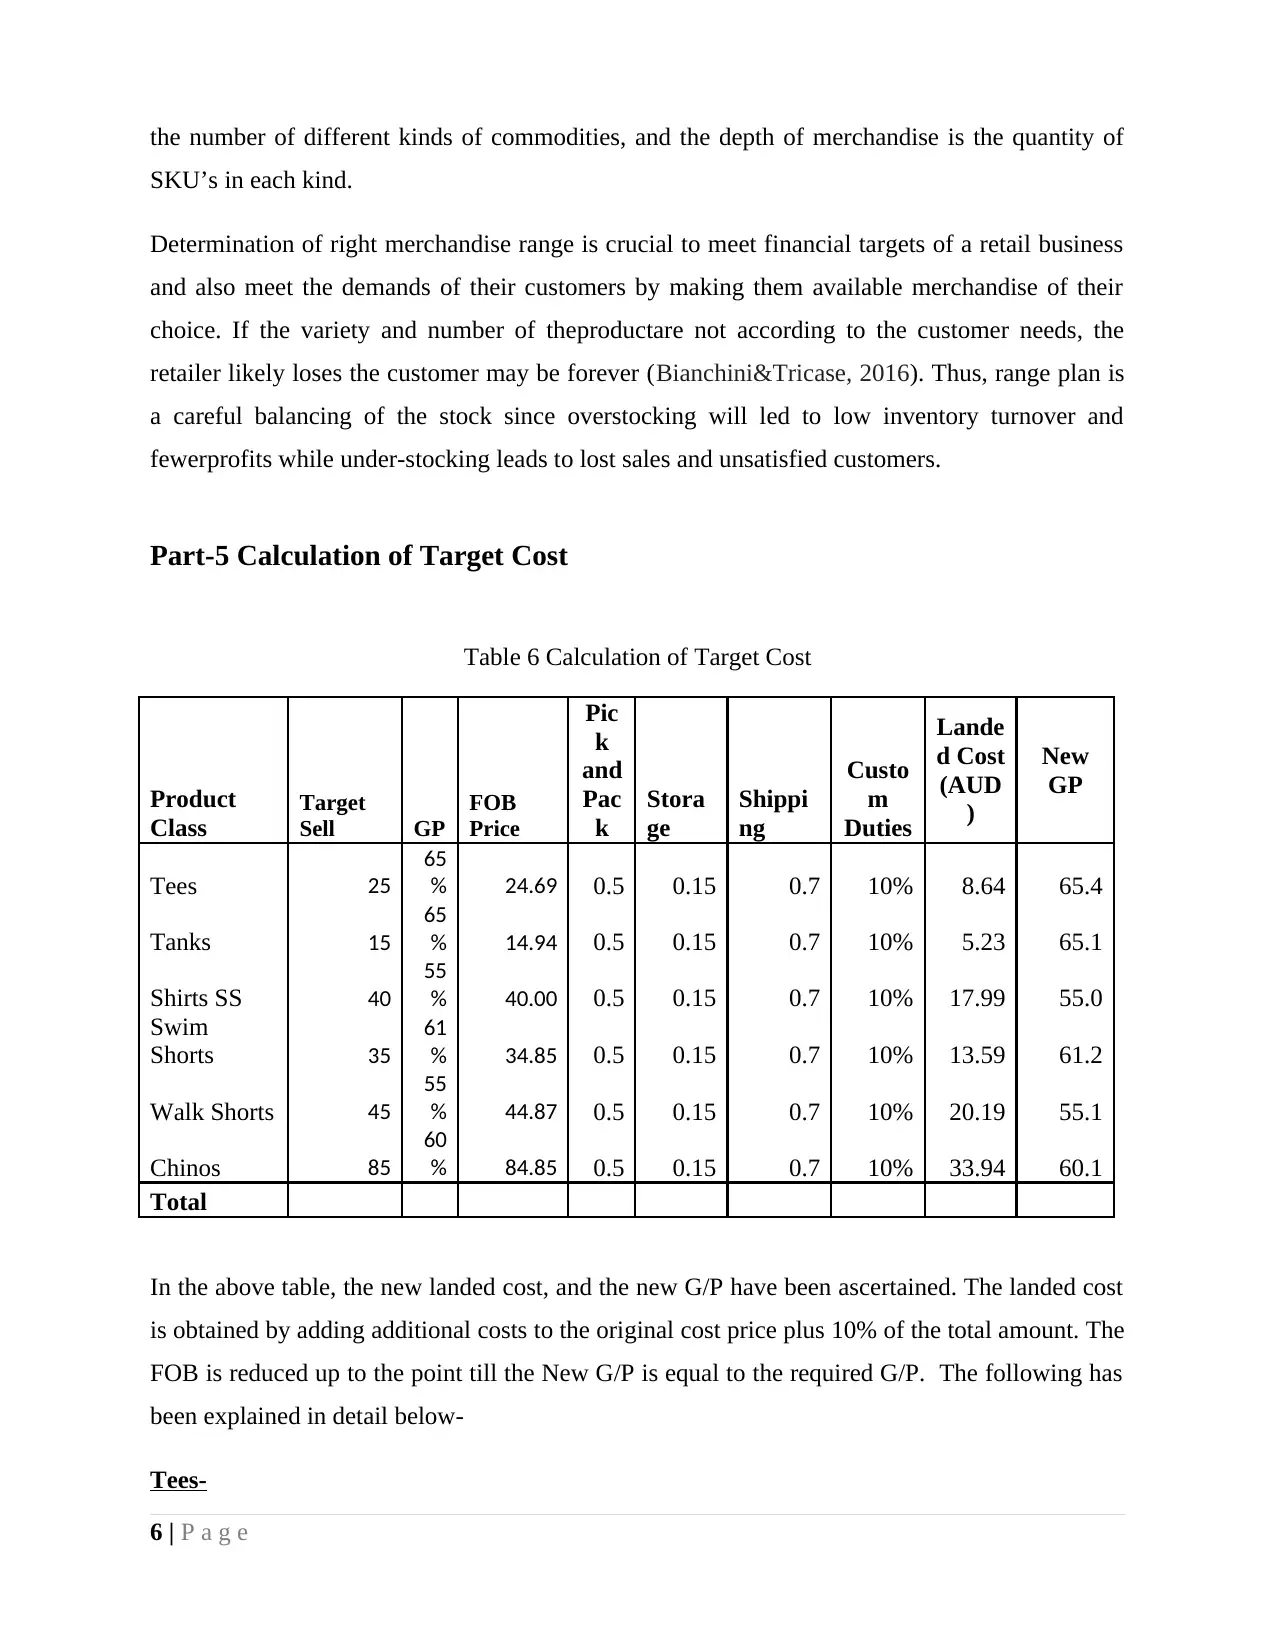
the number of different kinds of commodities, and the depth of merchandise is the quantity of
SKU’s in each kind.
Determination of right merchandise range is crucial to meet financial targets of a retail business
and also meet the demands of their customers by making them available merchandise of their
choice. If the variety and number of theproductare not according to the customer needs, the
retailer likely loses the customer may be forever (Bianchini&Tricase, 2016). Thus, range plan is
a careful balancing of the stock since overstocking will led to low inventory turnover and
fewerprofits while under-stocking leads to lost sales and unsatisfied customers.
Part-5 Calculation of Target Cost
Table 6 Calculation of Target Cost
Product
Class
Target
Sell GP
FOB
Price
Pic
k
and
Pac
k
Stora
ge
Shippi
ng
Custo
m
Duties
Lande
d Cost
(AUD
)
New
GP
Tees 25
65
% 24.69 0.5 0.15 0.7 10% 8.64 65.4
Tanks 15
65
% 14.94 0.5 0.15 0.7 10% 5.23 65.1
Shirts SS 40
55
% 40.00 0.5 0.15 0.7 10% 17.99 55.0
Swim
Shorts 35
61
% 34.85 0.5 0.15 0.7 10% 13.59 61.2
Walk Shorts 45
55
% 44.87 0.5 0.15 0.7 10% 20.19 55.1
Chinos 85
60
% 84.85 0.5 0.15 0.7 10% 33.94 60.1
Total
In the above table, the new landed cost, and the new G/P have been ascertained. The landed cost
is obtained by adding additional costs to the original cost price plus 10% of the total amount. The
FOB is reduced up to the point till the New G/P is equal to the required G/P. The following has
been explained in detail below-
Tees-
6 | P a g e
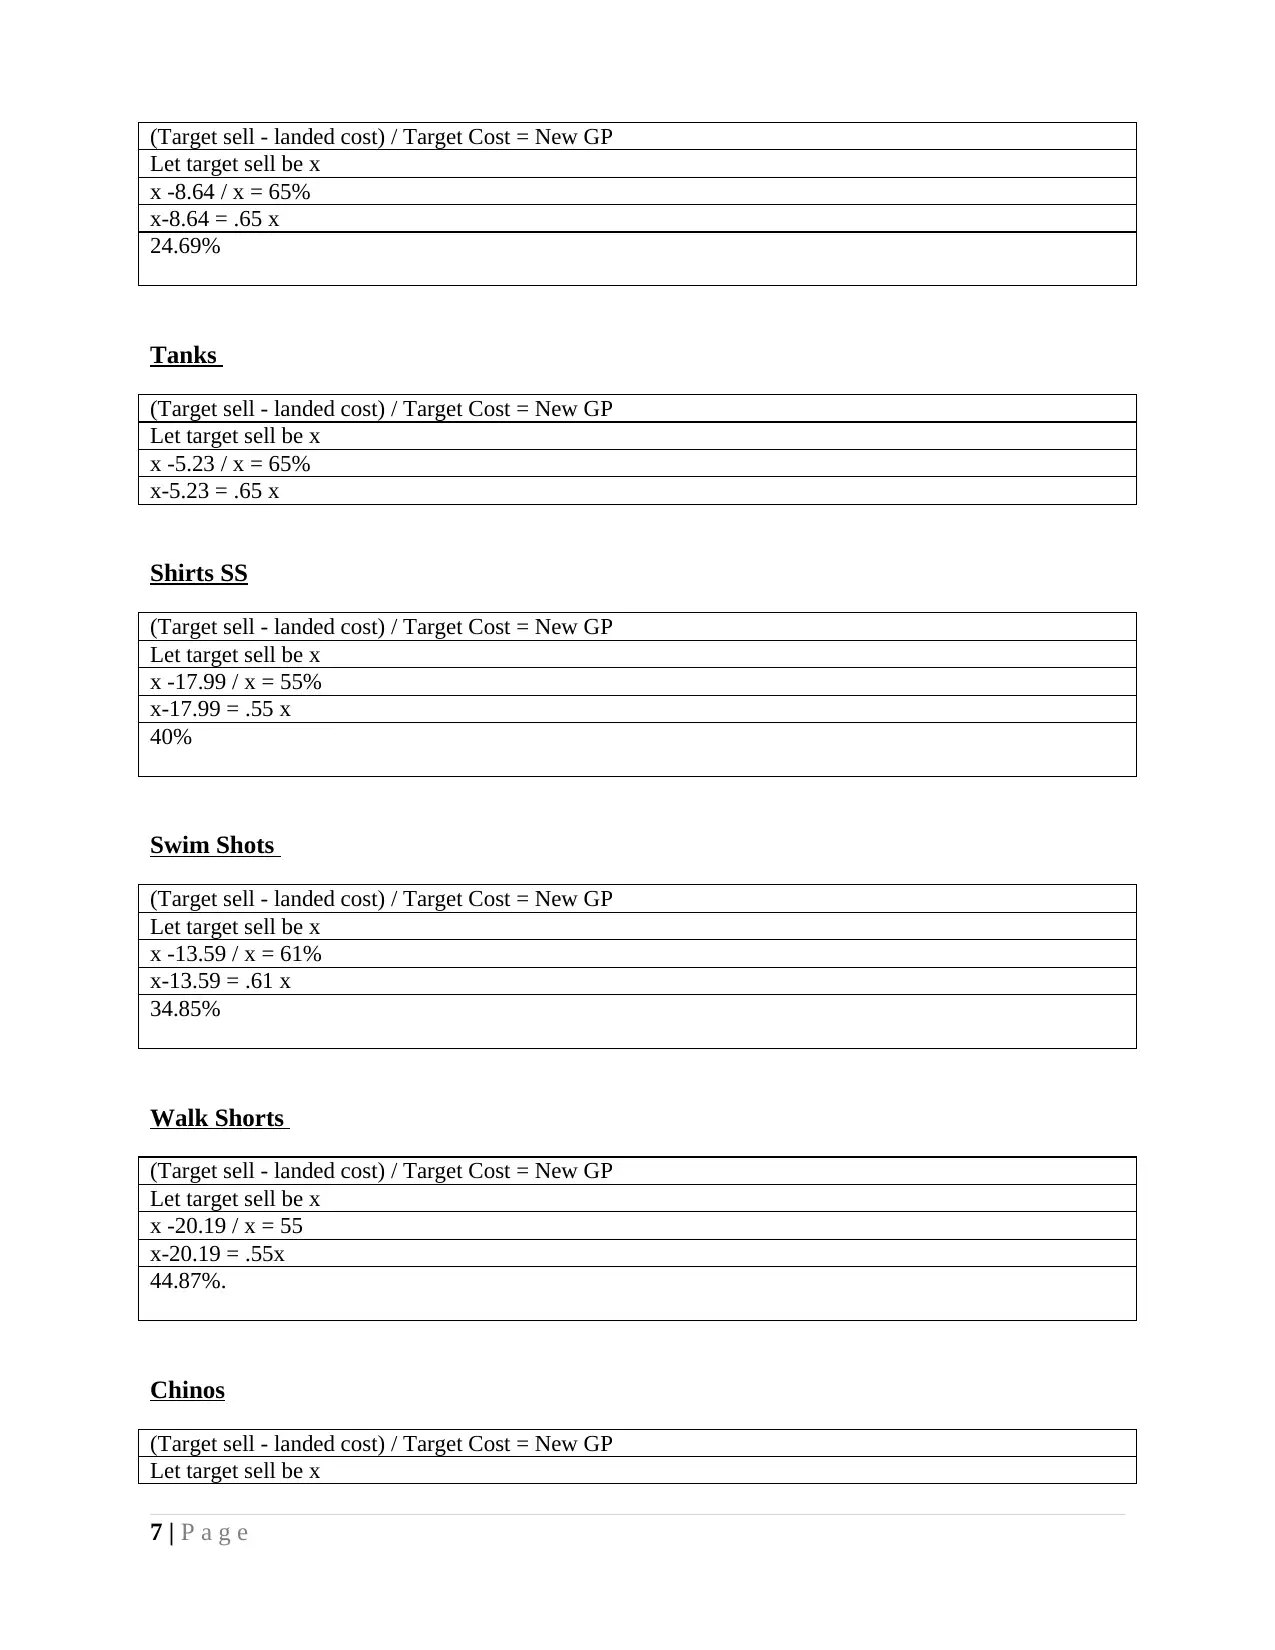
(Target sell - landed cost) / Target Cost = New GP
Let target sell be x
x -8.64 / x = 65%
x-8.64 = .65 x
24.69%
Tanks
(Target sell - landed cost) / Target Cost = New GP
Let target sell be x
x -5.23 / x = 65%
x-5.23 = .65 x
Shirts SS
(Target sell - landed cost) / Target Cost = New GP
Let target sell be x
x -17.99 / x = 55%
x-17.99 = .55 x
40%
Swim Shots
(Target sell - landed cost) / Target Cost = New GP
Let target sell be x
x -13.59 / x = 61%
x-13.59 = .61 x
34.85%
Walk Shorts
(Target sell - landed cost) / Target Cost = New GP
Let target sell be x
x -20.19 / x = 55
x-20.19 = .55x
44.87%.
Chinos
(Target sell - landed cost) / Target Cost = New GP
Let target sell be x
7 | P a g e
Let target sell be x
x -8.64 / x = 65%
x-8.64 = .65 x
24.69%
Tanks
(Target sell - landed cost) / Target Cost = New GP
Let target sell be x
x -5.23 / x = 65%
x-5.23 = .65 x
Shirts SS
(Target sell - landed cost) / Target Cost = New GP
Let target sell be x
x -17.99 / x = 55%
x-17.99 = .55 x
40%
Swim Shots
(Target sell - landed cost) / Target Cost = New GP
Let target sell be x
x -13.59 / x = 61%
x-13.59 = .61 x
34.85%
Walk Shorts
(Target sell - landed cost) / Target Cost = New GP
Let target sell be x
x -20.19 / x = 55
x-20.19 = .55x
44.87%.
Chinos
(Target sell - landed cost) / Target Cost = New GP
Let target sell be x
7 | P a g e
⊘ This is a preview!⊘
Do you want full access?
Subscribe today to unlock all pages.
Trusted by 1+ million students worldwide
x -33.94 / x = 60%
x-33.94 = .60 x
84.85%.
Part-6 Monthly Phasing
Table 7 Monthly Phasing
Product
Class Cost Sell GP Units
Total
Cost
Total
retail
Tees 8.64 25 65% 8641 74613.65 216021
Tanks 5.23 15 65% 5761 30098.93 86408.4
Shirts SS 17.99 40 55% 900 16188.07 36003.5
Swim
Shorts 13.59 35 61% 3703 50308.2 129612.6
Walk Shorts 20.19 45 55% 4000 80747.85 180017.5
Chinos 33.94 85 60% 847 28747.74 72007
Total 23852 280704.44 720070
October November December
Produ
ct
Class
U
nit
s
Total
Cost
$
Total
retail
Uni
t Cost
Reta
il
Un
it
Un
its Cost
Ret
ail
Uni
t
Co
st
Ret
ail
Tees
86
41
74613
.65
2160
21
216
0.2
5
1865
3.41
3
5400
5.25
34
56.
4
34
56.
4
2984
5.46
864
08.4
302
4.3
5
261
14.
8
756
07.
4
Tanks
57
61
30098
.93
8640
8.4
144
0.2
5
7524
.732
5
2160
2.1
23
04.
4
23
04.
4
1203
9.572
345
63.3
6
201
6.3
5
105
34.
6
302
42.
9
Shirts
SS
90
0
16188
.07
3600
3.5 225
4047
.017
5
9000
.875
36
0
36
0
6475.
228
144
01.4 315
566
5.8
2
126
01.
2
Swim
Shorts
37
03
50308
.2
1296
12.6
925
.75
1257
7.05
3240
3.15
14
81.
2
14
81.
2
2012
3.28
518
45.0
4
129
6.0
5
176
07.
9
453
64.
4
Walk
Shorts
40
00
80747
.85
1800
17.5
100
0
2018
6.96
3
4500
4.37
5
16
00
16
00
3229
9.14
720
07
140
0
282
61.
7
630
06.
1
Chinos
84
7
28747
.74
7200
7
211
.75
7186
.935
1800
1.75
33
8.8
33
8.8
1149
9.096
288
02.8
296
.45
100
61.
7
252
02.
5
8 | P a g e
Paraphrase This Document
Need a fresh take? Get an instant paraphrase of this document with our AI Paraphraser
Total
23
85
2
28070
4.44
7200
70
596
3
7017
6.11
1800
17.5
95
40.
8
95
40.
8
1122
81.77
6
288
028
834
8.2
982
46.
6
252
025
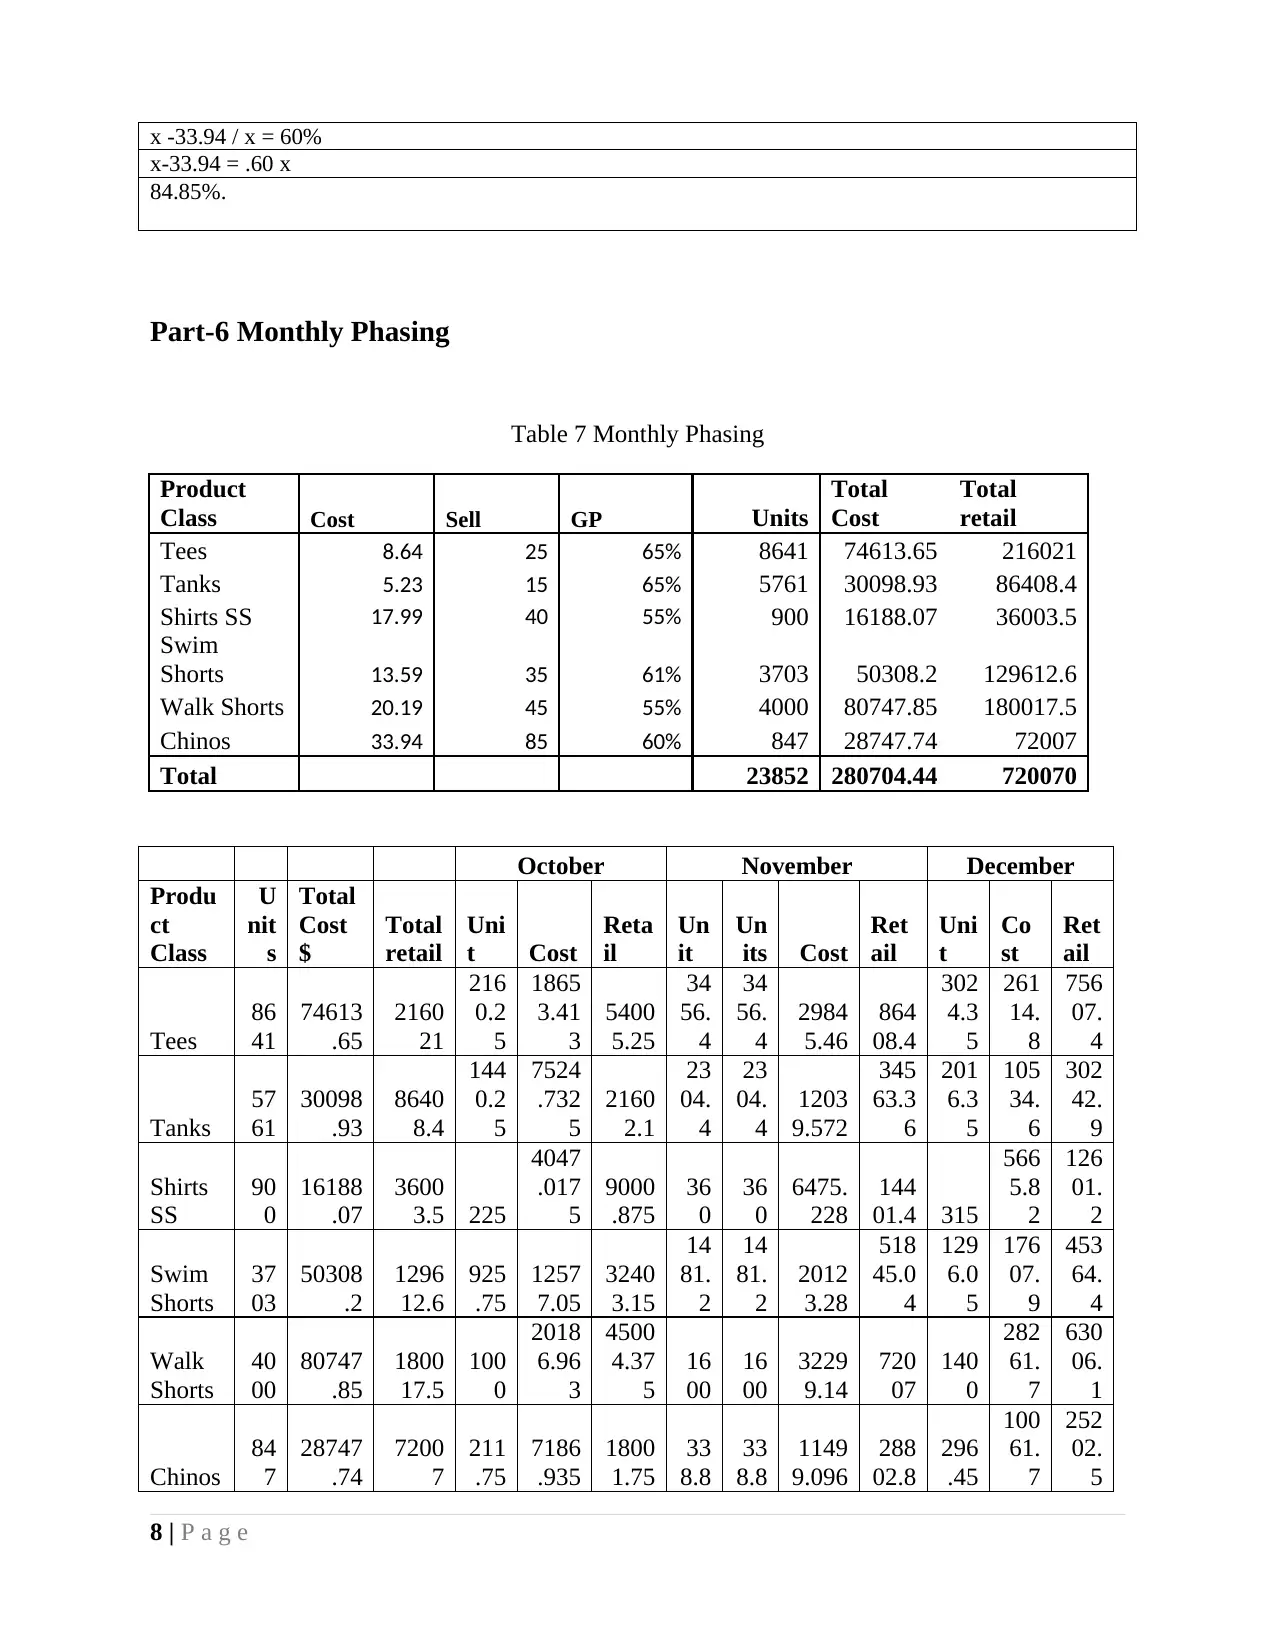
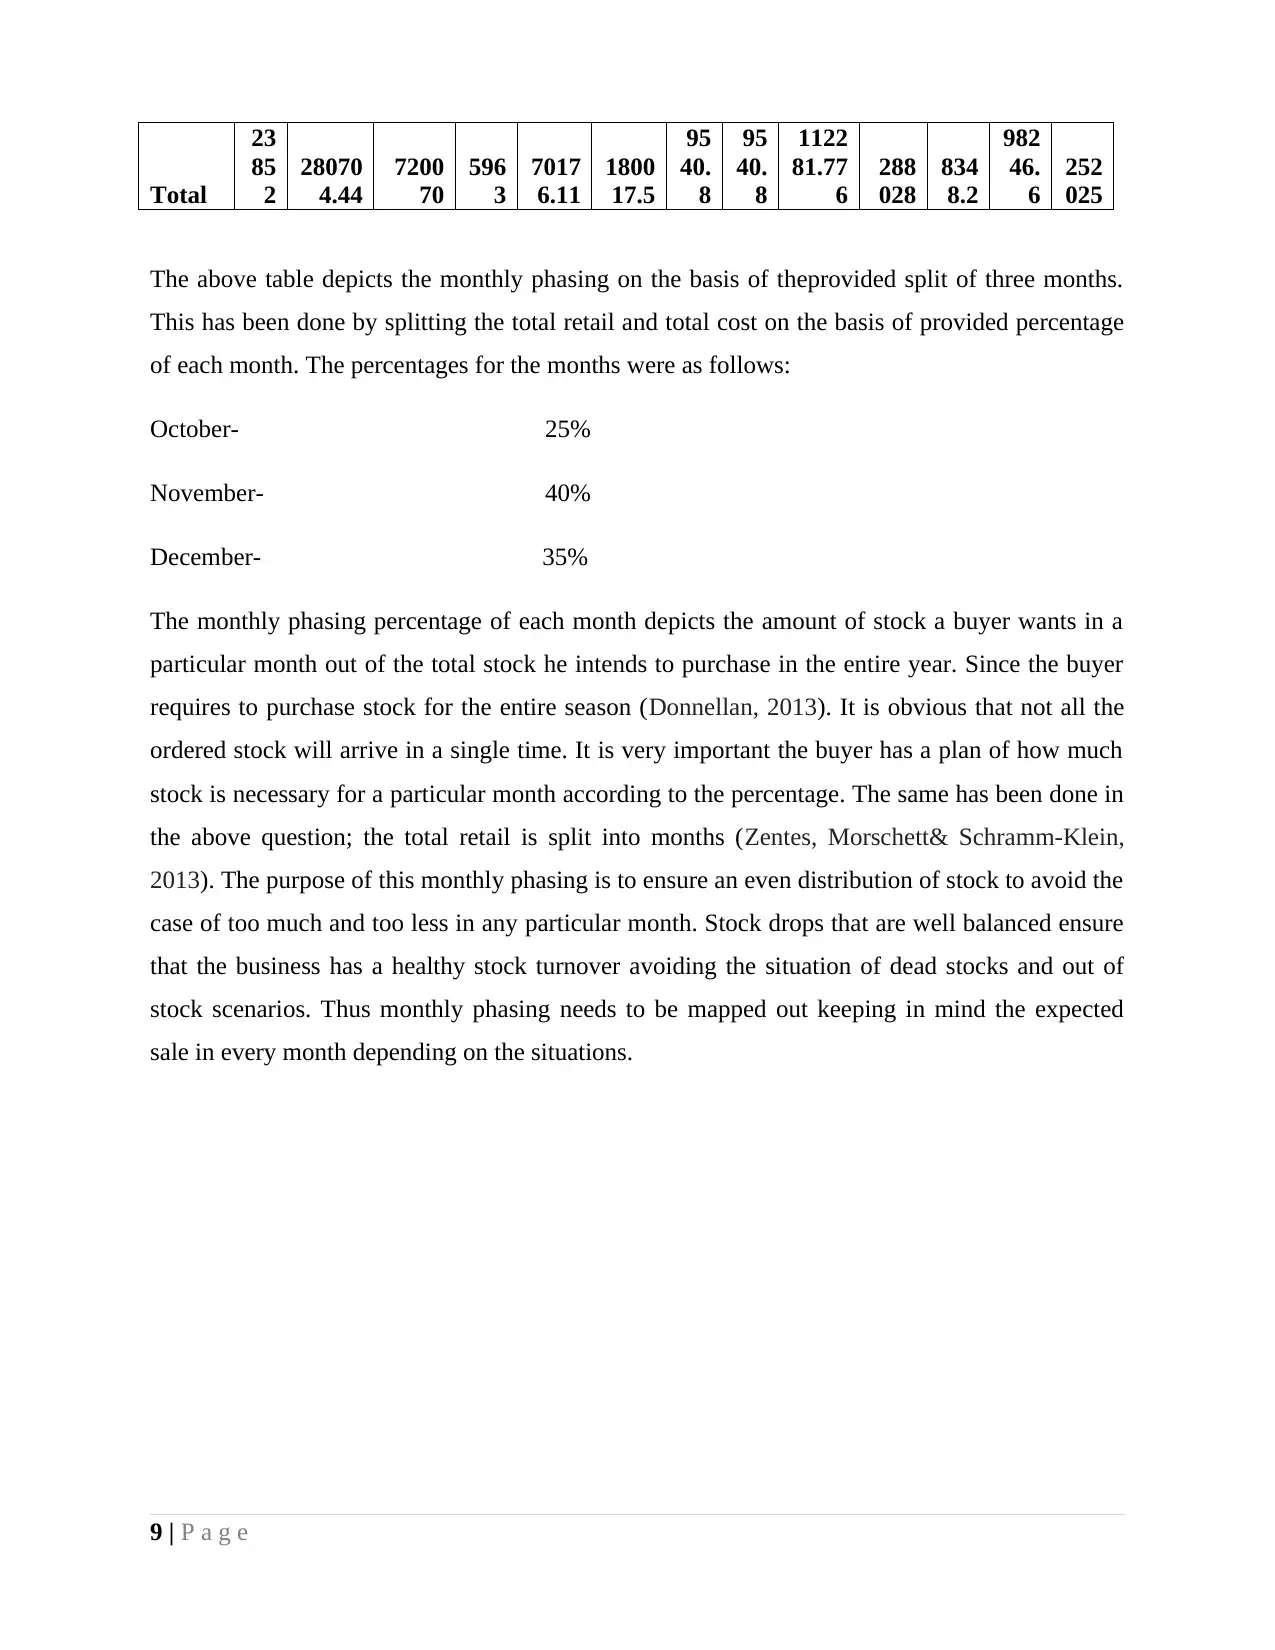
The above table depicts the monthly phasing on the basis of theprovided split of three months.
This has been done by splitting the total retail and total cost on the basis of provided percentage
of each month. The percentages for the months were as follows:
October- 25%
November- 40%
December- 35%
The monthly phasing percentage of each month depicts the amount of stock a buyer wants in a
particular month out of the total stock he intends to purchase in the entire year. Since the buyer
requires to purchase stock for the entire season (Donnellan, 2013). It is obvious that not all the
ordered stock will arrive in a single time. It is very important the buyer has a plan of how much
stock is necessary for a particular month according to the percentage. The same has been done in
the above question; the total retail is split into months (Zentes, Morschett& Schramm-Klein,
2013). The purpose of this monthly phasing is to ensure an even distribution of stock to avoid the
case of too much and too less in any particular month. Stock drops that are well balanced ensure
that the business has a healthy stock turnover avoiding the situation of dead stocks and out of
stock scenarios. Thus monthly phasing needs to be mapped out keeping in mind the expected
sale in every month depending on the situations.
9 | P a g e
23
85
2
28070
4.44
7200
70
596
3
7017
6.11
1800
17.5
95
40.
8
95
40.
8
1122
81.77
6
288
028
834
8.2
982
46.
6
252
025
The above table depicts the monthly phasing on the basis of theprovided split of three months.
This has been done by splitting the total retail and total cost on the basis of provided percentage
of each month. The percentages for the months were as follows:
October- 25%
November- 40%
December- 35%
The monthly phasing percentage of each month depicts the amount of stock a buyer wants in a
particular month out of the total stock he intends to purchase in the entire year. Since the buyer
requires to purchase stock for the entire season (Donnellan, 2013). It is obvious that not all the
ordered stock will arrive in a single time. It is very important the buyer has a plan of how much
stock is necessary for a particular month according to the percentage. The same has been done in
the above question; the total retail is split into months (Zentes, Morschett& Schramm-Klein,
2013). The purpose of this monthly phasing is to ensure an even distribution of stock to avoid the
case of too much and too less in any particular month. Stock drops that are well balanced ensure
that the business has a healthy stock turnover avoiding the situation of dead stocks and out of
stock scenarios. Thus monthly phasing needs to be mapped out keeping in mind the expected
sale in every month depending on the situations.
9 | P a g e
References
Bianchini, A., &Tricase, M. (2016, April). From Financial Merchandise Planning to Supply
Chain Design and Execution. In Workshop on Business Models and ICT Technologies for
the Fashion Supply Chain (pp. 215-223). Springer, Cham.
Donnellan, J. (2013). Merchandise buying and management. A&C Black.
Fibre2Fashion.com (2017). Menswear is slowly picking up the pace. Retrieved on 2nd December
2017.from < http://www.fibre2fashion.com/industry-article/7467/menswear-slowly-
picking-up-pace>
Ma, S., Fildes, R., & Huang, T. (2016). Demand forecasting with high dimensional data: The
case of SKU retail sales forecasting with intra-and inter-category promotional
information. European Journal of Operational Research, 249(1), 245-257.
Samli, A. C. (2015). Developing a Merchandise Mix. In Coping with Retail Giants (pp. 161-
174). Palgrave Macmillan US.
The Balance (2017). Open-To-Buy Planning for Retailers. Retrieved on 2nd December
2017.from < https://www.thebalance.com/open-to-buy-planning-2890318>
Zentes, J., Morschett, D., & Schramm-Klein, H. (2017). Buying–Strategy and Concepts.
In Strategic Retail Management (pp. 377-397). Springer Fachmedien Wiesbaden.
10 | P a g e
⊘ This is a preview!⊘
Do you want full access?
Subscribe today to unlock all pages.
Trusted by 1+ million students worldwide
1 out of 12
Your All-in-One AI-Powered Toolkit for Academic Success.
+13062052269
info@desklib.com
Available 24*7 on WhatsApp / Email
![[object Object]](/_next/static/media/star-bottom.7253800d.svg)
Unlock your academic potential
Copyright © 2020–2026 A2Z Services. All Rights Reserved. Developed and managed by ZUCOL.