Investor Report: Financial Analysis of Macquarie Group (2018-2019)
VerifiedAdded on 2022/10/19
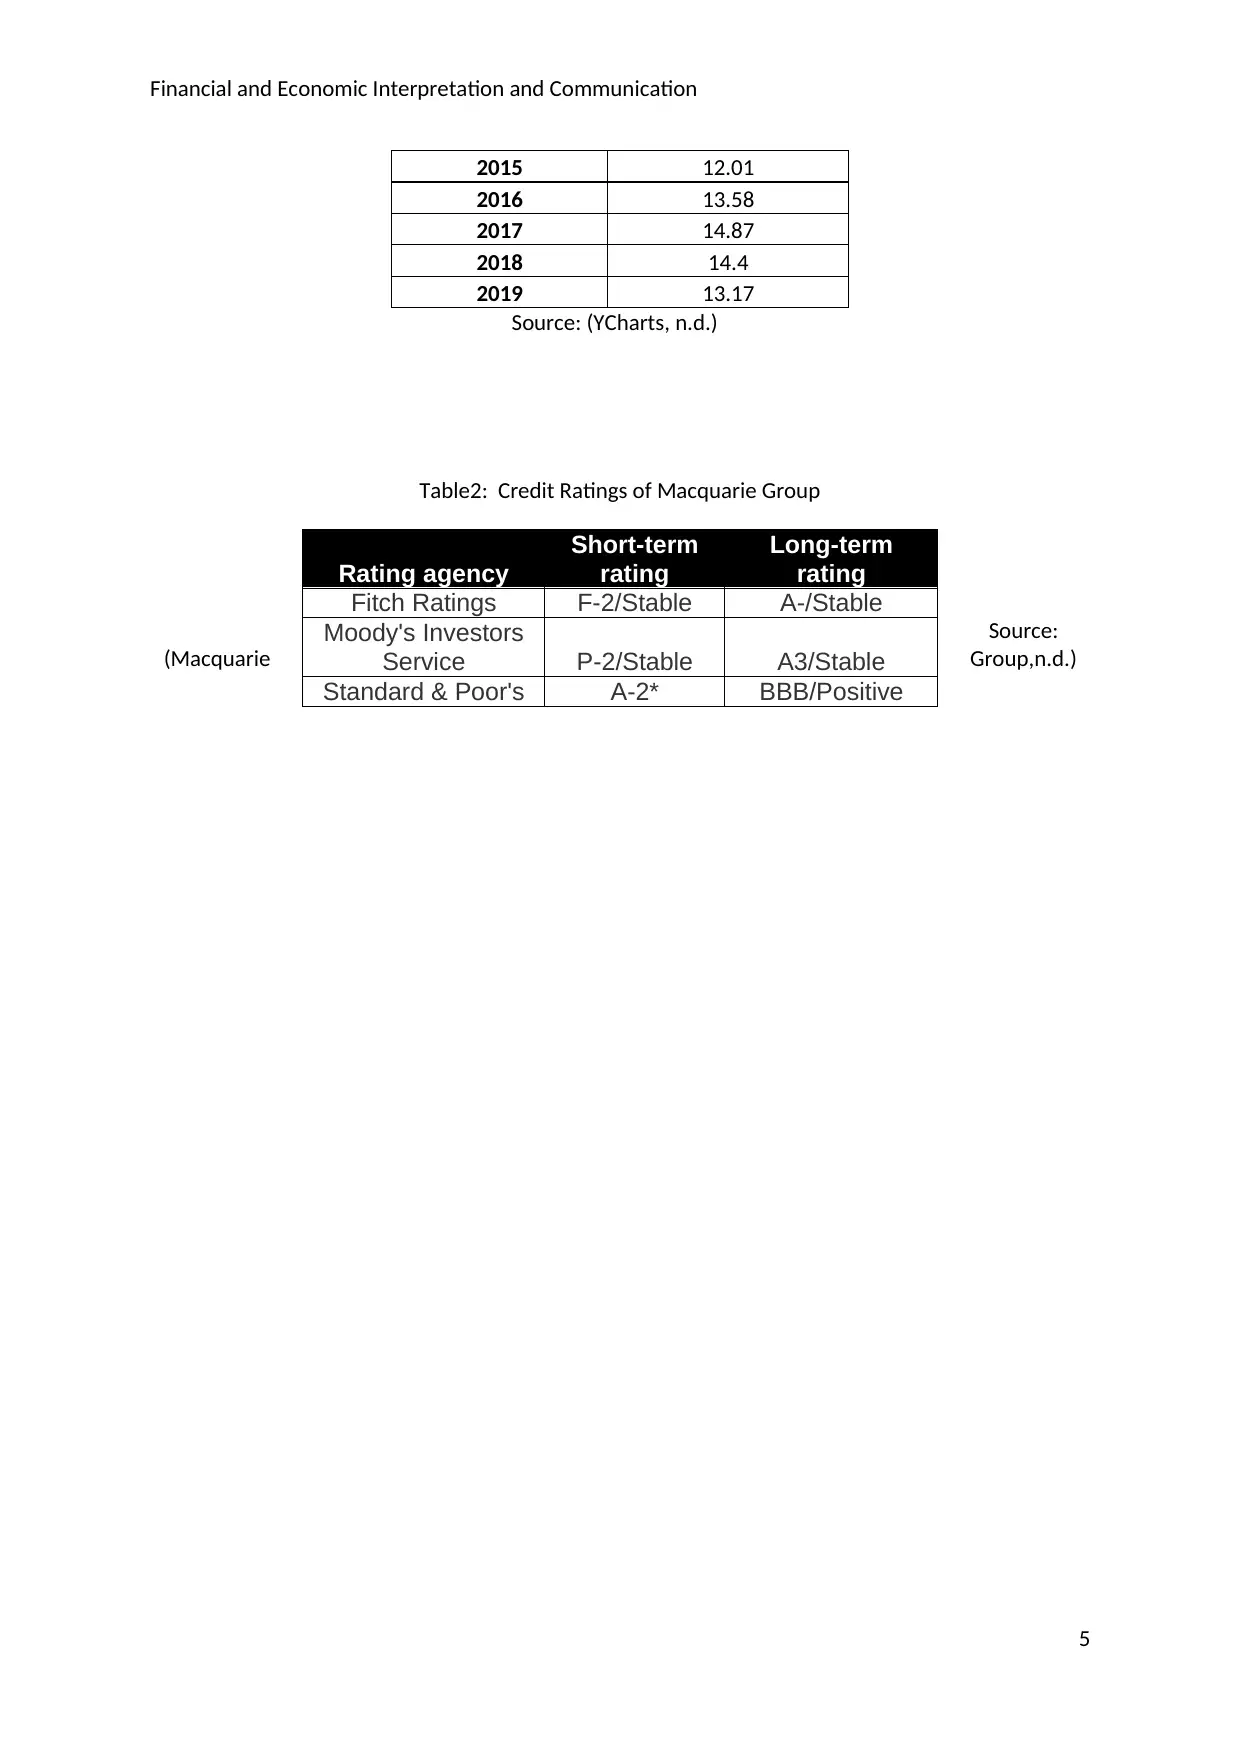
|5
|1428
|284
Report
AI Summary
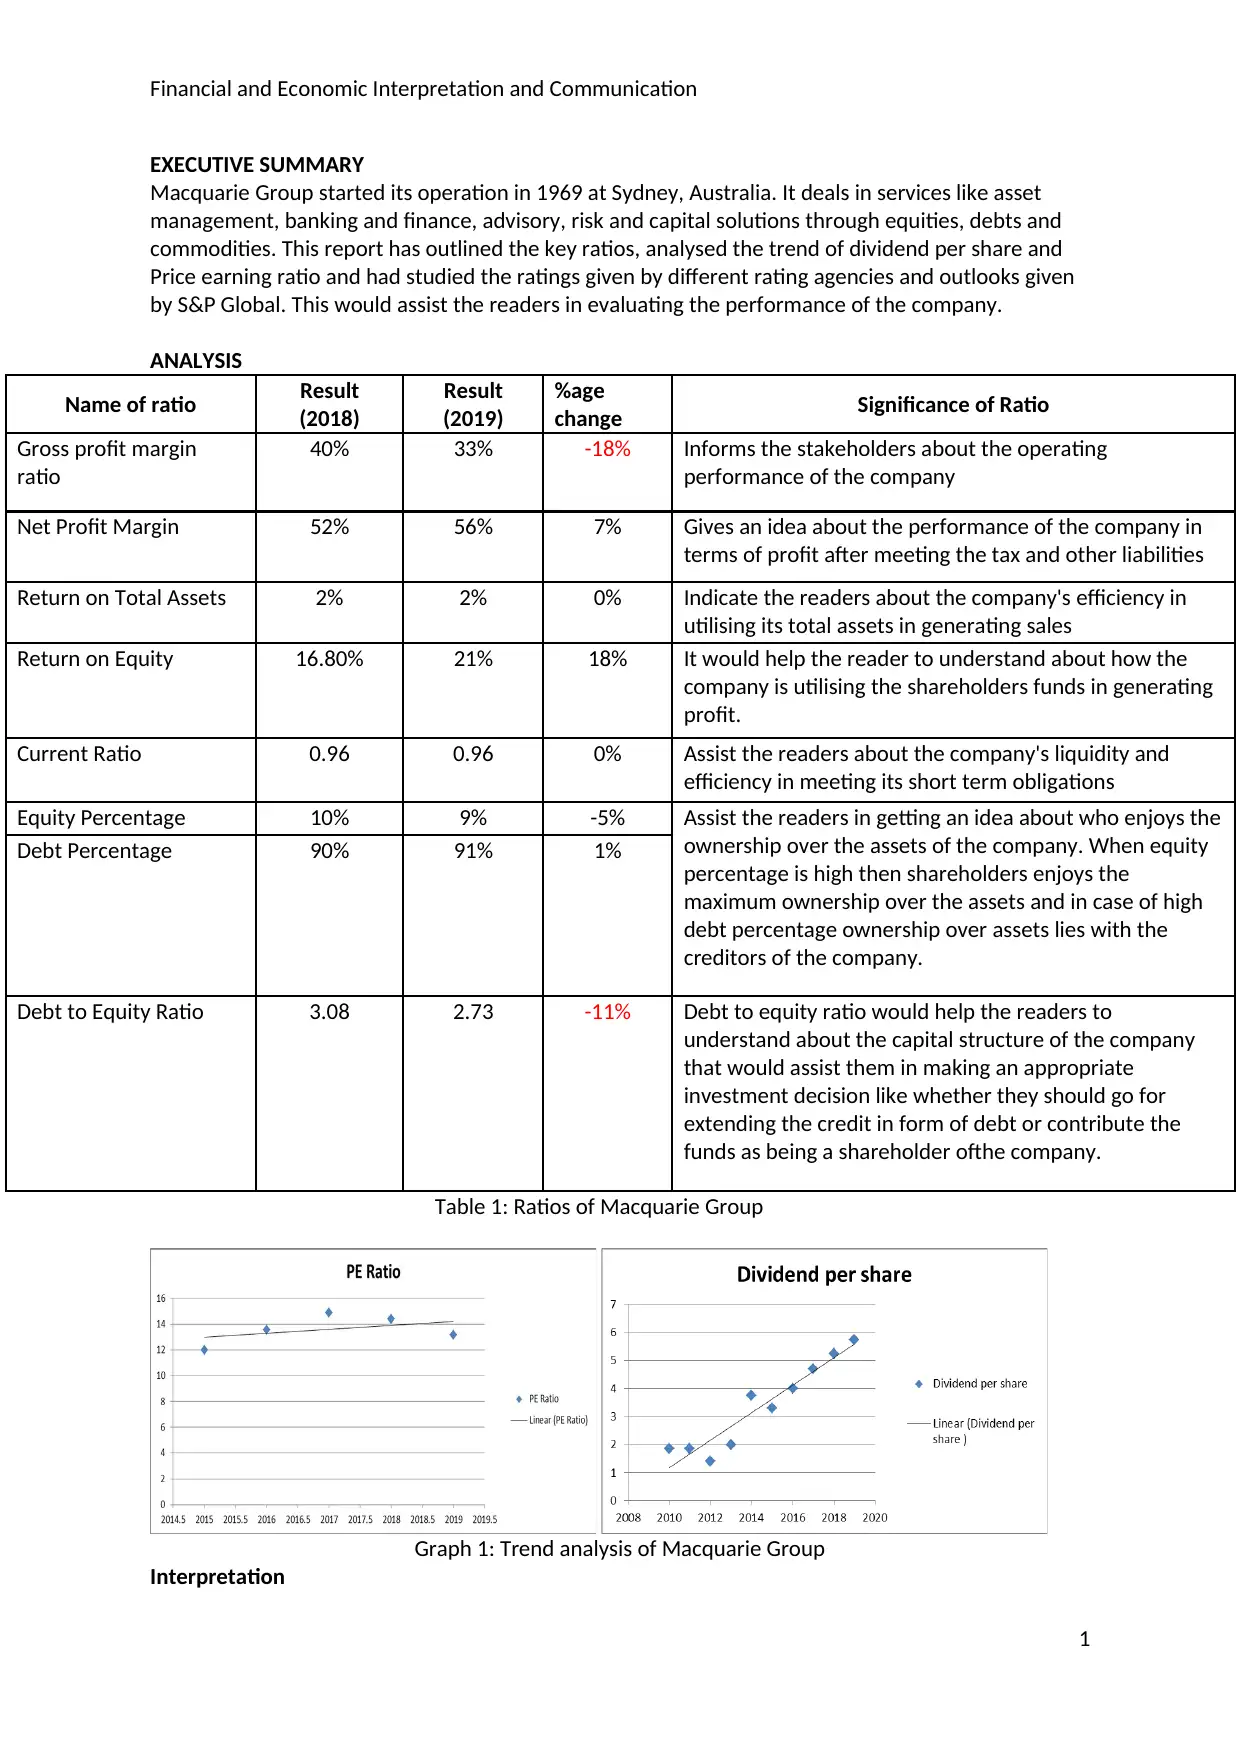
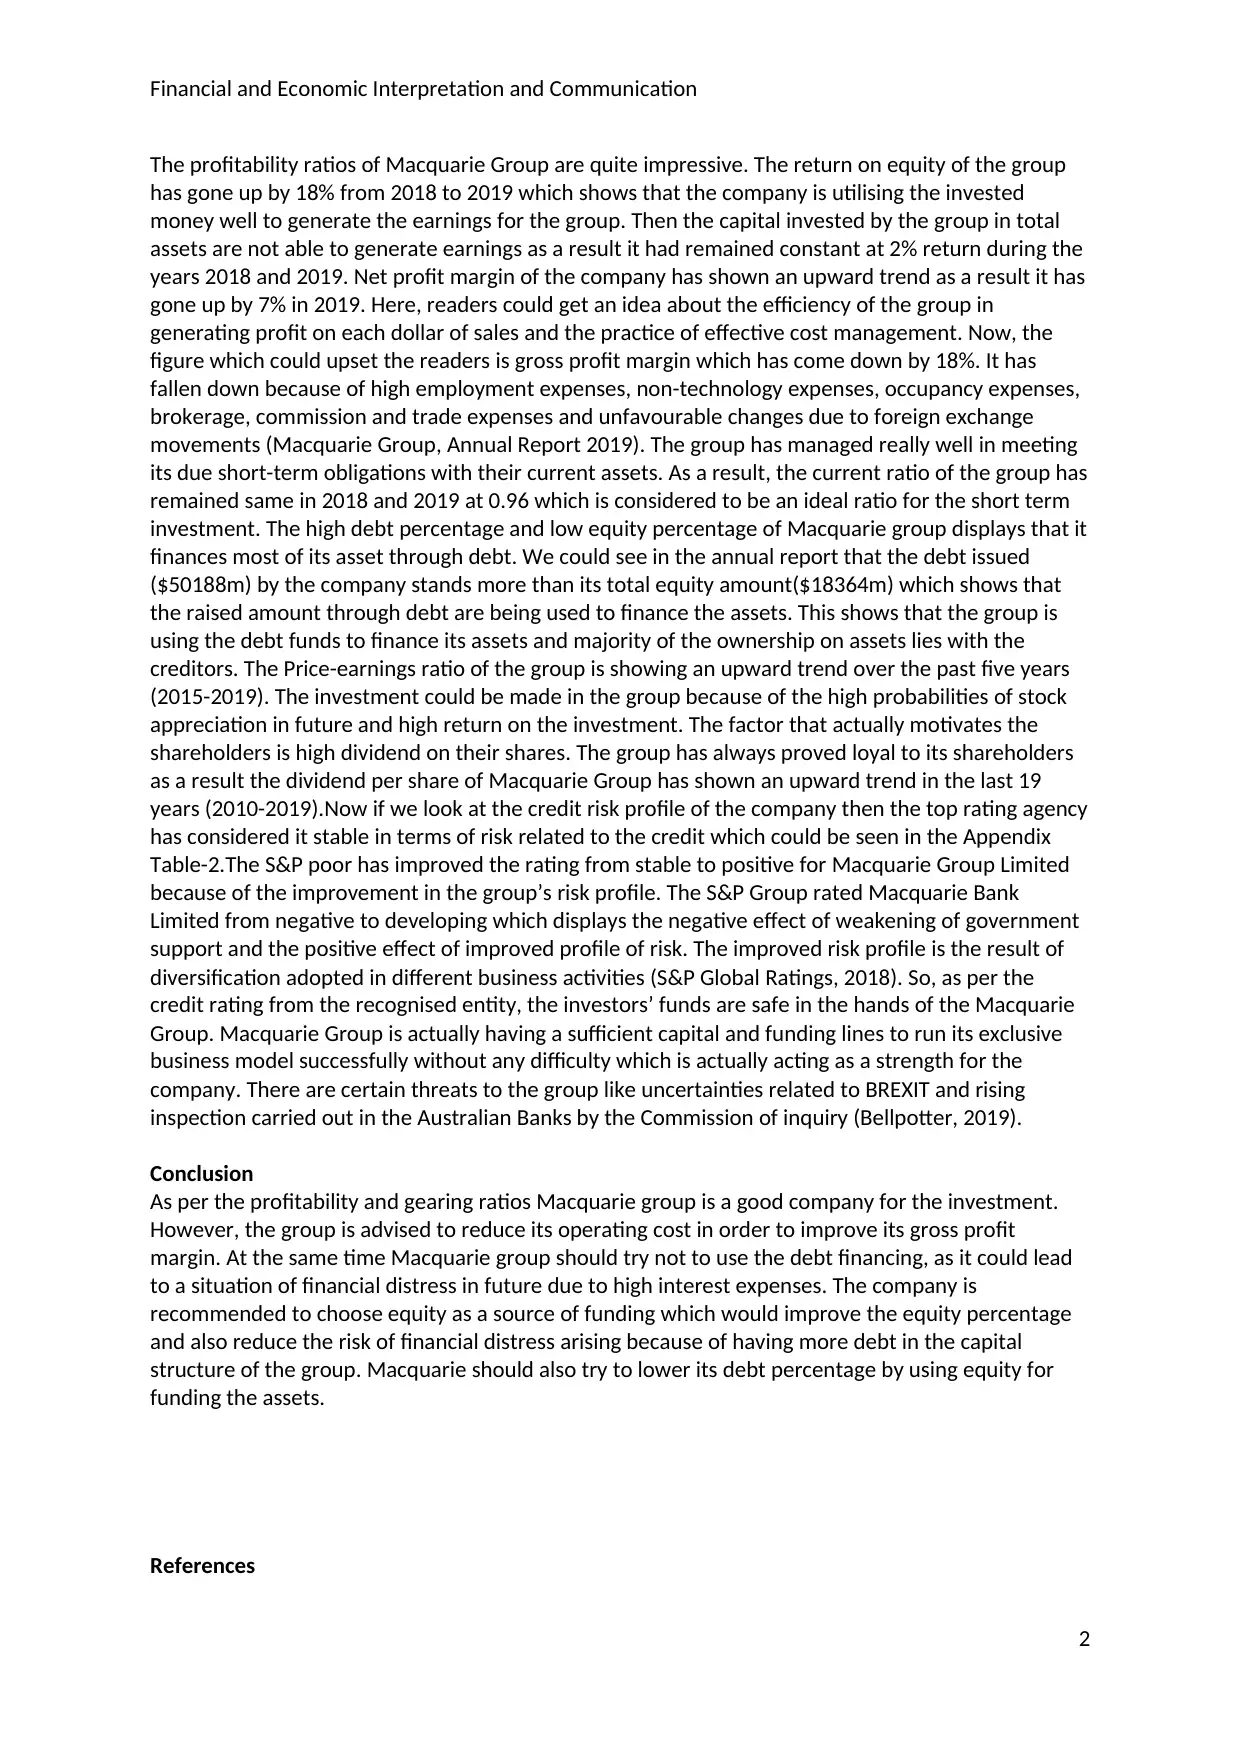
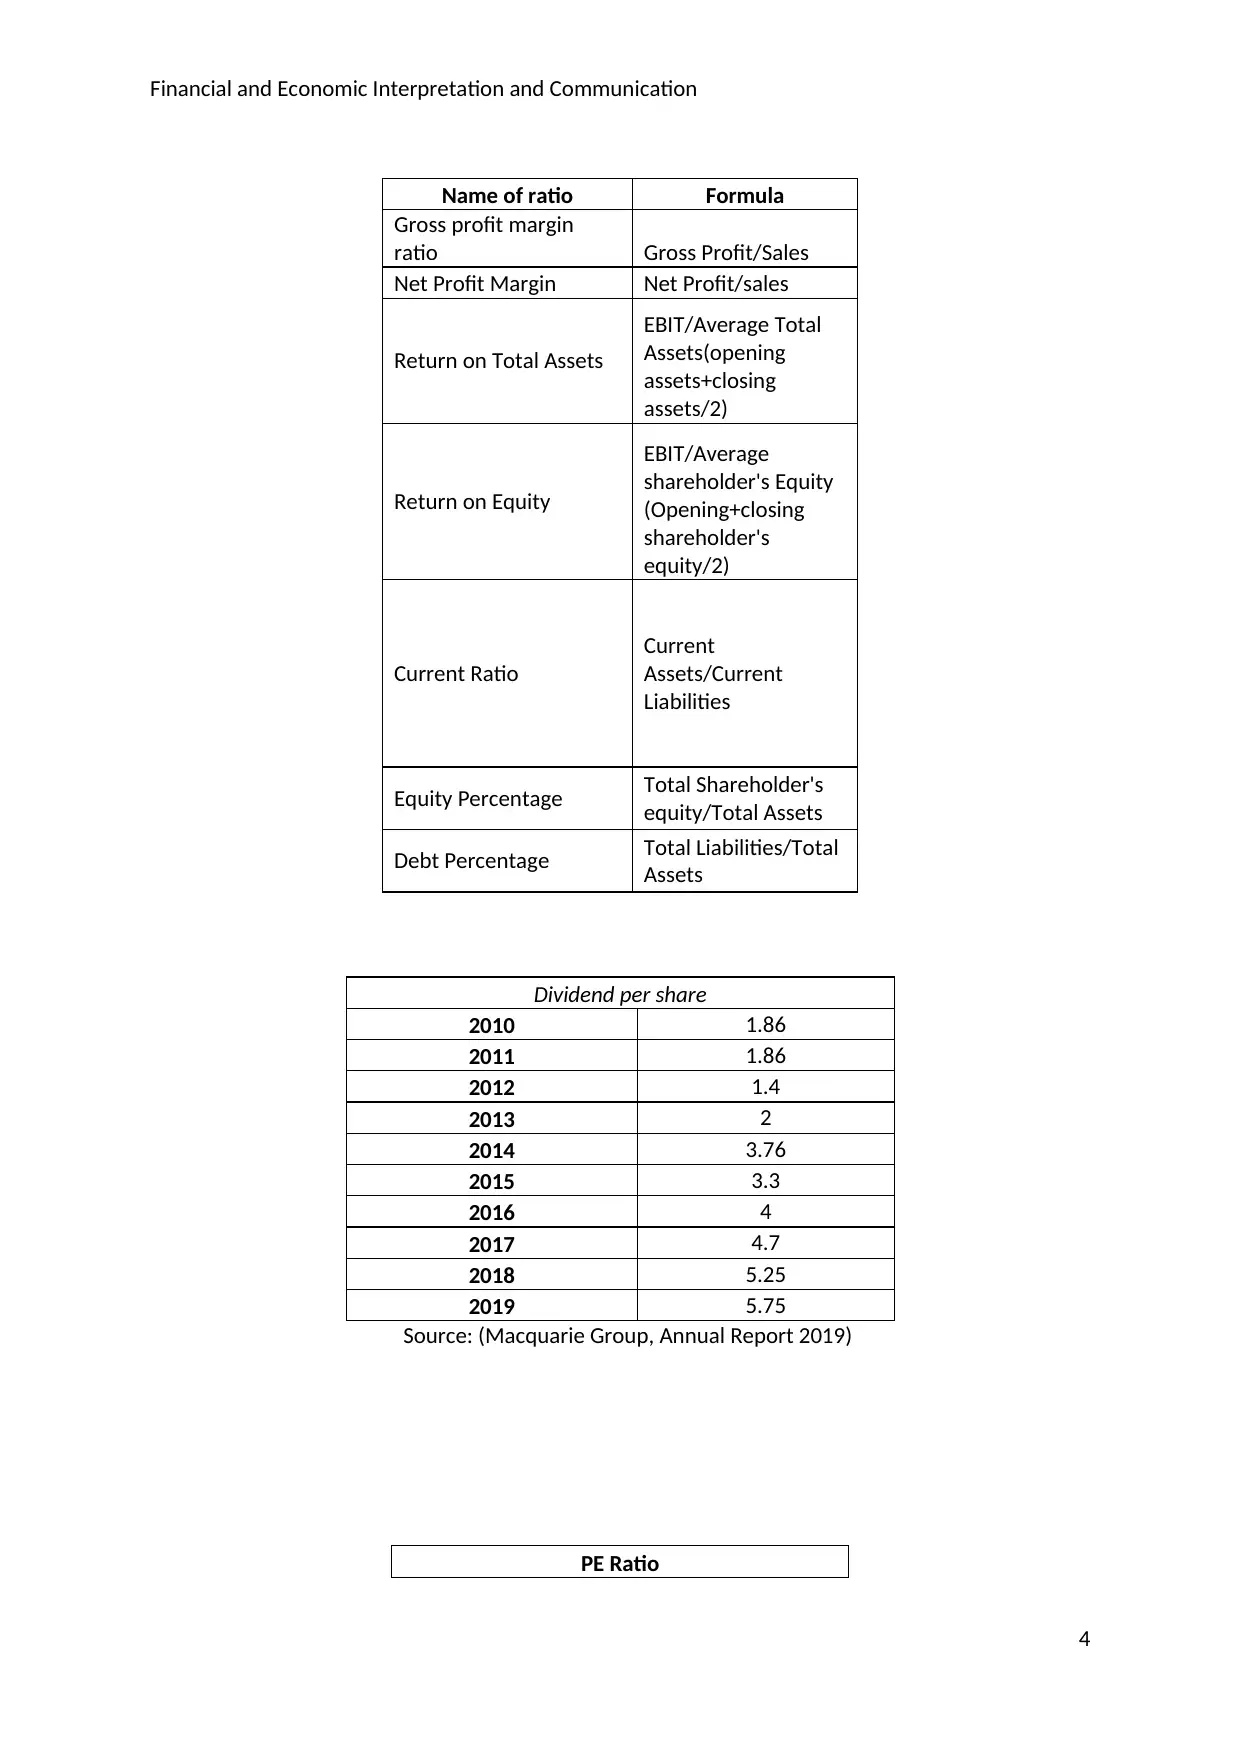
This report provides a detailed financial analysis of Macquarie Group, focusing on key performance indicators derived from its 2018 and 2019 annual reports. The analysis includes an examination of profitability ratios (gross profit margin, net profit margin, return on equity), efficiency ratios (return on total assets), liquidity ratios (current ratio), and capital structure ratios (debt-to-equity ratio). The report interprets the trends in these ratios, along with an analysis of dividend per share and price-earnings ratio over a five-year period. It also incorporates credit ratings and outlooks from S&P Global to assess the company's credit risk profile. The report highlights Macquarie Group's strengths, such as its impressive profitability and sufficient capital, while also addressing potential threats like Brexit uncertainties and rising regulatory scrutiny. The conclusion offers investment recommendations, suggesting areas for improvement like reducing operating costs and optimizing the capital structure to enhance financial health and shareholder value. The report provides an informed perspective for potential investors considering Macquarie Group.
1 out of 5
Related Documents


Your All-in-One AI-Powered Toolkit for Academic Success.
+13062052269
info@desklib.com
Available 24*7 on WhatsApp / Email
![[object Object]](/_next/static/media/star-bottom.7253800d.svg)
Copyright © 2020–2026 A2Z Services. All Rights Reserved. Developed and managed by ZUCOL.