Executive Remuneration and Performance Analysis: Macquarie Group
VerifiedAdded on 2021/06/14
|19
|3588
|19
Report
AI Summary
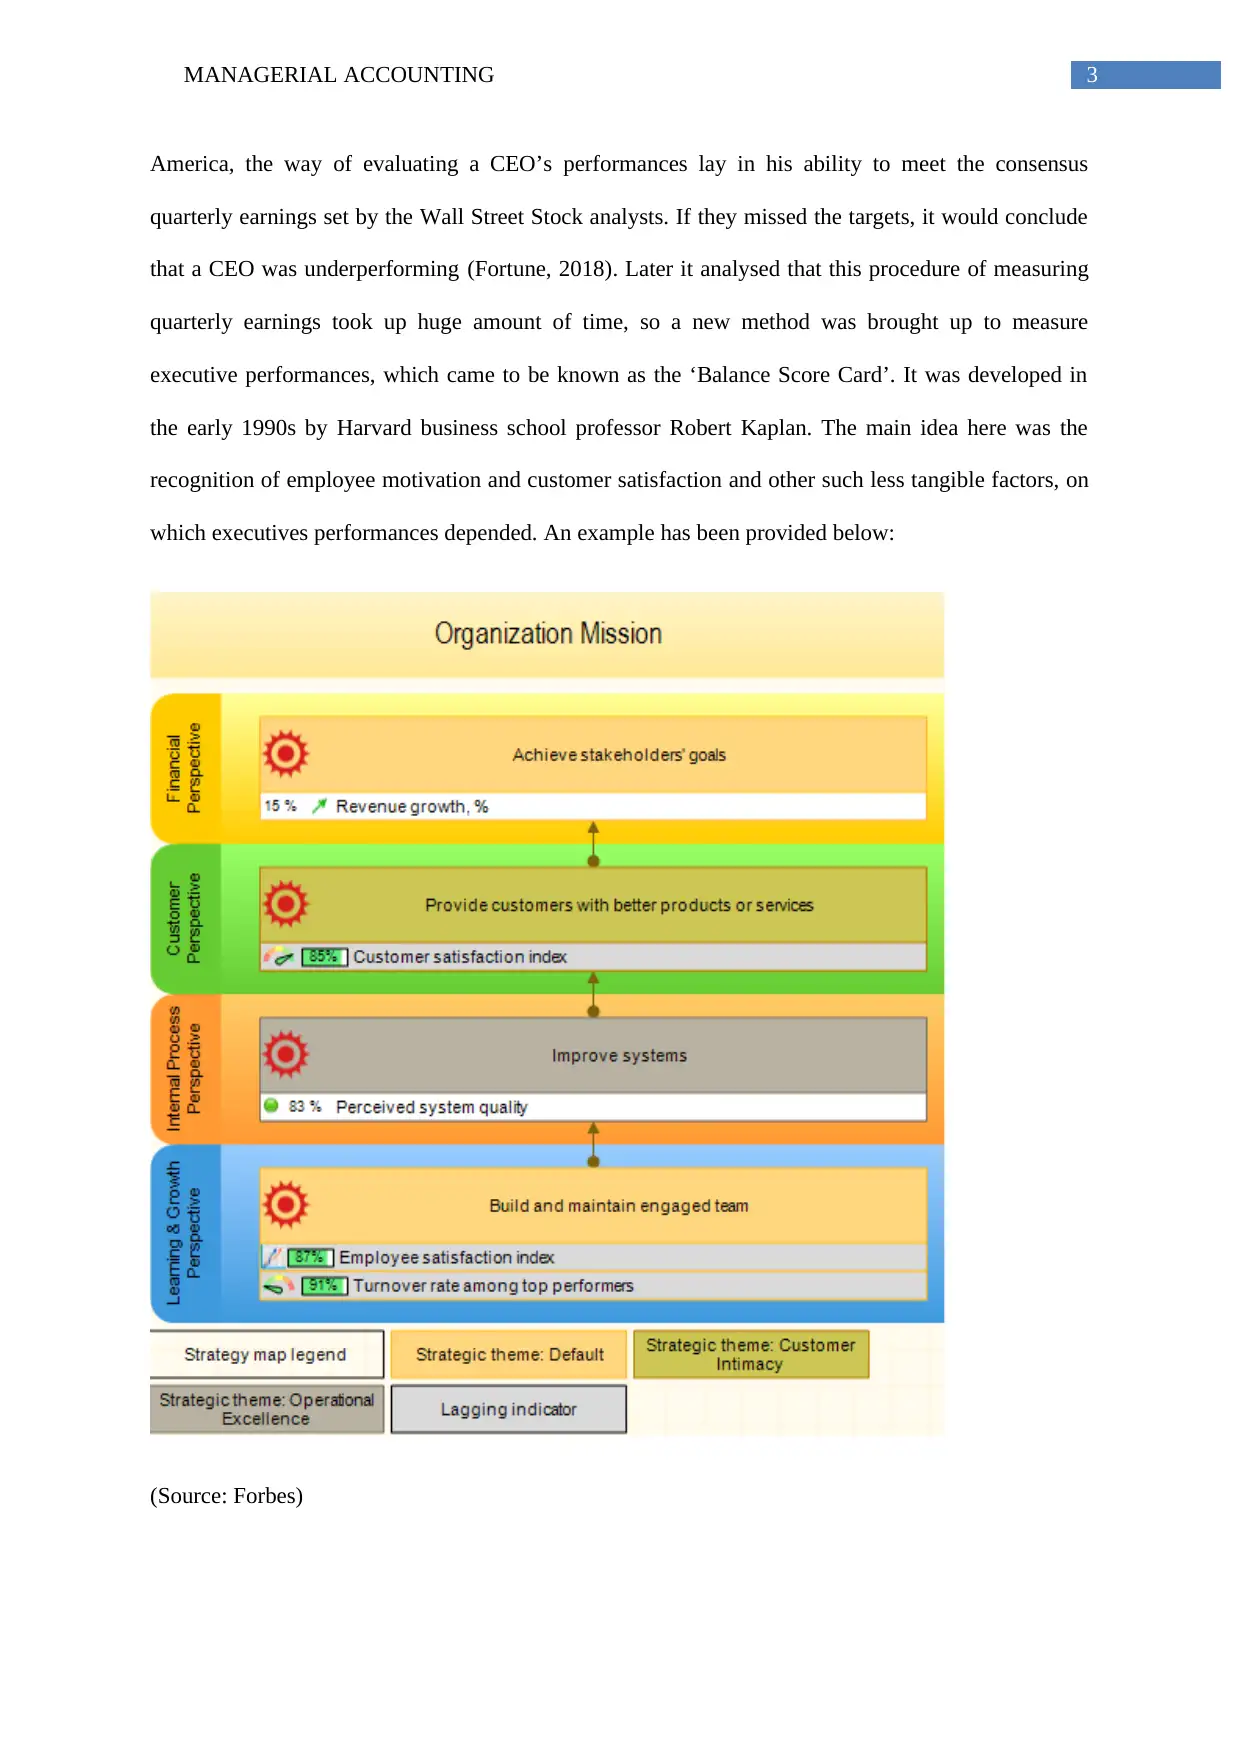
This report provides a comprehensive analysis of executive remuneration at the Macquarie Group of companies, focusing on the context of high executive compensation in the current economic environment. The report delves into the company's remuneration reports, examining performance measures, including both short-term (STI) and long-term incentives (LTI). It reviews recent studies and reports on executive remuneration, highlighting various methods used to assess CEO performance, such as the balance scorecard. The report discusses the Macquarie Group's remuneration framework, considering factors like shareholder returns and market conditions. It then analyzes the allocation of executive remuneration, detailing the components of fixed salaries and various incentives. The report compares financial and non-financial performance measures, examines recent changes in executive remuneration reporting, and analyzes the company's remuneration program, including its governance and performance-based approach. It also explains the calculation methods for STIs and LTIs, using examples of additive and multiplicative models. The report aims to provide insights into the company's approach to executive compensation and its alignment with company performance.

Running head: MANAGERIAL ACCOUNTING
Name of the Student
Name of the University
Author note
Name of the Student
Name of the University
Author note
Paraphrase This Document
Need a fresh take? Get an instant paraphrase of this document with our AI Paraphraser

1MANAGERIAL ACCOUNTING
Executive Summary:
Executive compensation is one of the most trending topics of business in today’s world.
Presently, in this era of economic slowdown, uncertain economic environment, the high executive
remuneration has created a buzz in the business environment. Due to this, the present topic report
deals with the investigation of the Macquarie group of companies. This report has conducted a robust
analysis of the remuneration reports of the company. The various articles relating to the performance
measures and executive remuneration have been discussed. The remuneration structure of the
company has been revised in order to investigate the remuneration and pay policies of the company.
The various ways of calculating long term and short term incentives have been discussed. Certain
recommendations have been made which would assist the company in assessing the true executive
performances of the company executives.

2MANAGERIAL ACCOUNTING
Introduction:
Executive remuneration has long been in the public spotlight for a long period of time. It has
again grabbed the public headlines due to the recent upsurge in the pay packets of the Australian
CEOs. It has been reported that the Australian CEOs are now earning a mammoth 78 times more than
any Australian worker or employee for that matter. On the other hand, going by the same statistics, it
could be seen that on the other hand, an average Australian earns a paltry $0.86 dollars. Australia’s
top executives today earn on an average of 4.75 million dollars or as mentioned above 78 times as an
average Australian worker. Moreover, the earnings of the CEOs have notched up higher to a
staggering 46 percent faster than any typical worker’s income. These differences have been compiled
from the noted Corporate advisor Conrad Liveris, who has examined the examined the income of
executives of top hundred Australian companies. Such high remuneration is completely uncalled for
in current times of financial turmoil and fiscal crunch (Sarasa, Dufo and Agustín, 2013). This
report aims to delve into the remuneration reports of Macquarie Group of Companies. This report
would investigate the causes of such high remuneration of executives, the kind of measures used to
assess this high remuneration, performance measures adopted by the company including the analysis
of the methods of determining both the Short term Incentives (STI) as well as the Long term
Incentives (LTI) for the company. This would help in throwing a substantial amount of light upon the
arena of executive remuneration in the Australian economy.
Discussion:
Review of recent studies and reports regarding executive remuneration:
Justin Foxx’s article on Executive remuneration (Fortune Magazine)
The ability to inspire the organisation’s troops into the bold landscapes of the future makes a
CEO great, but how does anyone measure the CEO’s performance in this regard. There are a variety
of measuring the performance of CEOs. It is by quantifying their performances. In the 1980’s in
⊘ This is a preview!⊘
Do you want full access?
Subscribe today to unlock all pages.

Trusted by 1+ million students worldwide

3MANAGERIAL ACCOUNTING
America, the way of evaluating a CEO’s performances lay in his ability to meet the consensus
quarterly earnings set by the Wall Street Stock analysts. If they missed the targets, it would conclude
that a CEO was underperforming (Fortune, 2018). Later it analysed that this procedure of measuring
quarterly earnings took up huge amount of time, so a new method was brought up to measure
executive performances, which came to be known as the ‘Balance Score Card’. It was developed in
the early 1990s by Harvard business school professor Robert Kaplan. The main idea here was the
recognition of employee motivation and customer satisfaction and other such less tangible factors, on
which executives performances depended. An example has been provided below:
(Source: Forbes)
Paraphrase This Document
Need a fresh take? Get an instant paraphrase of this document with our AI Paraphraser

4MANAGERIAL ACCOUNTING
There are four perspectives provided here, on the basis of which Executive performance and
remuneration can be fixed. It takes into account the non-tangible factors such as customer satisfaction,
internal organisation processes as well as financial perspectives as well in order to assess the true
quality of executive performance. Here some hypothetical figures have been provided in order to
create a feel of the actual score cards of executives.
Hay Group’s 2015 CEO performance evaluation study:
Hay Group’s most recent study about executive remuneration reveals certain measures which
could be used as a true indicator of any executive’s performance. In today’s world, activists of
investors and active shareholders prefer the use of short term and quantifying metric measures for
executive performance measures. As they believe in numbers. Despite a renewed vigour in
quantifying performance, the study revealed the following:
Further focus must be shown on increasing formal reviews.
Reviewing the metrics involved
Incorporating feedback sessions
Remuneration report overview of Macquarie Group:
The board of directors as well as the remuneration board committee of Macquari have
thoroughly reviewed the group’s remuneration framework. In evaluating the remuneration policies,
the board takes into account the following factors:
Return to the shareholders
Balancing of short term and long term incentives
Employment environment
Market situation and developments
Shareholders’ feedback

5MANAGERIAL ACCOUNTING
The composition of the remuneration committee is wide and diverse in nature and its main objective
is to assist the Macquarie board in framing correct remuneration policies and practices. The board
currently consists of five non-executive directors, who are:
Michael Hawker (Chairman)
Gary Banks
Gordon Cairns
Diane Grady
Peter Warne
The committee have the required experience in the field of human resource, remuneration and risk
programmes, which makes them a perfect fit for the job. Their main responsibility includes paying
minute attention to the creation and implementation of the remuneration practices of the company.
Allocation of executive remuneration:
The executive remuneration includes a wide range of incentives in addition to fixed salaries.
They have been diagrammatically mentioned below:
SalaryLongterm&shorttermincentivesPerfroamceShareUnits(PSUs)EquityawardsProfitshares
⊘ This is a preview!⊘
Do you want full access?
Subscribe today to unlock all pages.

Trusted by 1+ million students worldwide

6MANAGERIAL ACCOUNTING
(Source: Author’s creation)
The company mainly provides five kinds of performance measures tools which are as follows:
Net Profit After Tax
Basic Earnings per share.
Ordinary Dividends
Return on Equity
Annual Total Shareholder Return.
Comparison of financial and non-financial performance measures:
Non- financial performance measures are very frequently used nowadays for
performance evaluation, some of the widely used are balance score card in this area. These
non-monetary performance measures such as customer service, loyalty and satisfaction,
quality of product are important in cases where, monetary market figures are not readily
available. The main problem faced by the board is the linking of non-financial performance
measures with the accounting performance data. In this case, the quantifying performance
measures in the market, such as EPS, TSR, and NPAT are more transparent form of assessing
the performance of the executives working in the companies (Blerck and George, 2013). In
terms of ROI, it has significantly improved in case of Macquarie, from 14.7% to 15.2 % in
2017 (Static.macquarie.com, 2018). The total shareholder return of Macquarie has also been
growing at a strong rate and has outperformed even the Working Capital Index, presently it
stands at 700, when compared to the WCI’s 150. Thus, it forms a better, transparent medium
of assessing the executive’s performances, when compared to non-financial measures such as
product quality and customer satisfaction.
Recent changes in the Executive remuneration reporting between 2016 and 2017:
There have been no recent changes in the remuneration structure of Macquarie group, the
remuneration structure which was followed in 2016, was also adopted in the fiscal year of
Paraphrase This Document
Need a fresh take? Get an instant paraphrase of this document with our AI Paraphraser

7MANAGERIAL ACCOUNTING
2017. The basic structure has remained the same, the details have been provided below.
Macquarie’s remuneration structure primarily involves three basic components, which are:
The fixed remuneration.
Profit share
PSUs, specially for executive committee members
The structure involved determination of fixed remuneration, performance based remuneration
involved determination of profit share pool and performance share units. Determination of
performance awards and other performance measures have also remained uniform throughout the two
year period.
The primary differences in the performances in the financial performance measures are as follows:
Performance
measures
2016 2017 Percentage increase
or decrease
Net profit after tax 2063 million dollars 2217 million dollars 7%
Basic Earnings per
share
619.2 cents/share 657.6 cents/share 6%
Ordinary dividends 400 cents/share 470 cents/share 18%
Return on Equity 14.7% 15.2% 3%
Analysis of the company’s remuneration programme:
The company has a comprehensive remuneration system in place for smooth and effective
implementation of the remuneration policies of the company. The remuneration governance of the
company is one of the most effective ones, in the entire industry. Macquarie has set up a separate
board and committee for looking into the remuneration policies of the company. The major
foundation upon which the entire remuneration policies and practices is based on the system of
performance based remuneration. It can be seen from the remuneration reports of the company, that

8MANAGERIAL ACCOUNTING
Macquarie’ approach towards performance remuneration is based and structured on the individual as
well as the group business level. For example, the overall profit pool of the company is determined
yearly with references to a proportion of Macquarie‘s after tax profits. The longstanding approach of
the company has emphasised over the creation of a solid alignment of the interests of the shareholders
and employees and simultaneously managing the risks and enforcing the company’s code of conduct.
The link with company performance:
Macquarie has performed exceptionally well in terms of its financial results. It has done
overwhelmingly well in the fiscal year of 2017. Net profit after tax as well as Earnings per share have
increased by 7% and 6% respectively (Static.macquarie.com, 2018). Total compensation in
accordance with the improved performance of the EPS and the NPAT have also increased. It has
reflected the principles of Macquarie in providing appropriate level of remuneration. Along with this,
the company has also seen an increase in the returns available to shareholders as a result of which the
yearly total shareholders return have improved to a significant extent. The returns have increased to a
staggering extent of 44.6% and a substantial amount of increase in the ordinary dividends of 18%,
when compared with the returns from the fiscal year of 2016.
The performance over the last 3 years in terms of returns to the shareholders are as follows:
Income statement 2017 2016 2015
NPAT towards
ordinary share owners
2217 2063 1604
Basic Earnings Per
Share (Cents/share)
657.6 619.2 502.3
Shareholder’s returns
Average return on 15.2 14.7 14.0
⊘ This is a preview!⊘
Do you want full access?
Subscribe today to unlock all pages.

Trusted by 1+ million students worldwide

9MANAGERIAL ACCOUNTING
ordinary shareholder’s
funds
Interim and final
dividend
470 400 330
Share price at 31st
March
90.2 66.1 76.7
Yearly total
shareholder’s return
44.6 (9.9) 38.9
Calculation methods of short term incentives (STI) and long term incentives (LTI):
While calculating the short term incentives, two ways are generally used which are ‘Bottom
up view’ and the ‘top down view’. The bottom up view starts with the amount of money to be paid
based on the performance of the business and the personal performance of the individual. The top
down view begins with focusing on the bonus pool, which is prepared on the basis of the financial
performance and then it distributes the pool to the participants. The diagrammatic presentation of both
the approaches are given below:
Paraphrase This Document
Need a fresh take? Get an instant paraphrase of this document with our AI Paraphraser

10MANAGERIAL ACCOUNTING
(Source: PwC)
(Source: PwC)
(Source: PwC)
(Source: PwC)

11MANAGERIAL ACCOUNTING
There are various levels of targets for short term incentives. Mainly they are of three levels, which
are:
Stretch- It is such kind of a task, where exceptional performance is performed, where it is
truly challenging in the context of the present business. (E.g.- 110% of the target)
On-target- This refers to some good performance with some amount of ‘stretch’. Meeting of
budget.
Threshold- Adequate or certain amount of acceptable performance. (E.g.- 90% * Budget)
An example using both the additive as well as multiplication models have been shown here:
Additive model:
Here, both the business score as well as the personal score are added. Here the business score is at
(70%) and the personal score is at (30%) and consequently both are added to become 100%. The final
score= % Business Score (0-200%)* Business Weight (70%) + %Personal Score (0-200%) * Personal
Weight (30%) Bonus %= Final Score * On-Target % and Bonus = Bonus %*GP.
Multiplicative model:
Here, in this case, the business score and the personal score are multiplied. Thereafter, the final score=
Business Score (0-150%)* Personal score (0-150%), Bonus %= Final Score * On-target %, Bonus=
Bonus %* GP.
Certain specific examples of business score and performance scores have been provided below:
⊘ This is a preview!⊘
Do you want full access?
Subscribe today to unlock all pages.

Trusted by 1+ million students worldwide
1 out of 19
Related Documents

Your All-in-One AI-Powered Toolkit for Academic Success.
+13062052269
info@desklib.com
Available 24*7 on WhatsApp / Email
Unlock your academic potential
Copyright © 2020–2025 A2Z Services. All Rights Reserved. Developed and managed by ZUCOL.