FINA6000 Managing Finance: Comparative Financial Report Analysis
VerifiedAdded on 2022/09/13
|11
|1707
|13
Report
AI Summary
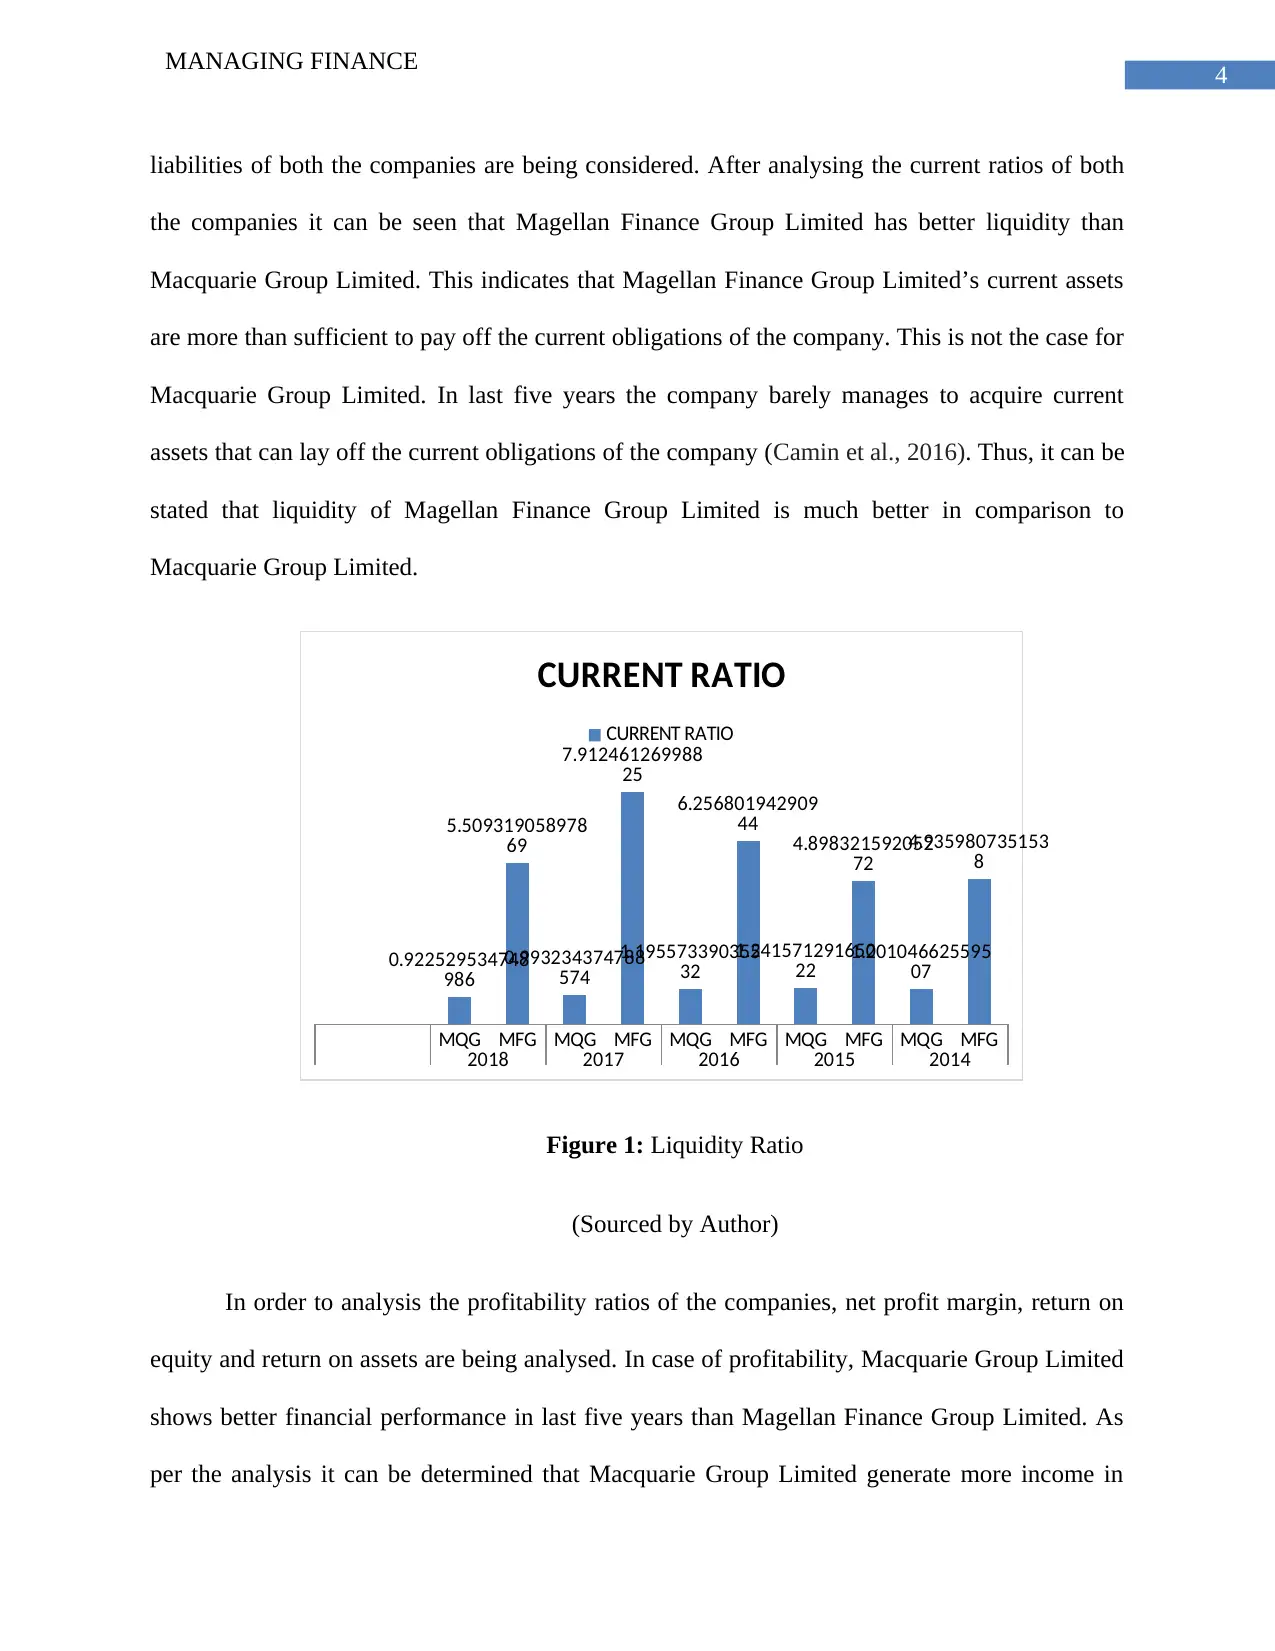
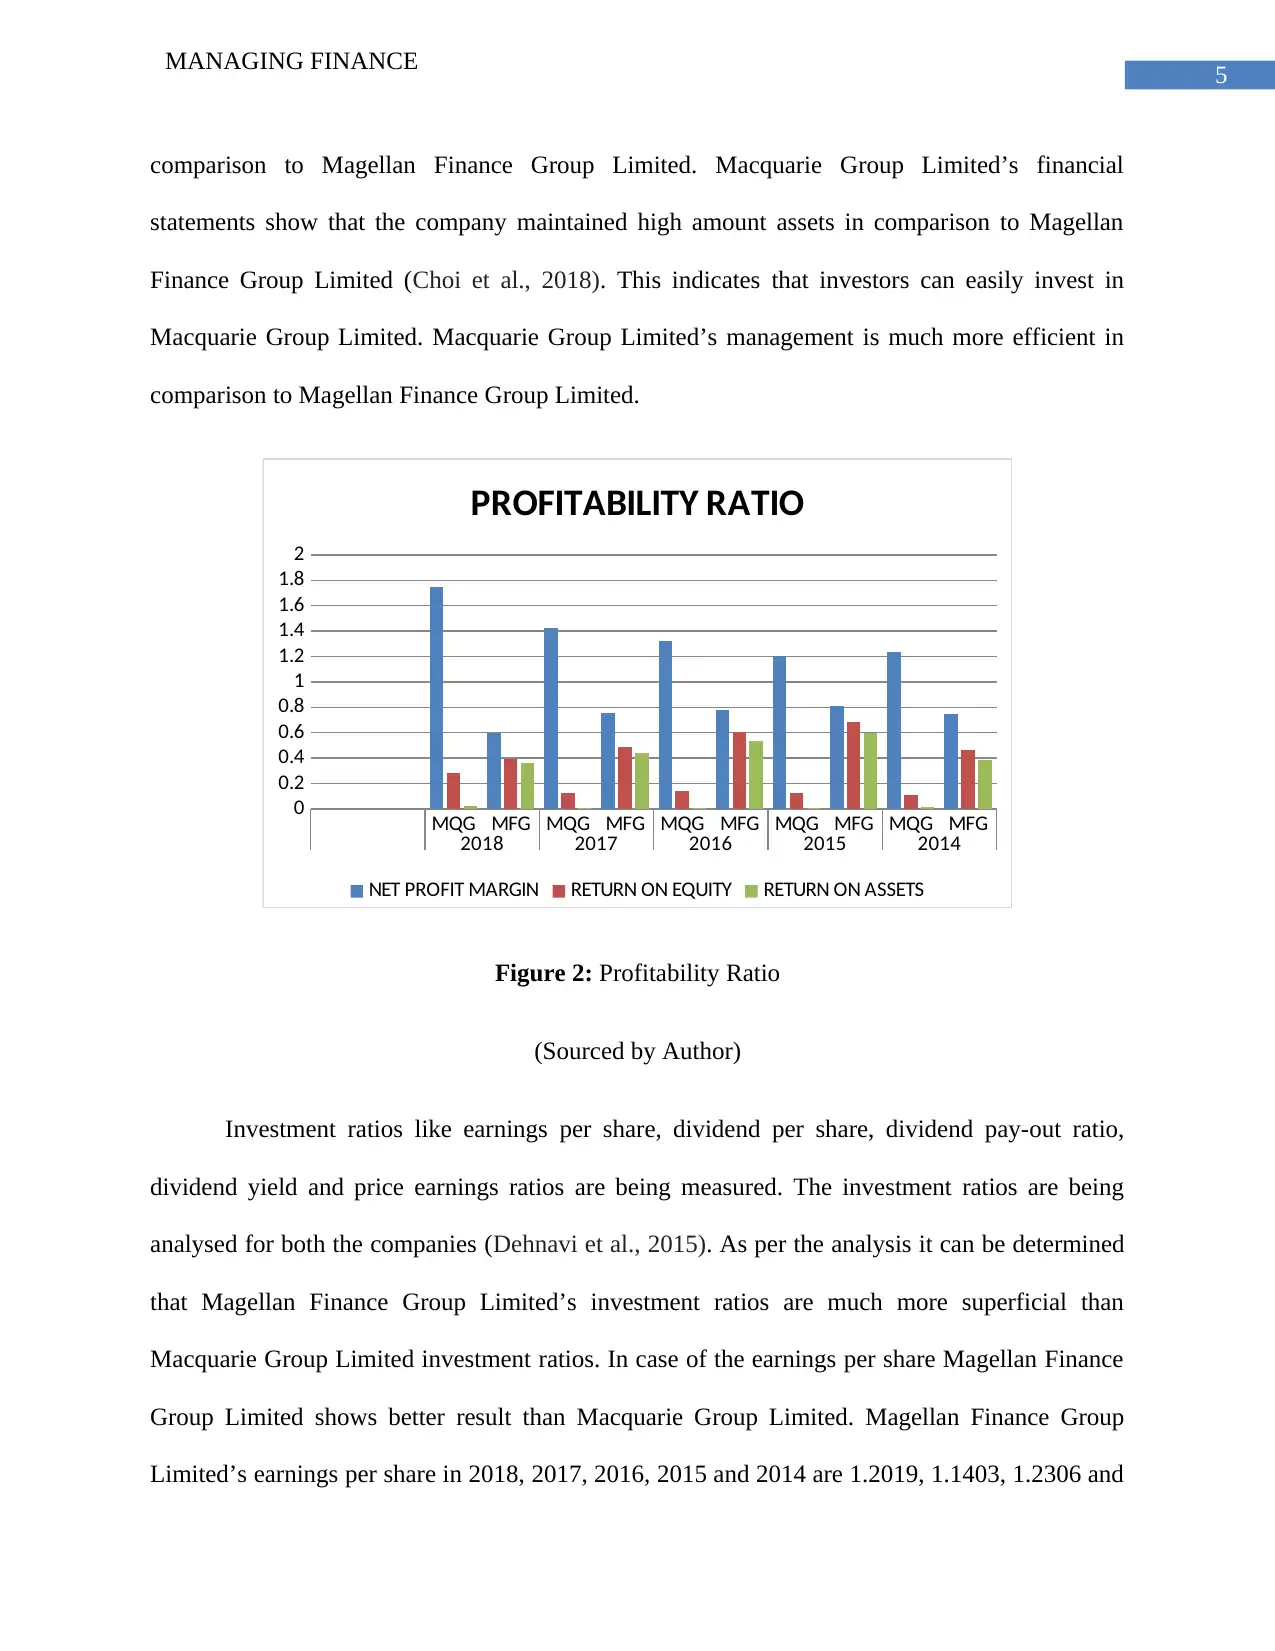
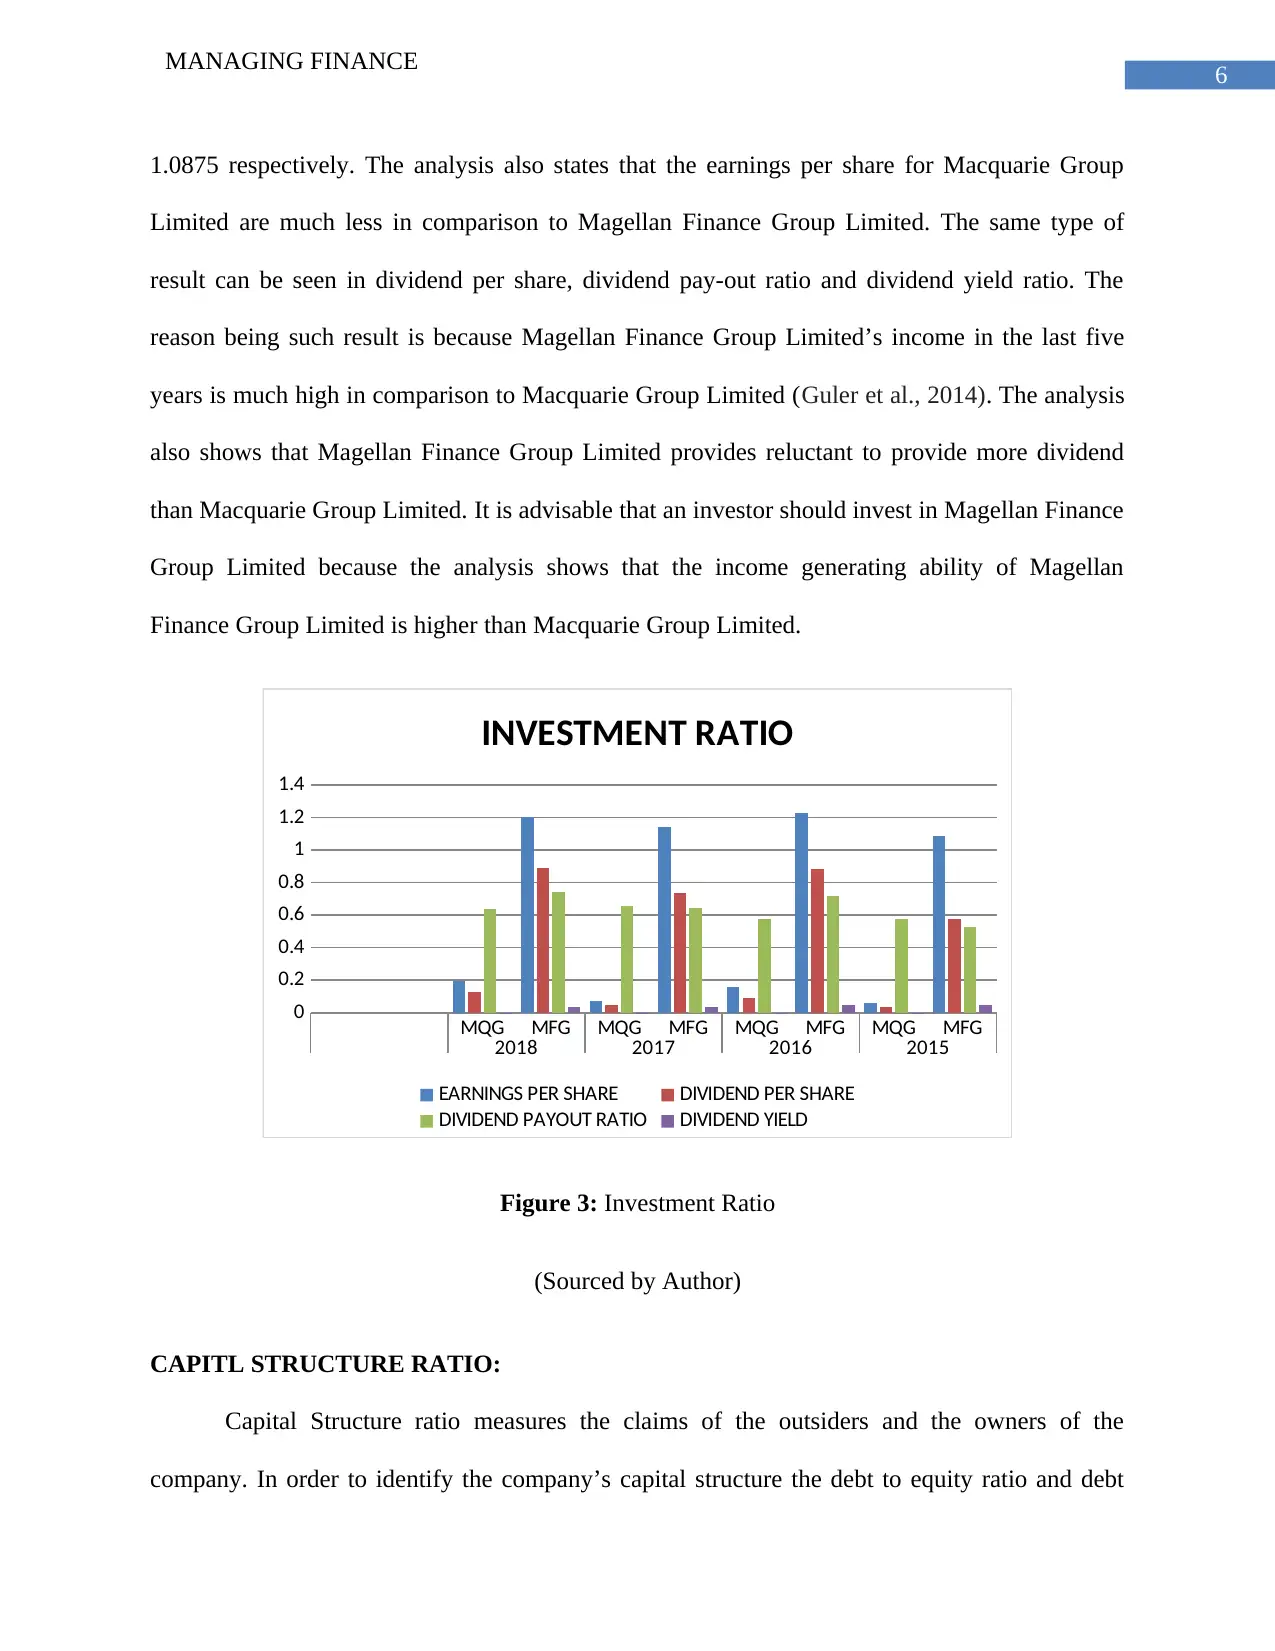
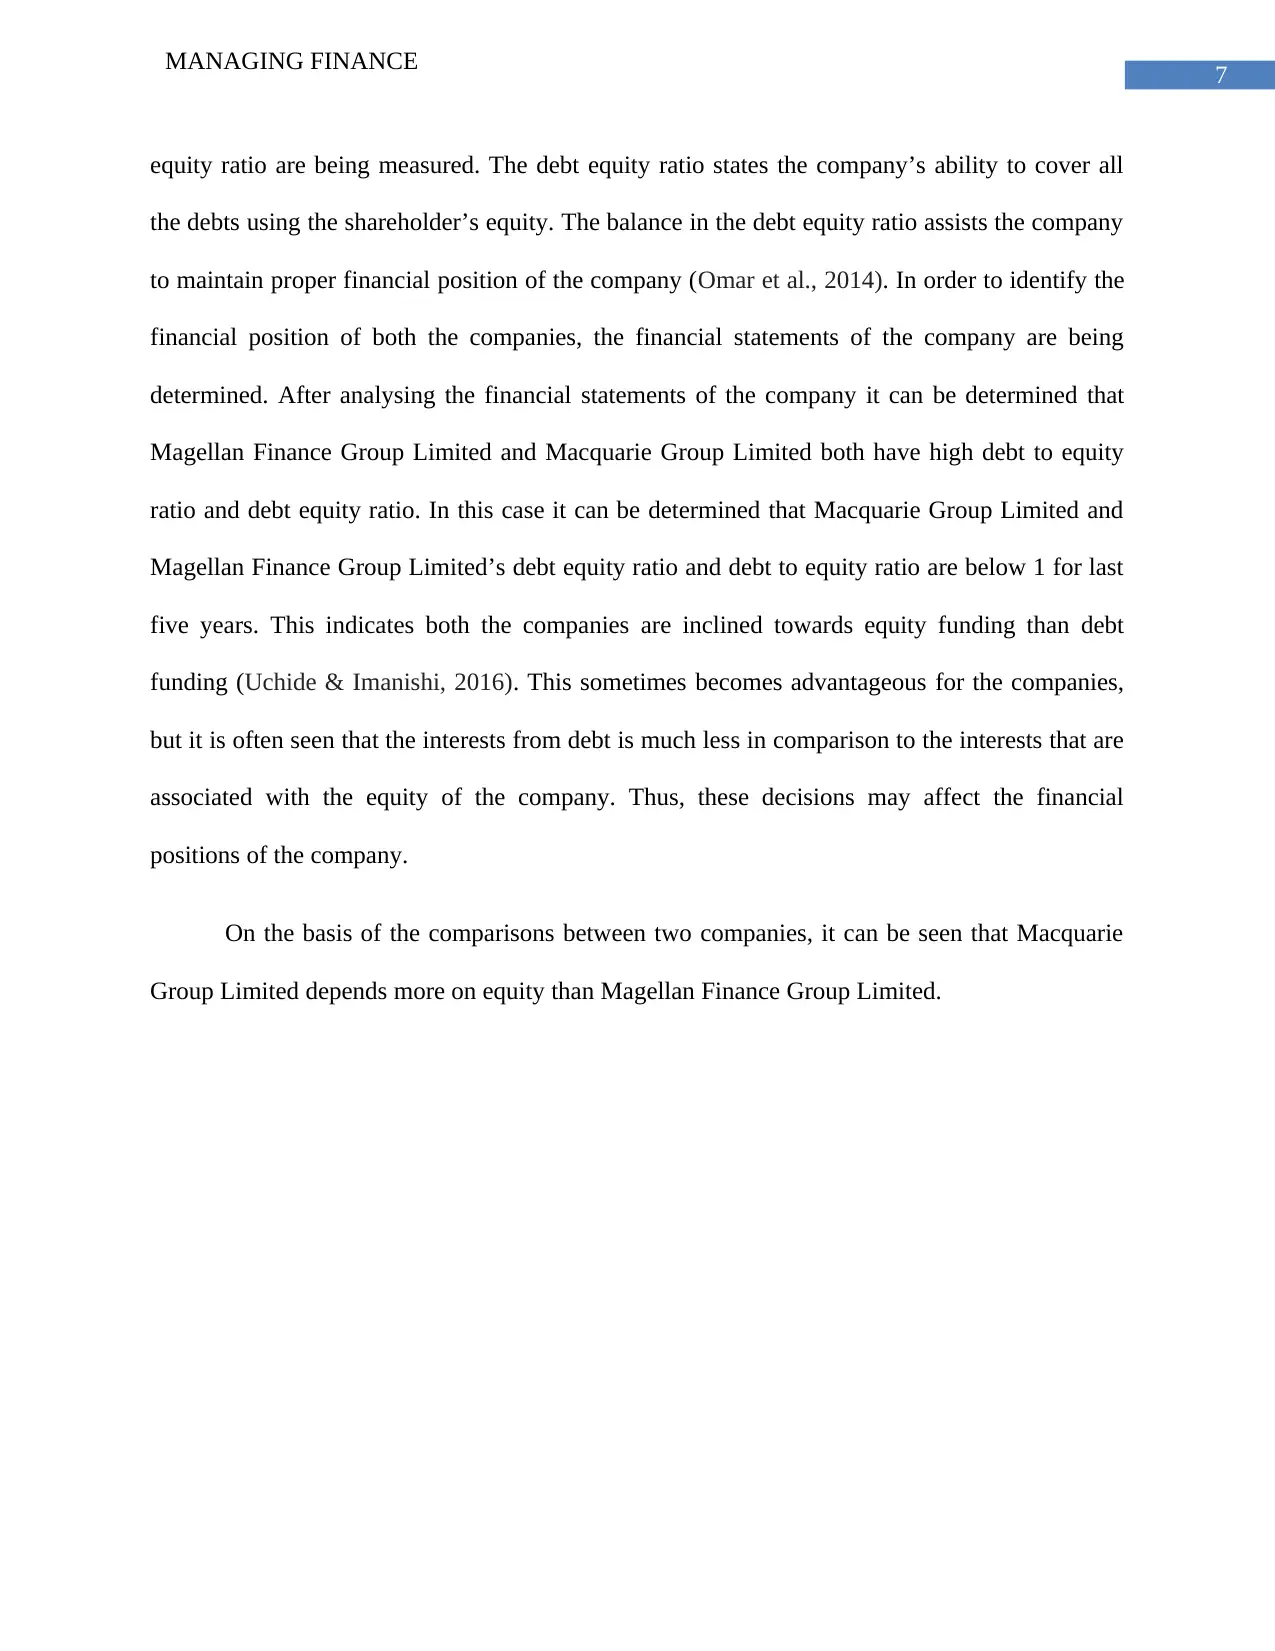
This report provides a comparative financial analysis of Macquarie Group Limited and Magellan Finance Group Limited, two prominent companies in the Australian financial industry. The analysis employs various financial tools, including liquidity, profitability, and investment ratio analyses, as well as capital structure analysis, to assess their financial performance. The report examines key financial metrics such as current ratios, net profit margin, return on equity, earnings per share, and debt-to-equity ratios, to provide a comprehensive overview of each company's financial health. Through this comparative analysis, the report aims to determine which company presents a more attractive investment opportunity based on its financial strengths and potential for returns. The findings suggest that Magellan Finance Group Limited demonstrates superior performance in several key areas, making it a more favorable investment choice based on the analyzed data.

Running head: MANAGING FINANCE
MANAGING FINANCE
Name of Student
Name of University
Author’s Note
MANAGING FINANCE
Name of Student
Name of University
Author’s Note
Secure Best Marks with AI Grader
Need help grading? Try our AI Grader for instant feedback on your assignments.

1
MANAGING FINANCE
Table of Contents
INTRODUCTION:..............................................................................................................3
BACKGROUND:................................................................................................................3
RATIO ANALYSIS:...........................................................................................................3
CAPITL STRUCTURE RATIO:.........................................................................................6
REFERENCES:...................................................................................................................9

2
MANAGING FINANCE
MANAGING FINANCE

3
MANAGING FINANCE
INTRODUCTION:
In order to analyses the financial performance of the company two companies’ financial
statements are taken. Two companies that are taken are Macquarie Group Limited and Magellan
Finance Group Limited. These two companies are the market leaders of the financial industry in
Australia. Several financial tools like ratio analysis, capital structure analysis, and historical cost
weighted average cost of capital and discounted cash flows are being analyses. The financial
analysis of both the companies are being analysed and compared. This provides complete idea
about the financial performance of the company. The financial health of the companies will
assist the investors to identify, which company will provide high return.
BACKGROUND:
Macquarie Group Limited is the Australian multinational bank. The bank is an
investment bank. The company was firs established in 1969. The company also employs more
than 14000 employees. The bank present in more than 20 countries of the world. The bank is
also considered as the world’s top largest infrastructure asset manager.
Magellan Finance Group Limited was first established in 2006. The company is one of
the emerging investment companies of Australia. The company’s main business is comprised of
to generate revenue for the clients using their fund in the global equities. The company is also
famous for efficiently safeguarding the capital of their clients.
RATIO ANALYSIS:
In order to analyses the financial performance of the companies, liquidity ratio,
profitability ratio and investment ratios are being measured. In liquidity ratios, both current ratio
are being calculated. In order to calculate the current ratios, both current assets and current
Secure Best Marks with AI Grader
Need help grading? Try our AI Grader for instant feedback on your assignments.

4
MANAGING FINANCE
liabilities of both the companies are being considered. After analysing the current ratios of both
the companies it can be seen that Magellan Finance Group Limited has better liquidity than
Macquarie Group Limited. This indicates that Magellan Finance Group Limited’s current assets
are more than sufficient to pay off the current obligations of the company. This is not the case for
Macquarie Group Limited. In last five years the company barely manages to acquire current
assets that can lay off the current obligations of the company (Camin et al., 2016). Thus, it can be
stated that liquidity of Magellan Finance Group Limited is much better in comparison to
Macquarie Group Limited.
MQG MFG MQG MFG MQG MFG MQG MFG MQG MFG
2018 2017 2016 2015 2014
0.922529534748
986
5.509319058978
69
0.993234374788
574
7.912461269988
25
1.195573390355
32
6.256801942909
44
1.241571291650
22
4.898321592052
72
1.201046625595
07
4.935980735153
8
CURRENT RATIO
CURRENT RATIO
Figure 1: Liquidity Ratio
(Sourced by Author)
In order to analysis the profitability ratios of the companies, net profit margin, return on
equity and return on assets are being analysed. In case of profitability, Macquarie Group Limited
shows better financial performance in last five years than Magellan Finance Group Limited. As
per the analysis it can be determined that Macquarie Group Limited generate more income in

5
MANAGING FINANCE
comparison to Magellan Finance Group Limited. Macquarie Group Limited’s financial
statements show that the company maintained high amount assets in comparison to Magellan
Finance Group Limited (Choi et al., 2018). This indicates that investors can easily invest in
Macquarie Group Limited. Macquarie Group Limited’s management is much more efficient in
comparison to Magellan Finance Group Limited.
MQG MFG MQG MFG MQG MFG MQG MFG MQG MFG
2018 2017 2016 2015 2014
0
0.2
0.4
0.6
0.8
1
1.2
1.4
1.6
1.8
2
PROFITABILITY RATIO
NET PROFIT MARGIN RETURN ON EQUITY RETURN ON ASSETS
Figure 2: Profitability Ratio
(Sourced by Author)
Investment ratios like earnings per share, dividend per share, dividend pay-out ratio,
dividend yield and price earnings ratios are being measured. The investment ratios are being
analysed for both the companies (Dehnavi et al., 2015). As per the analysis it can be determined
that Magellan Finance Group Limited’s investment ratios are much more superficial than
Macquarie Group Limited investment ratios. In case of the earnings per share Magellan Finance
Group Limited shows better result than Macquarie Group Limited. Magellan Finance Group
Limited’s earnings per share in 2018, 2017, 2016, 2015 and 2014 are 1.2019, 1.1403, 1.2306 and

6
MANAGING FINANCE
1.0875 respectively. The analysis also states that the earnings per share for Macquarie Group
Limited are much less in comparison to Magellan Finance Group Limited. The same type of
result can be seen in dividend per share, dividend pay-out ratio and dividend yield ratio. The
reason being such result is because Magellan Finance Group Limited’s income in the last five
years is much high in comparison to Macquarie Group Limited (Guler et al., 2014). The analysis
also shows that Magellan Finance Group Limited provides reluctant to provide more dividend
than Macquarie Group Limited. It is advisable that an investor should invest in Magellan Finance
Group Limited because the analysis shows that the income generating ability of Magellan
Finance Group Limited is higher than Macquarie Group Limited.
MQG MFG MQG MFG MQG MFG MQG MFG
2018 2017 2016 2015
0
0.2
0.4
0.6
0.8
1
1.2
1.4
INVESTMENT RATIO
EARNINGS PER SHARE DIVIDEND PER SHARE
DIVIDEND PAYOUT RATIO DIVIDEND YIELD
Figure 3: Investment Ratio
(Sourced by Author)
CAPITL STRUCTURE RATIO:
Capital Structure ratio measures the claims of the outsiders and the owners of the
company. In order to identify the company’s capital structure the debt to equity ratio and debt
Paraphrase This Document
Need a fresh take? Get an instant paraphrase of this document with our AI Paraphraser

7
MANAGING FINANCE
equity ratio are being measured. The debt equity ratio states the company’s ability to cover all
the debts using the shareholder’s equity. The balance in the debt equity ratio assists the company
to maintain proper financial position of the company (Omar et al., 2014). In order to identify the
financial position of both the companies, the financial statements of the company are being
determined. After analysing the financial statements of the company it can be determined that
Magellan Finance Group Limited and Macquarie Group Limited both have high debt to equity
ratio and debt equity ratio. In this case it can be determined that Macquarie Group Limited and
Magellan Finance Group Limited’s debt equity ratio and debt to equity ratio are below 1 for last
five years. This indicates both the companies are inclined towards equity funding than debt
funding (Uchide & Imanishi, 2016). This sometimes becomes advantageous for the companies,
but it is often seen that the interests from debt is much less in comparison to the interests that are
associated with the equity of the company. Thus, these decisions may affect the financial
positions of the company.
On the basis of the comparisons between two companies, it can be seen that Macquarie
Group Limited depends more on equity than Magellan Finance Group Limited.

8
MANAGING FINANCE
MQG MFG MQG MFG MQG MFG MQG MFG MQG MFG MQG MFG
2019 2018 2017 2016 2015 2014
0.000
0.500
1.000
1.500
2.000
2.500
3.000
3.500
4.000
4.500
CAPITAL STRUCTURE RATIO
DEBT EQUITY RATIO DEBT TO EQUITY RATIO
Figure 4: Capital Structure Ratio
(Sourced by Author)
After analysing both the financial ratios of the company, it can be determined that
Magellan Finance Group Limited’s financial performance is much better in comparisons to
Macquarie Group Limited. The liquidity ratio, profitability ratio and investment ratios indicates
that Magellan Finance Group Limited’s liquidity positions, generating profit from the market and
dividend paying ability is much better in comparison to Macquarie Group Limited (Zhu et al.m
2014). Thus, if it comes to investment then it will be feasible to invest in Magellan Finance
Group Limited. The company will not only provide better return, but the risk associated with the
company is much less in comparison to Macquarie Group Limited. Magellan Finance Group
Limited also provides dividends to their investors, which can be identified from the dividend
ratios and investment ratios of the company.

9
MANAGING FINANCE
REFERENCES:
Camin, F., Bontempo, L., Perini, M., & Piasentier, E. (2016). Stable isotope ratio analysis for
assessing the authenticity of food of animal origin. Comprehensive Reviews in Food Science and
Food Safety, 15(5), 868-877.
Choi, K. B., Lee, J. J., Kim, G. H., Lim, H. J., & Kwon, S. G. (2018). Amplification ratio
analysis of a bridge-type mechanical amplification mechanism based on a fully compliant
model. Mechanism and Machine Theory, 121, 355-372.
Dehnavi, A., Aghdam, I. N., Pradhan, B., & Varzandeh, M. H. M. (2015). A new hybrid model
using step-wise weight assessment ratio analysis (SWARA) technique and adaptive neuro-fuzzy
inference system (ANFIS) for regional landslide hazard assessment in Iran. Catena, 135, 122-
148.
Guler, A., Kocaokutgen, H., Garipoglu, A. V., Onder, H., Ekinci, D., & Biyik, S. (2014).
Detection of adulterated honey produced by honeybee (Apis mellifera L.) colonies fed with
different levels of commercial industrial sugar (C3 and C4 plants) syrups by the carbon isotope
ratio analysis. Food Chemistry, 155, 155-160.
Omar, N., Koya, R. K., Sanusi, Z. M., & Shafie, N. A. (2014). Financial statement fraud: A case
examination using Beneish Model and ratio analysis. International Journal of Trade, Economics
and Finance, 5(2), 184.
Uchide, T., & Imanishi, K. (2016). Small earthquakes deviate from the omega‐square model as
revealed by multiple spectral ratio analysis. Bulletin of the Seismological Society of
America, 106(3), 1357-1363.
Secure Best Marks with AI Grader
Need help grading? Try our AI Grader for instant feedback on your assignments.

10
MANAGING FINANCE
Zhu, J., Djukovic, D., Deng, L., Gu, H., Himmati, F., Zaid, M. A., ... & Raftery, D. (2015).
Targeted serum metabolite profiling and sequential metabolite ratio analysis for colorectal cancer
progression monitoring. Analytical and bioanalytical chemistry, 407(26), 7857-7863.
MANAGING FINANCE
Zhu, J., Djukovic, D., Deng, L., Gu, H., Himmati, F., Zaid, M. A., ... & Raftery, D. (2015).
Targeted serum metabolite profiling and sequential metabolite ratio analysis for colorectal cancer
progression monitoring. Analytical and bioanalytical chemistry, 407(26), 7857-7863.
1 out of 11
Related Documents

Your All-in-One AI-Powered Toolkit for Academic Success.
+13062052269
info@desklib.com
Available 24*7 on WhatsApp / Email
Unlock your academic potential
© 2024 | Zucol Services PVT LTD | All rights reserved.