Macroeconomic Conditions & Steel Business Startup in the US Analysis
VerifiedAdded on 2023/06/11
|25
|8075
|175
Report
AI Summary
This report analyzes the US macroeconomic conditions from the pre-crisis to post-crisis period to determine the viability of launching a steel manufacturing business. It covers aspects such as the general business environment, ease of starting a business, dealing with construction permits, access to electricity, property registration, credit availability, investor protection, taxation, and cross-border trading. The report also discusses US business cycles, economic growth, unemployment and inflation rates, government expenditure, real interest rates, domestic credit transfer, taxation policies, recent monetary policies, and the effects of the 2008-09 Global Financial Crisis. The findings suggest that the US economy generally supports business establishment due to high growth rates, attractive raw material prices, and a potentially favorable interest rate environment, despite some challenges in taxation policies.
Running Head: US Macroeconomic Condition
Macroeconomic Conditions that Influence the Environment of Doing Business in the US. A
Study on a Steel Manufacturing Business Startup
By (Name)
(Tutor)
(University)
(Date)
Macroeconomic Conditions that Influence the Environment of Doing Business in the US. A
Study on a Steel Manufacturing Business Startup
By (Name)
(Tutor)
(University)
(Date)
Paraphrase This Document
Need a fresh take? Get an instant paraphrase of this document with our AI Paraphraser
US Macroeconomic Condition 2
Executive Summary
The US is the largest world economy ahead of China. This economy is developed and has many
trading partners. This paper is aimed at establishing how the US economy has performed in the
10 years from the pre-crisis period to post-crisis period. The results are useful in determining
whether is favorable for launching a steel manufacturing business. The economy has been noted
to be fast growing and its economic grow rate is very high. The high growth rate has enable the
government to raise greater tax revenues. The high economic growth rate is favorable for starting
up businesses in this economy as there is high demand for goods and services. The prices of raw
materials in the US are also attractive for starting a business given the fact that the average price
level given by inflation rate is low. The low inflation rate is also an indicator that US government
may be able to promote economic growth in the coming years by lowering the interest rate, this
will definitely lower the cost of capital. The current US interest rate is low and thus an investor
may choose to take a fixed interest loan that will minimize the risk of paying higher amounts in
the future in case the interest rate happened to be pushed up. The US government’s taxation
policy has been poor but in the recent years has undergone reforms that has been aimed at
promoting business establishment and expansions. The general business condition in the US are
very supportive for business establishment. The US economy has been confirmed to be the best
economy that one can consider initiating an investment
US Macroeconomic Condition 3
Table of Contents
Executive Summary.....................................................................................................................................2
Introduction.................................................................................................................................................4
Analyses and Discussions.............................................................................................................................6
General Business Environment................................................................................................................6
Starting a Business in the US...............................................................................................................6
Dealing with Construction Permit........................................................................................................7
Getting Electricity................................................................................................................................8
Registering Property............................................................................................................................8
Getting Credit......................................................................................................................................9
Protecting Minority Investors..............................................................................................................9
Paying Taxes........................................................................................................................................9
Trading Across Borders........................................................................................................................9
Enforcing Contracts...........................................................................................................................10
Resolving Insolvency..........................................................................................................................10
US Business Cycles and Economic Growth.............................................................................................11
US Unemployment Rate........................................................................................................................12
The US Inflation Rate.............................................................................................................................13
The US Government Expenditure..........................................................................................................16
The US Real Interest Rate......................................................................................................................17
The US Domestic Transfer of Credit to Private Sector...........................................................................19
The US Taxation Policy...........................................................................................................................20
Recent Monetary Policy in the US.........................................................................................................21
Effects of 2008-09 Global Financial Crisis (GFC) in the US.....................................................................21
Conclusions and Recommendations..........................................................................................................22
Bibliography...............................................................................................................................................24
⊘ This is a preview!⊘
Do you want full access?
Subscribe today to unlock all pages.
Trusted by 1+ million students worldwide
US Macroeconomic Condition 4
Macroeconomic Conditions that Influence the Environment of Doing Business in the US. A
Study on a Steel Manufacturing Business Startup
Introduction
This paper is aimed at establishing the business environment in the US. The study is
meant to determine whether it would be viable to launch a steel manufacturing business in the
US economy. United States being a Federation of States has different regulatory scheme and
government structure for every state. Inter-state commerce is regulated by the national
government authority. Further, it also regulates foreign trade and activities of business national
scope and interest (Commerce.gov, 2017). Any business operating in the US states is faced by
different regulatory environment depending on its territory of operation (Porter and Rivkin,
2012). There are other local jurisdiction in the US with regulatory authority over issues on
building codes, land use, permitting, zoning, sanitation, etc. an example of these local
jurisdictions include municipalities, counties and some political units. Thus in order to determine
the suitability of doing business in the US, a further research would be necessary to determine
again which state is more favorable compared to the others. The regulatory scheme which
applies to business operations carried out in the US is dependent on; (i) organization of the
business; (ii) the way the business operates and its location; (iii) and finally the industry in which
the business falls in.
There are 4 categories in which the regulations are classified. (i) The common regulations
applicable for all businesses, e.g. tax codes, business registration and licensing, safety
requirements and public health requirements. (ii) The regulations affecting only specific business
operation aspects such as workplace safety, employee relations, building code and zoning. (iii)
The regulations focused on particular industries e.g. insurance, health care, agriculture,
pharmaceuticals, banking and finance. (iv) Regulations that are meant to protect the interest of
the business, e.g. Due process, intellectual property, and prevention of deceptive trade practices
and unfair competition. All these regulations demand for diligence, competent professional
support and appropriate attention. The schemes are manageable. The regulations are not meant to
discourage investment, most of them are put forward to protect the best interest of the business.
The most common example of a regulation most useful for manufacturing companies is
the Intellectual Property Protection (IP). An IP protection is meant to benefit the owner who
Paraphrase This Document
Need a fresh take? Get an instant paraphrase of this document with our AI Paraphraser
US Macroeconomic Condition 5
comes up with a certain product out of creativity so that the owner will be able to benefit from
his/her invention without gratuitous competition, it increases the attractiveness of a product to
consumers. The IP consist of; (i) Trademarks which are words, symbols, phrases, images and
slogans that differentiate one product from that offered by competitors. (ii) Copyrights which
protects original works fixed in a tangible medium. E.g. music, videos, movies, books,
photographs, art and software. (iii) Patents that gives exclusive right to inventions. (iv) Trade
secrets that carefully guards private data and resources; these include formulas.
Launching a business in the US will need some prime assets that must be protected and
thus a need for IP protection. The United States offers a legal regime both at the state and federal
level to protect the IP assets. This enables an investor to exploit the assets fairly. The following
steps must be taken when planning to launch a business in the US: (i) An IP Audit must be
conducted before one enters the US. This means taking a stock of the intended IP assets and
estimating their worth in a rank. The assets will bring different value into the business and its
advisable to identify those will bring about the greatest value in ensuring survival for the
business. (ii) Secondly, a protection plan should be created. The identified and prioritized IP
assets need to be protected. There are two steps required for protection; one is to register the
product with copyright, trademark and patent authorities in the investor’s home country and also
in the US. Second is carrying out a review contacts by creating an awareness of your ownership
rights by contractors, investors and employees. (iii) Thirdly, one need to exercise diligence by
being watchful. Some competitors will always try to covet one’s IP by trespassing the held
rights. In the current era where technological changes have made it easy for IT specialist to
access any form of data in the internet, stealing of IP assets is very easy. The owner of the rights
need to keep constant monitoring to be able to detect when the IP assets are infringed.
US Macroeconomic Condition 6
Analyses and Discussions
General Business Environment
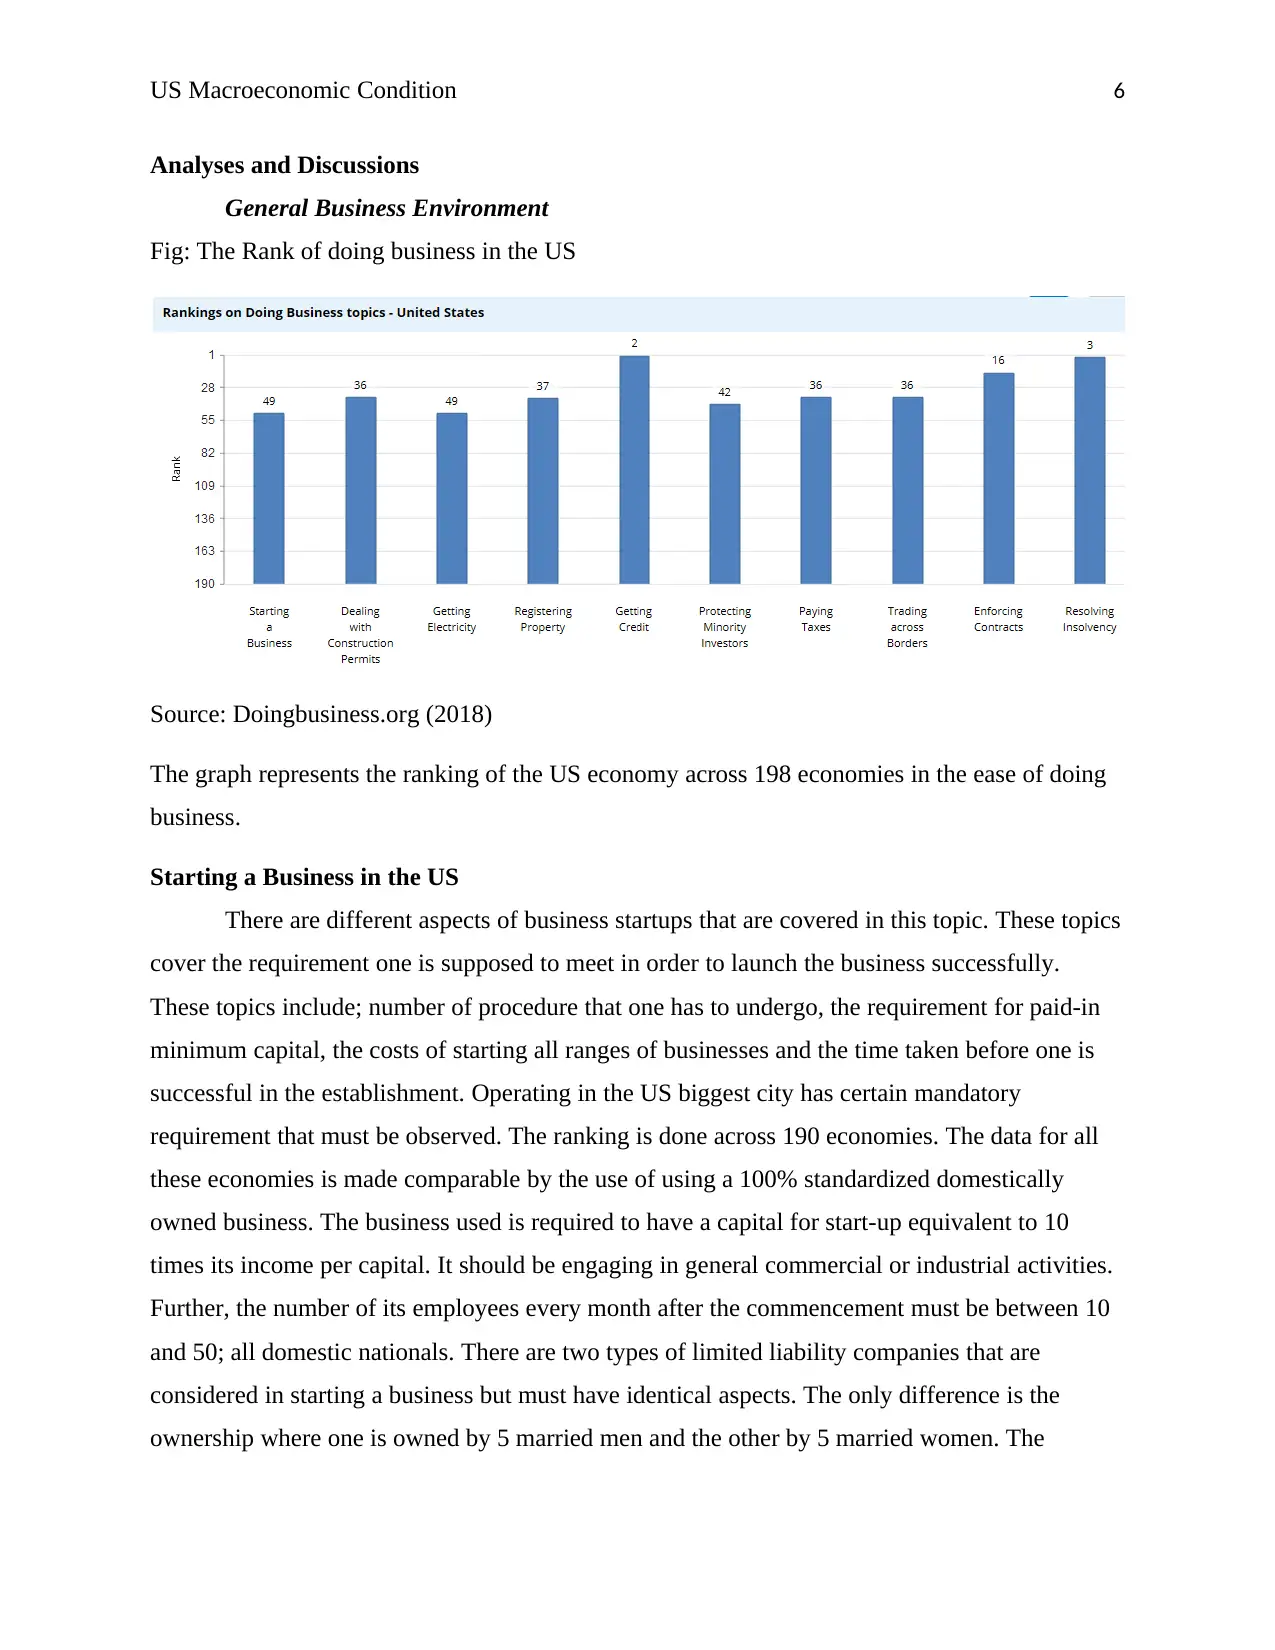
Fig: The Rank of doing business in the US
Source: Doingbusiness.org (2018)
The graph represents the ranking of the US economy across 198 economies in the ease of doing
business.
Starting a Business in the US
There are different aspects of business startups that are covered in this topic. These topics
cover the requirement one is supposed to meet in order to launch the business successfully.
These topics include; number of procedure that one has to undergo, the requirement for paid-in
minimum capital, the costs of starting all ranges of businesses and the time taken before one is
successful in the establishment. Operating in the US biggest city has certain mandatory
requirement that must be observed. The ranking is done across 190 economies. The data for all
these economies is made comparable by the use of using a 100% standardized domestically
owned business. The business used is required to have a capital for start-up equivalent to 10
times its income per capital. It should be engaging in general commercial or industrial activities.
Further, the number of its employees every month after the commencement must be between 10
and 50; all domestic nationals. There are two types of limited liability companies that are
considered in starting a business but must have identical aspects. The only difference is the
ownership where one is owned by 5 married men and the other by 5 married women. The
Analyses and Discussions
General Business Environment
Fig: The Rank of doing business in the US
Source: Doingbusiness.org (2018)
The graph represents the ranking of the US economy across 198 economies in the ease of doing
business.
Starting a Business in the US
There are different aspects of business startups that are covered in this topic. These topics
cover the requirement one is supposed to meet in order to launch the business successfully.
These topics include; number of procedure that one has to undergo, the requirement for paid-in
minimum capital, the costs of starting all ranges of businesses and the time taken before one is
successful in the establishment. Operating in the US biggest city has certain mandatory
requirement that must be observed. The ranking is done across 190 economies. The data for all
these economies is made comparable by the use of using a 100% standardized domestically
owned business. The business used is required to have a capital for start-up equivalent to 10
times its income per capital. It should be engaging in general commercial or industrial activities.
Further, the number of its employees every month after the commencement must be between 10
and 50; all domestic nationals. There are two types of limited liability companies that are
considered in starting a business but must have identical aspects. The only difference is the
ownership where one is owned by 5 married men and the other by 5 married women. The
⊘ This is a preview!⊘
Do you want full access?
Subscribe today to unlock all pages.
Trusted by 1+ million students worldwide
US Macroeconomic Condition 7
average of scores is obtained for each indicators component to determine the Distance to Frontier
(DTF) score.
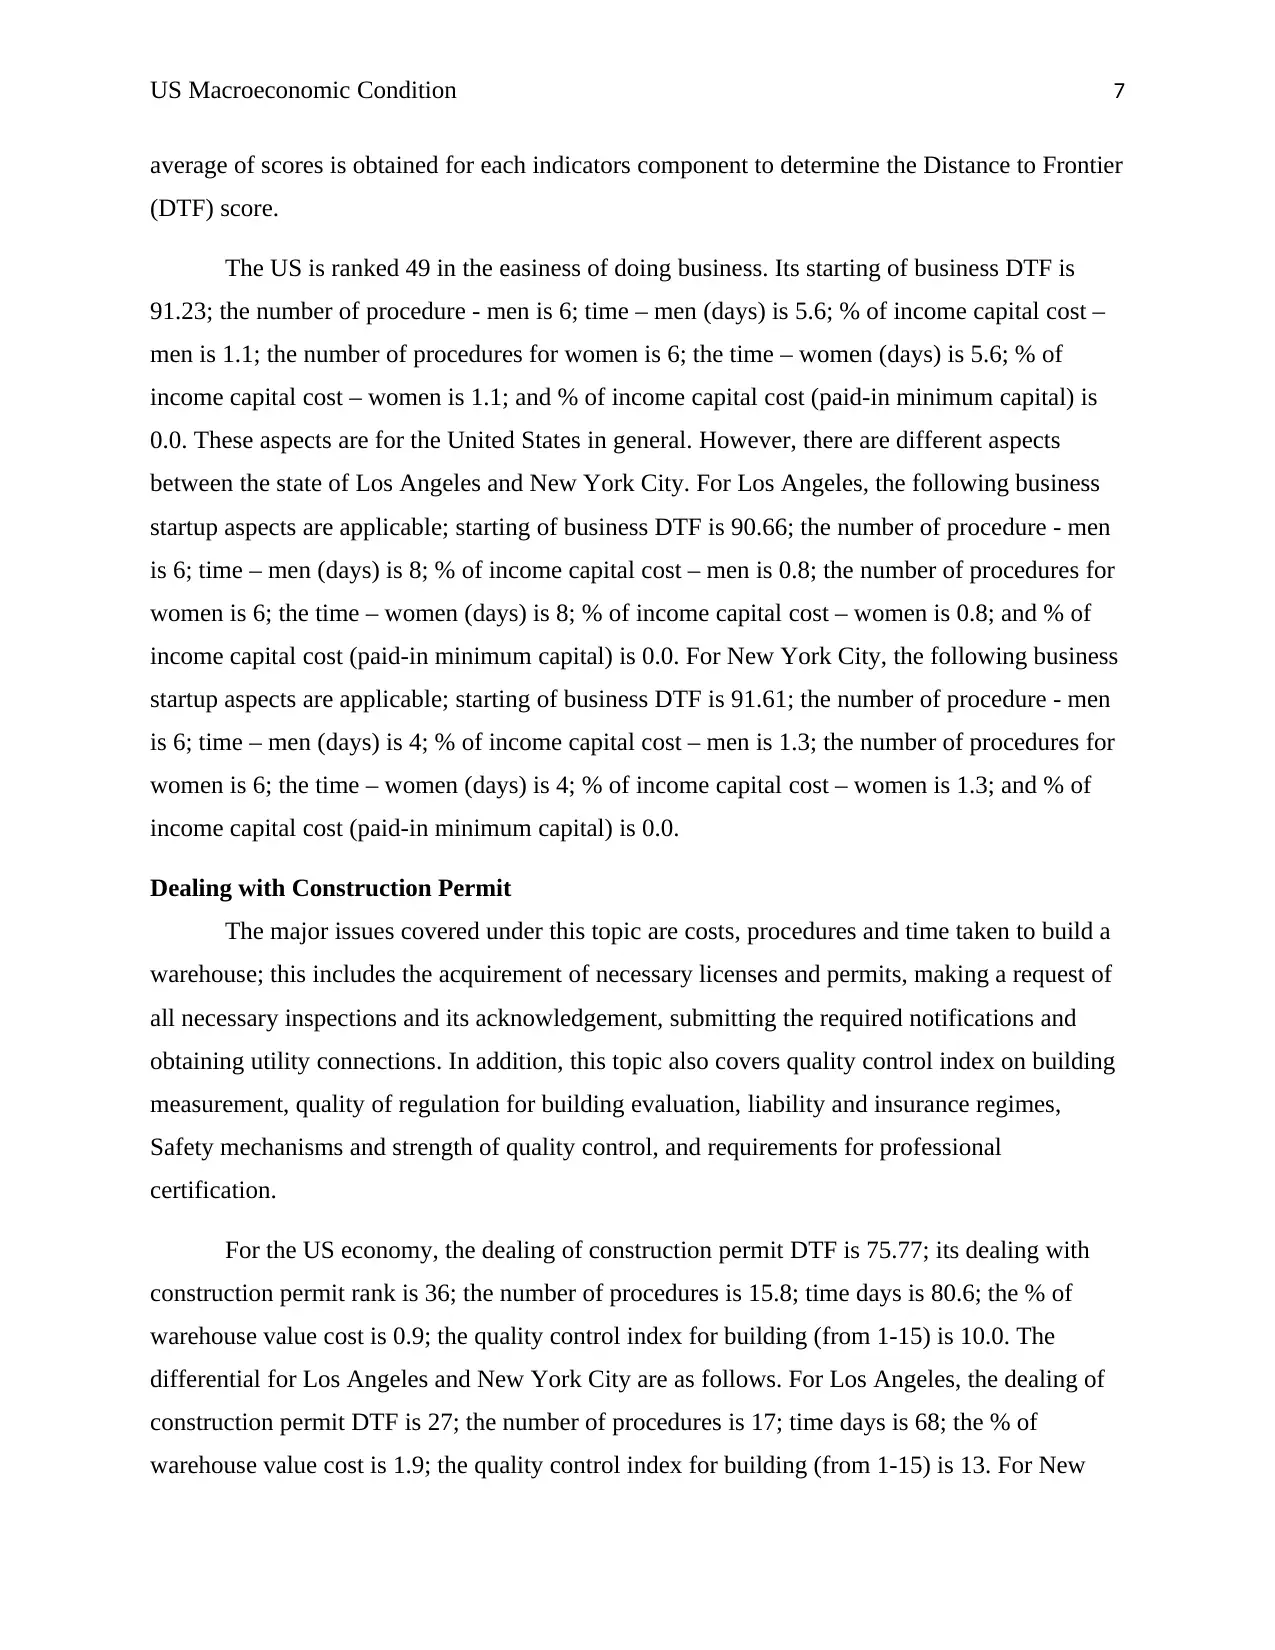
The US is ranked 49 in the easiness of doing business. Its starting of business DTF is
91.23; the number of procedure - men is 6; time – men (days) is 5.6; % of income capital cost –
men is 1.1; the number of procedures for women is 6; the time – women (days) is 5.6; % of
income capital cost – women is 1.1; and % of income capital cost (paid-in minimum capital) is
0.0. These aspects are for the United States in general. However, there are different aspects
between the state of Los Angeles and New York City. For Los Angeles, the following business
startup aspects are applicable; starting of business DTF is 90.66; the number of procedure - men
is 6; time – men (days) is 8; % of income capital cost – men is 0.8; the number of procedures for
women is 6; the time – women (days) is 8; % of income capital cost – women is 0.8; and % of
income capital cost (paid-in minimum capital) is 0.0. For New York City, the following business
startup aspects are applicable; starting of business DTF is 91.61; the number of procedure - men
is 6; time – men (days) is 4; % of income capital cost – men is 1.3; the number of procedures for
women is 6; the time – women (days) is 4; % of income capital cost – women is 1.3; and % of
income capital cost (paid-in minimum capital) is 0.0.
Dealing with Construction Permit
The major issues covered under this topic are costs, procedures and time taken to build a
warehouse; this includes the acquirement of necessary licenses and permits, making a request of
all necessary inspections and its acknowledgement, submitting the required notifications and
obtaining utility connections. In addition, this topic also covers quality control index on building
measurement, quality of regulation for building evaluation, liability and insurance regimes,
Safety mechanisms and strength of quality control, and requirements for professional
certification.
For the US economy, the dealing of construction permit DTF is 75.77; its dealing with
construction permit rank is 36; the number of procedures is 15.8; time days is 80.6; the % of
warehouse value cost is 0.9; the quality control index for building (from 1-15) is 10.0. The
differential for Los Angeles and New York City are as follows. For Los Angeles, the dealing of
construction permit DTF is 27; the number of procedures is 17; time days is 68; the % of
warehouse value cost is 1.9; the quality control index for building (from 1-15) is 13. For New
average of scores is obtained for each indicators component to determine the Distance to Frontier
(DTF) score.
The US is ranked 49 in the easiness of doing business. Its starting of business DTF is
91.23; the number of procedure - men is 6; time – men (days) is 5.6; % of income capital cost –
men is 1.1; the number of procedures for women is 6; the time – women (days) is 5.6; % of
income capital cost – women is 1.1; and % of income capital cost (paid-in minimum capital) is
0.0. These aspects are for the United States in general. However, there are different aspects
between the state of Los Angeles and New York City. For Los Angeles, the following business
startup aspects are applicable; starting of business DTF is 90.66; the number of procedure - men
is 6; time – men (days) is 8; % of income capital cost – men is 0.8; the number of procedures for
women is 6; the time – women (days) is 8; % of income capital cost – women is 0.8; and % of
income capital cost (paid-in minimum capital) is 0.0. For New York City, the following business
startup aspects are applicable; starting of business DTF is 91.61; the number of procedure - men
is 6; time – men (days) is 4; % of income capital cost – men is 1.3; the number of procedures for
women is 6; the time – women (days) is 4; % of income capital cost – women is 1.3; and % of
income capital cost (paid-in minimum capital) is 0.0.
Dealing with Construction Permit
The major issues covered under this topic are costs, procedures and time taken to build a
warehouse; this includes the acquirement of necessary licenses and permits, making a request of
all necessary inspections and its acknowledgement, submitting the required notifications and
obtaining utility connections. In addition, this topic also covers quality control index on building
measurement, quality of regulation for building evaluation, liability and insurance regimes,
Safety mechanisms and strength of quality control, and requirements for professional
certification.
For the US economy, the dealing of construction permit DTF is 75.77; its dealing with
construction permit rank is 36; the number of procedures is 15.8; time days is 80.6; the % of
warehouse value cost is 0.9; the quality control index for building (from 1-15) is 10.0. The
differential for Los Angeles and New York City are as follows. For Los Angeles, the dealing of
construction permit DTF is 27; the number of procedures is 17; time days is 68; the % of
warehouse value cost is 1.9; the quality control index for building (from 1-15) is 13. For New
Paraphrase This Document
Need a fresh take? Get an instant paraphrase of this document with our AI Paraphraser
US Macroeconomic Condition 8
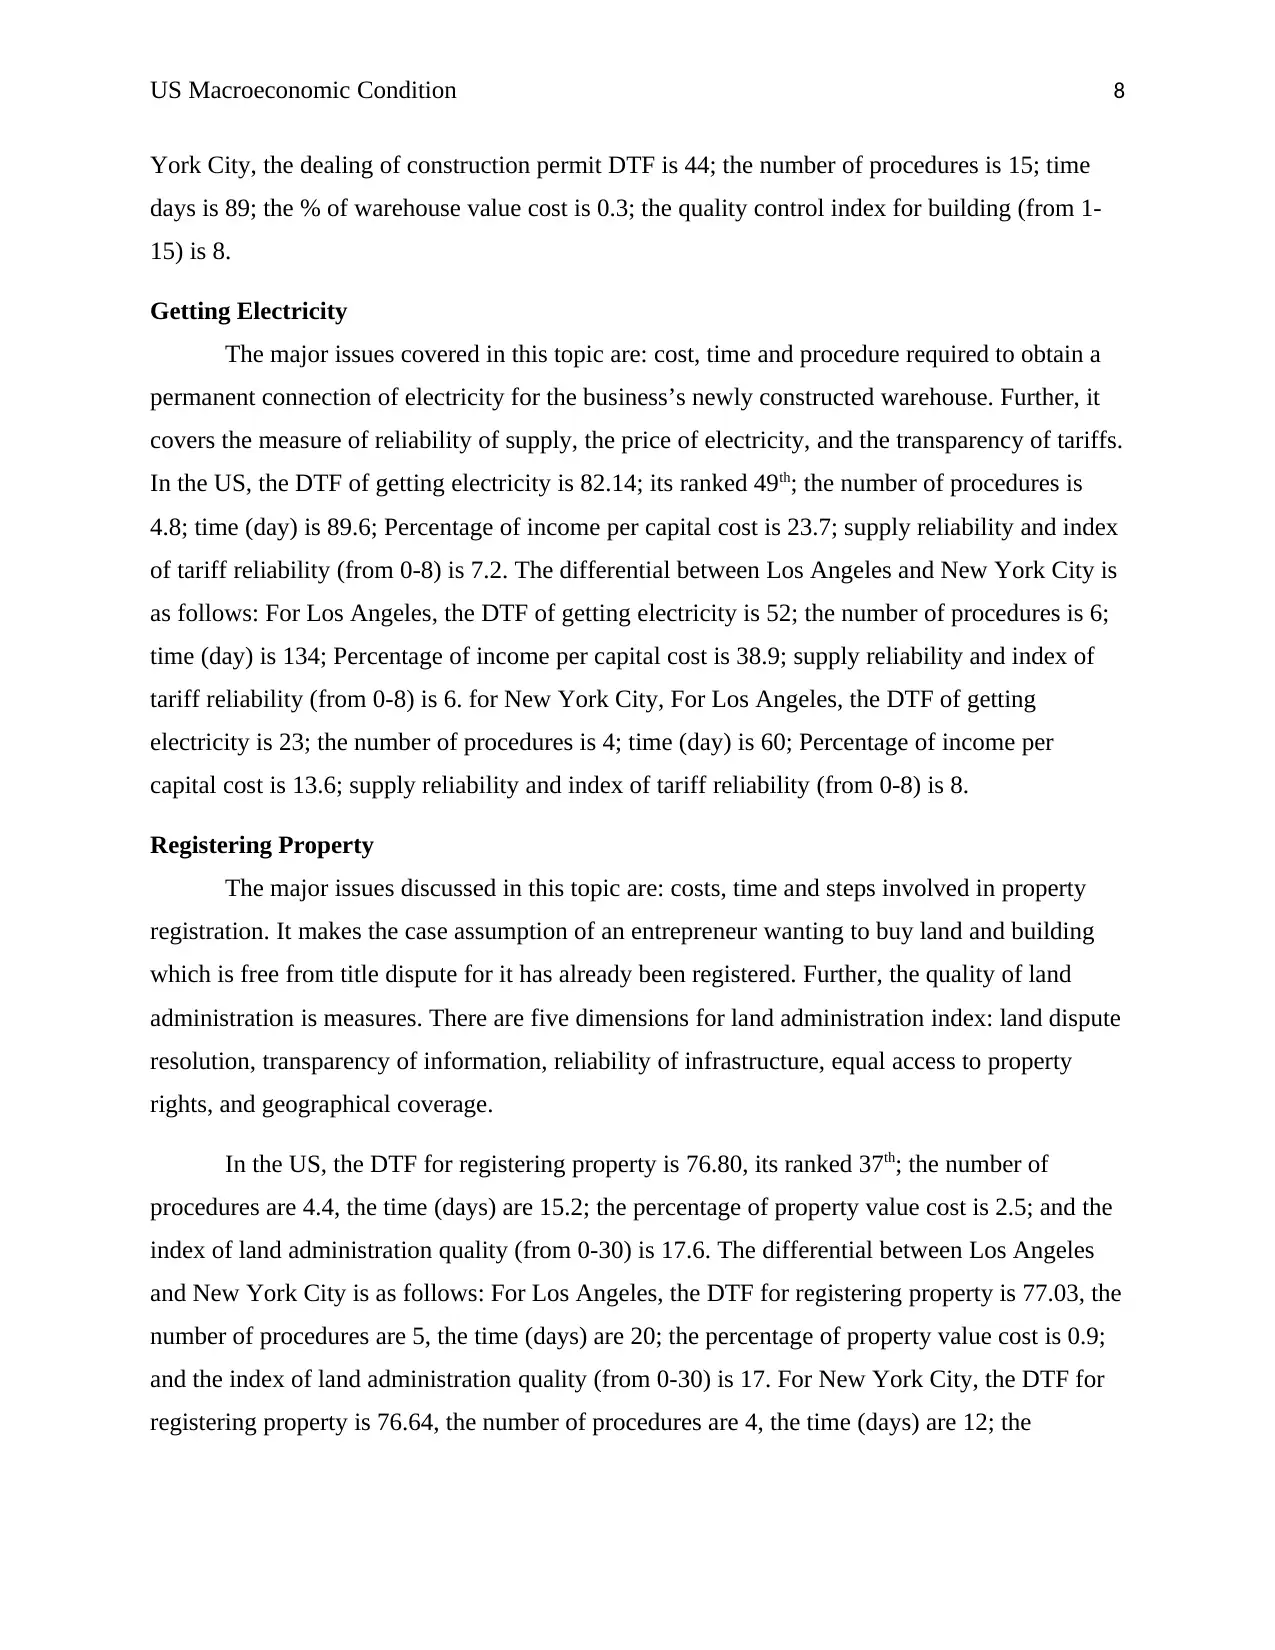
York City, the dealing of construction permit DTF is 44; the number of procedures is 15; time
days is 89; the % of warehouse value cost is 0.3; the quality control index for building (from 1-
15) is 8.
Getting Electricity
The major issues covered in this topic are: cost, time and procedure required to obtain a
permanent connection of electricity for the business’s newly constructed warehouse. Further, it
covers the measure of reliability of supply, the price of electricity, and the transparency of tariffs.
In the US, the DTF of getting electricity is 82.14; its ranked 49th; the number of procedures is
4.8; time (day) is 89.6; Percentage of income per capital cost is 23.7; supply reliability and index
of tariff reliability (from 0-8) is 7.2. The differential between Los Angeles and New York City is
as follows: For Los Angeles, the DTF of getting electricity is 52; the number of procedures is 6;
time (day) is 134; Percentage of income per capital cost is 38.9; supply reliability and index of
tariff reliability (from 0-8) is 6. for New York City, For Los Angeles, the DTF of getting
electricity is 23; the number of procedures is 4; time (day) is 60; Percentage of income per
capital cost is 13.6; supply reliability and index of tariff reliability (from 0-8) is 8.
Registering Property
The major issues discussed in this topic are: costs, time and steps involved in property
registration. It makes the case assumption of an entrepreneur wanting to buy land and building
which is free from title dispute for it has already been registered. Further, the quality of land
administration is measures. There are five dimensions for land administration index: land dispute
resolution, transparency of information, reliability of infrastructure, equal access to property
rights, and geographical coverage.
In the US, the DTF for registering property is 76.80, its ranked 37th; the number of
procedures are 4.4, the time (days) are 15.2; the percentage of property value cost is 2.5; and the
index of land administration quality (from 0-30) is 17.6. The differential between Los Angeles
and New York City is as follows: For Los Angeles, the DTF for registering property is 77.03, the
number of procedures are 5, the time (days) are 20; the percentage of property value cost is 0.9;
and the index of land administration quality (from 0-30) is 17. For New York City, the DTF for
registering property is 76.64, the number of procedures are 4, the time (days) are 12; the
US Macroeconomic Condition 9
percentage of property value cost is 3.5; and the index of land administration quality (from 0-30)
is 18.
Getting Credit
There are only two major issues covered in this topic. These are: How strong is the credit
reporting system and how effective the collateral and bankruptcy laws are in facilitating lending.
In the US, the DTF of getting credit is 95; its ranked 2nd; the index of legal rights strength (from
0-12) is 11; the index of credit information depth (from 0-8) is 8; the percentage of adults
covered in the credit registry is 0.0; the percentage of adults covered by the credit bureau is
100.0. All this aspects of getting credit are equal for Los Angeles and New York City.
Protecting Minority Investors
The major issues covered in this topic are: the rights of shareholders, how strong the
protections of minority shareholders are in ensuring that the business directors do not misuse the
corporate assets for personal gains. Further, it covers governance safeguards and the requirement
for corporate transparency in order to reduce abuse risks (Doingbusiness.org, 2018). In the US,
the DTF for protecting minority investors is 64.67; its ranked 42nd; the index of conflict of
interest regulation (from 0-10) is 8.3; and the index of shareholder governance (from 0-10) is 4.6.
Paying Taxes
The issues covered in this topic are the tax amounts and mandatory contributions payable
by a medium-sized company in a given year. Further it measures administrative burden incurred
in tax payment and contributions. In the US, the DTF of paying taxes is 84.13; its ranked 36th;
the number of payment per year is 10.6; time (hours per year) is 175; the rate of total tax and
contribution (% of profit) is 43.8; and the index of postfiling (from 0-100) is 94.04.
Trading Across Borders
This issues covered in this topic include the cost and time spent on the logistical process
of goods importation and exportation. The measurement of cost for this processes excludes
tariffs. There are three procedural sets that are associated with this measurement; Domestic
transport, documentary compliance and border compliance. In the US, the DTF of trading across
borders is 92.01; its ranked 36th; the number of hours requirement for export boarder compliance
is 1.5; the boarder compliance cost of exporting (USD) is 175; the hours of documentary
compliance in exporting is 1.5; the documentary compliance cost on export (USD) is 60; the
⊘ This is a preview!⊘
Do you want full access?
Subscribe today to unlock all pages.
Trusted by 1+ million students worldwide
US Macroeconomic Condition 10
hours of boarder compliance on imports is 1.5; the boarder compliance cost on imports (USD) is
175; the number of hours for documentary compliance on imports is 7.5; and the cost of
documentary compliance on imports (USD) is 100.
Enforcing Contracts
The issues covered in this topic include the cost and time spent in resolving of a
commercial dispute; the local first-instance court is the base for the resolving. Further, it covers
the quality index of judicial processes, and it also carry out an evaluation to determine the
adoption of good practices by each economy in the promotion of efficiency and quality in the
court system (Doingbusiness.org, 2018). In the US, the DTF of enforcing contract is 72.61; its
ranked 16th; time (days) is 120; Percentage of claim value cost is 30.5; and the index quality of
judicial processes (from 0-18) is 13.8. The percentage of claim value cost in New York City is
lower than for Los Angeles.
Resolving Insolvency
The issues covered in this topic include outcome of insolvency, time and cost on
proceeding; this involves the domestic legal entities. The recovery rate is calculate by using these
variables. It represent the dollars cents recovered by secured creditors through debt enforcement,
liquidation and reorganization. In the US, the DTF of resolving insolvency is 91.07; its ranked
3rd; dollar cents recovery rate is 82.1; time is 1 year; percentage of estate cost is 10.0; outcome is
1 as a going concern; and index of insolvency framework strength (from 0-16) is 15.
Paraphrase This Document
Need a fresh take? Get an instant paraphrase of this document with our AI Paraphraser
US Macroeconomic Condition 11
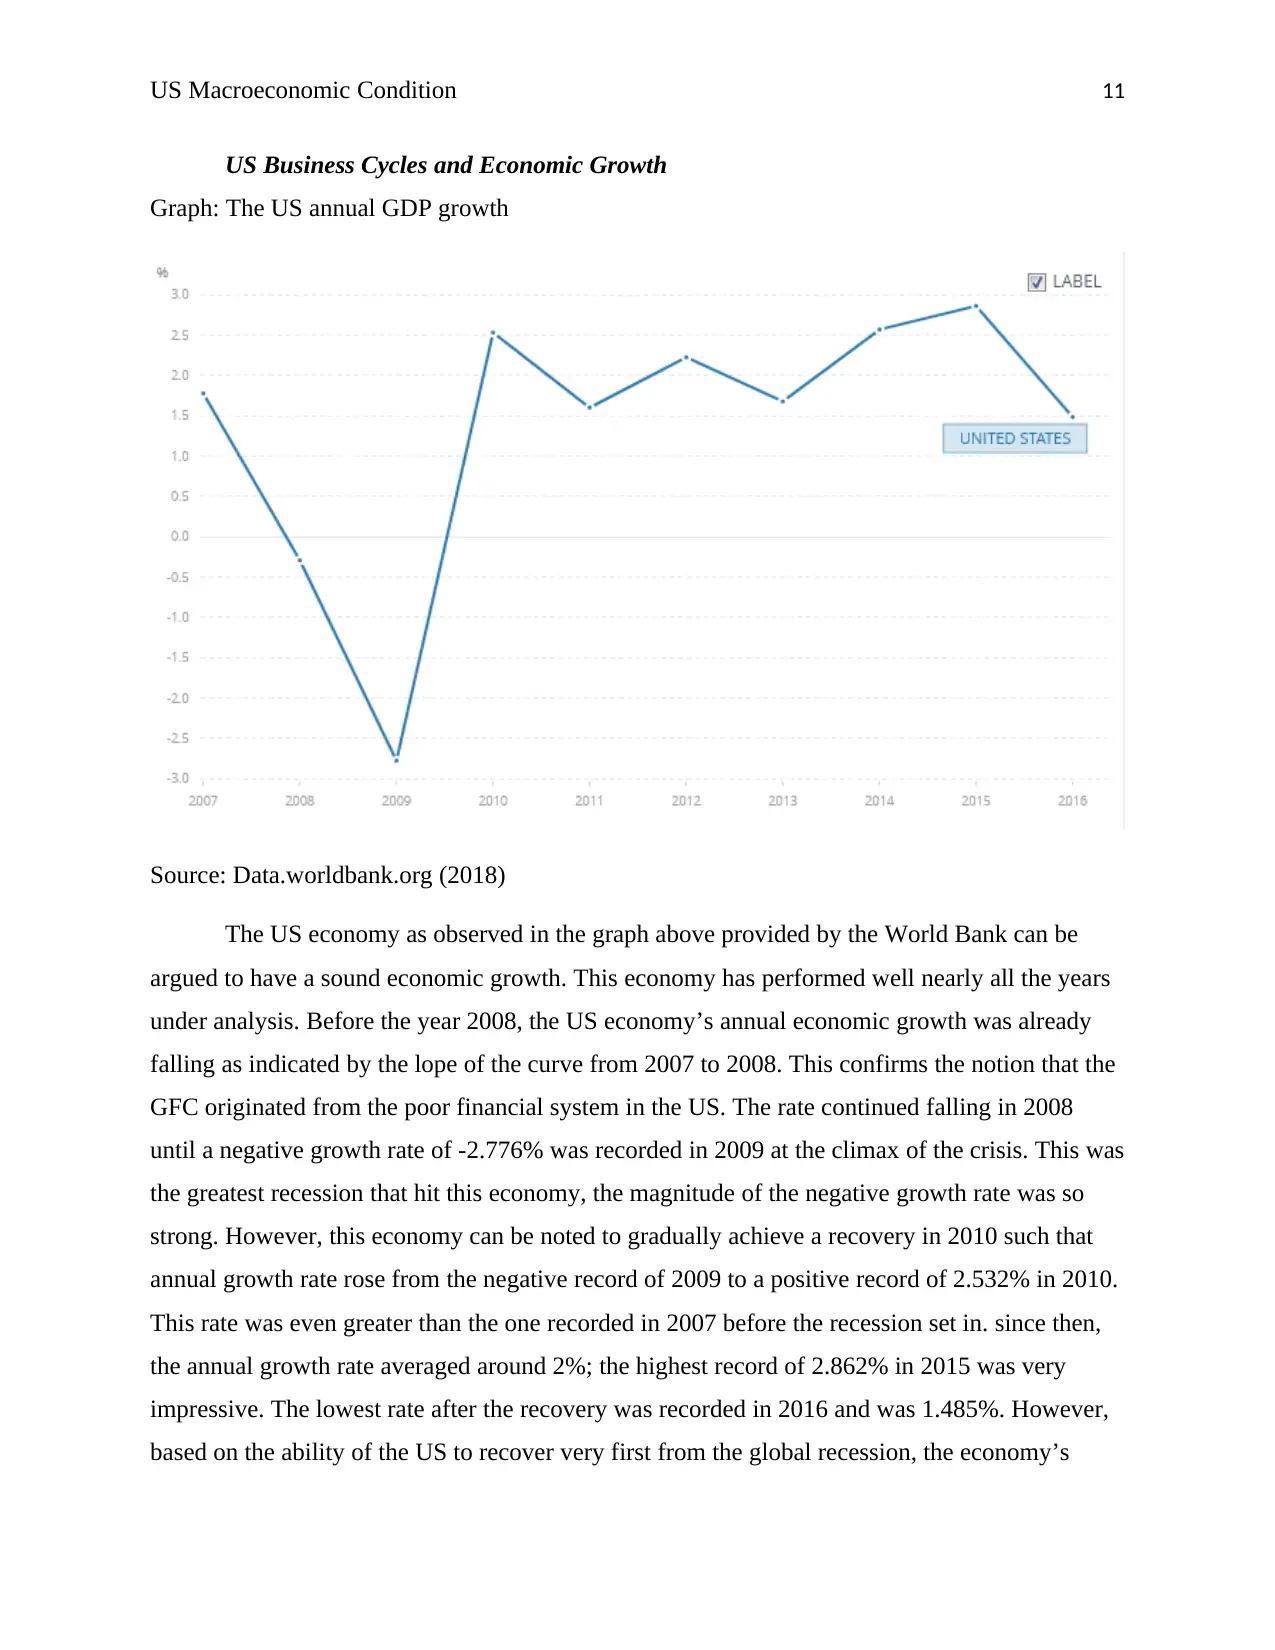
US Business Cycles and Economic Growth
Graph: The US annual GDP growth
Source: Data.worldbank.org (2018)
The US economy as observed in the graph above provided by the World Bank can be
argued to have a sound economic growth. This economy has performed well nearly all the years
under analysis. Before the year 2008, the US economy’s annual economic growth was already
falling as indicated by the lope of the curve from 2007 to 2008. This confirms the notion that the
GFC originated from the poor financial system in the US. The rate continued falling in 2008
until a negative growth rate of -2.776% was recorded in 2009 at the climax of the crisis. This was
the greatest recession that hit this economy, the magnitude of the negative growth rate was so
strong. However, this economy can be noted to gradually achieve a recovery in 2010 such that
annual growth rate rose from the negative record of 2009 to a positive record of 2.532% in 2010.
This rate was even greater than the one recorded in 2007 before the recession set in. since then,
the annual growth rate averaged around 2%; the highest record of 2.862% in 2015 was very
impressive. The lowest rate after the recovery was recorded in 2016 and was 1.485%. However,
based on the ability of the US to recover very first from the global recession, the economy’s
US Macroeconomic Condition 12
annual growth rate is expected to remain higher in the coming years. A high economic growth
rate according to many economists represents a good performance for businesses. Thus, it can be
concluded that the economic growth in the US is supportive for doing business. Businesses are
thriving well and the investors’ confidence have been heightened.
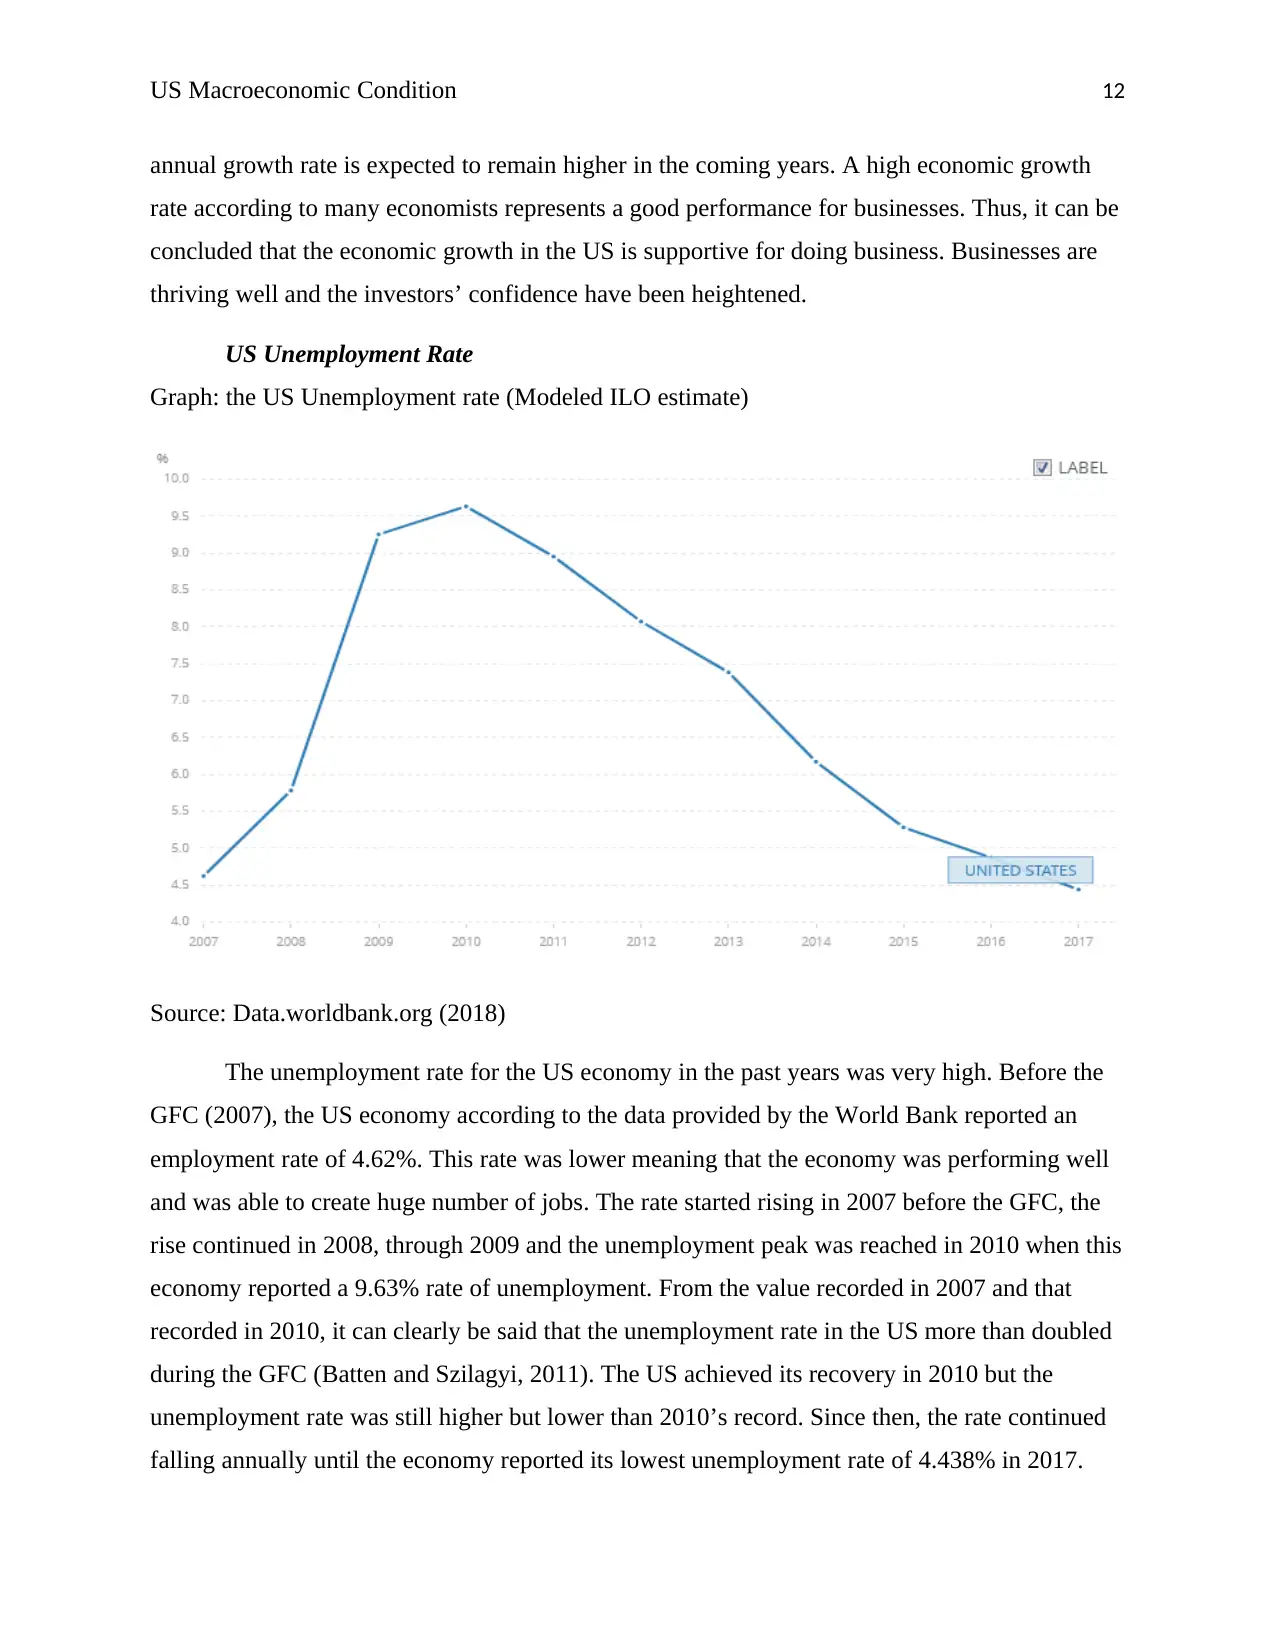
US Unemployment Rate
Graph: the US Unemployment rate (Modeled ILO estimate)
Source: Data.worldbank.org (2018)
The unemployment rate for the US economy in the past years was very high. Before the
GFC (2007), the US economy according to the data provided by the World Bank reported an
employment rate of 4.62%. This rate was lower meaning that the economy was performing well
and was able to create huge number of jobs. The rate started rising in 2007 before the GFC, the
rise continued in 2008, through 2009 and the unemployment peak was reached in 2010 when this
economy reported a 9.63% rate of unemployment. From the value recorded in 2007 and that
recorded in 2010, it can clearly be said that the unemployment rate in the US more than doubled
during the GFC (Batten and Szilagyi, 2011). The US achieved its recovery in 2010 but the
unemployment rate was still higher but lower than 2010’s record. Since then, the rate continued
falling annually until the economy reported its lowest unemployment rate of 4.438% in 2017.
annual growth rate is expected to remain higher in the coming years. A high economic growth
rate according to many economists represents a good performance for businesses. Thus, it can be
concluded that the economic growth in the US is supportive for doing business. Businesses are
thriving well and the investors’ confidence have been heightened.
US Unemployment Rate
Graph: the US Unemployment rate (Modeled ILO estimate)
Source: Data.worldbank.org (2018)
The unemployment rate for the US economy in the past years was very high. Before the
GFC (2007), the US economy according to the data provided by the World Bank reported an
employment rate of 4.62%. This rate was lower meaning that the economy was performing well
and was able to create huge number of jobs. The rate started rising in 2007 before the GFC, the
rise continued in 2008, through 2009 and the unemployment peak was reached in 2010 when this
economy reported a 9.63% rate of unemployment. From the value recorded in 2007 and that
recorded in 2010, it can clearly be said that the unemployment rate in the US more than doubled
during the GFC (Batten and Szilagyi, 2011). The US achieved its recovery in 2010 but the
unemployment rate was still higher but lower than 2010’s record. Since then, the rate continued
falling annually until the economy reported its lowest unemployment rate of 4.438% in 2017.
⊘ This is a preview!⊘
Do you want full access?
Subscribe today to unlock all pages.
Trusted by 1+ million students worldwide
1 out of 25
Related Documents


Your All-in-One AI-Powered Toolkit for Academic Success.
+13062052269
info@desklib.com
Available 24*7 on WhatsApp / Email
![[object Object]](/_next/static/media/star-bottom.7253800d.svg)
Unlock your academic potential
Copyright © 2020–2026 A2Z Services. All Rights Reserved. Developed and managed by ZUCOL.