OPAIC Economics: Macroeconomic Models, Government Impact, and Trade
VerifiedAdded on 2023/06/09
|23
|4046
|216
Homework Assignment
AI Summary
This economics assignment provides a comprehensive analysis of macroeconomic concepts and models, focusing on the impact of government policies and international trade. It covers topics such as the Consumer Price Index (CPI) calculation, GDP measurement using expenditure and income methods, and the effects of various economic events on aggregate demand and supply curves. The assignment also discusses the advantages and disadvantages of economic growth, the role of monetary and fiscal policies in stabilizing the economy, and the comparative advantage in international trade between New Zealand and Australia. Through detailed explanations and graphical representations, this assignment offers a clear understanding of key macroeconomic principles and their practical implications. Desklib provides access to this and other solved assignments to support students in their studies.

Running head: ECONOMICS COURSE
Economics Course
Name of the student
Name of the university
Author Note
Economics Course
Name of the student
Name of the university
Author Note
Paraphrase This Document
Need a fresh take? Get an instant paraphrase of this document with our AI Paraphraser
1ECONOMICS COURSE
Table of Contents
Section A:...................................................................................................................................3
Answer 1:...............................................................................................................................3
Answer 2:...............................................................................................................................3
a).............................................................................................................................................3
b)............................................................................................................................................5
c).............................................................................................................................................5
d)............................................................................................................................................6
e).............................................................................................................................................6
f).............................................................................................................................................6
Section B:...................................................................................................................................8
1)............................................................................................................................................8
2)............................................................................................................................................8
3)............................................................................................................................................9
4)............................................................................................................................................9
5)..........................................................................................................................................11
i)...........................................................................................................................................11
ii)..........................................................................................................................................12
Section C:.................................................................................................................................13
Q 1).......................................................................................................................................13
Q2)........................................................................................................................................14
2ECONOMICS COURSE
Q3)........................................................................................................................................15
Section D:.................................................................................................................................16
Q 1).......................................................................................................................................16
a)...........................................................................................................................................16
b)..........................................................................................................................................16
c)...........................................................................................................................................17
d)..........................................................................................................................................17
Q.2)...........................................................................................................................................17
b)..........................................................................................................................................18
c)...........................................................................................................................................18
d)..........................................................................................................................................19
e)...........................................................................................................................................19
f)...........................................................................................................................................19
Q. 3)......................................................................................................................................20
b)..........................................................................................................................................21
c)...........................................................................................................................................22
References:...............................................................................................................................23
⊘ This is a preview!⊘
Do you want full access?
Subscribe today to unlock all pages.
Trusted by 1+ million students worldwide
3ECONOMICS COURSE
Section A:
Answer 1:
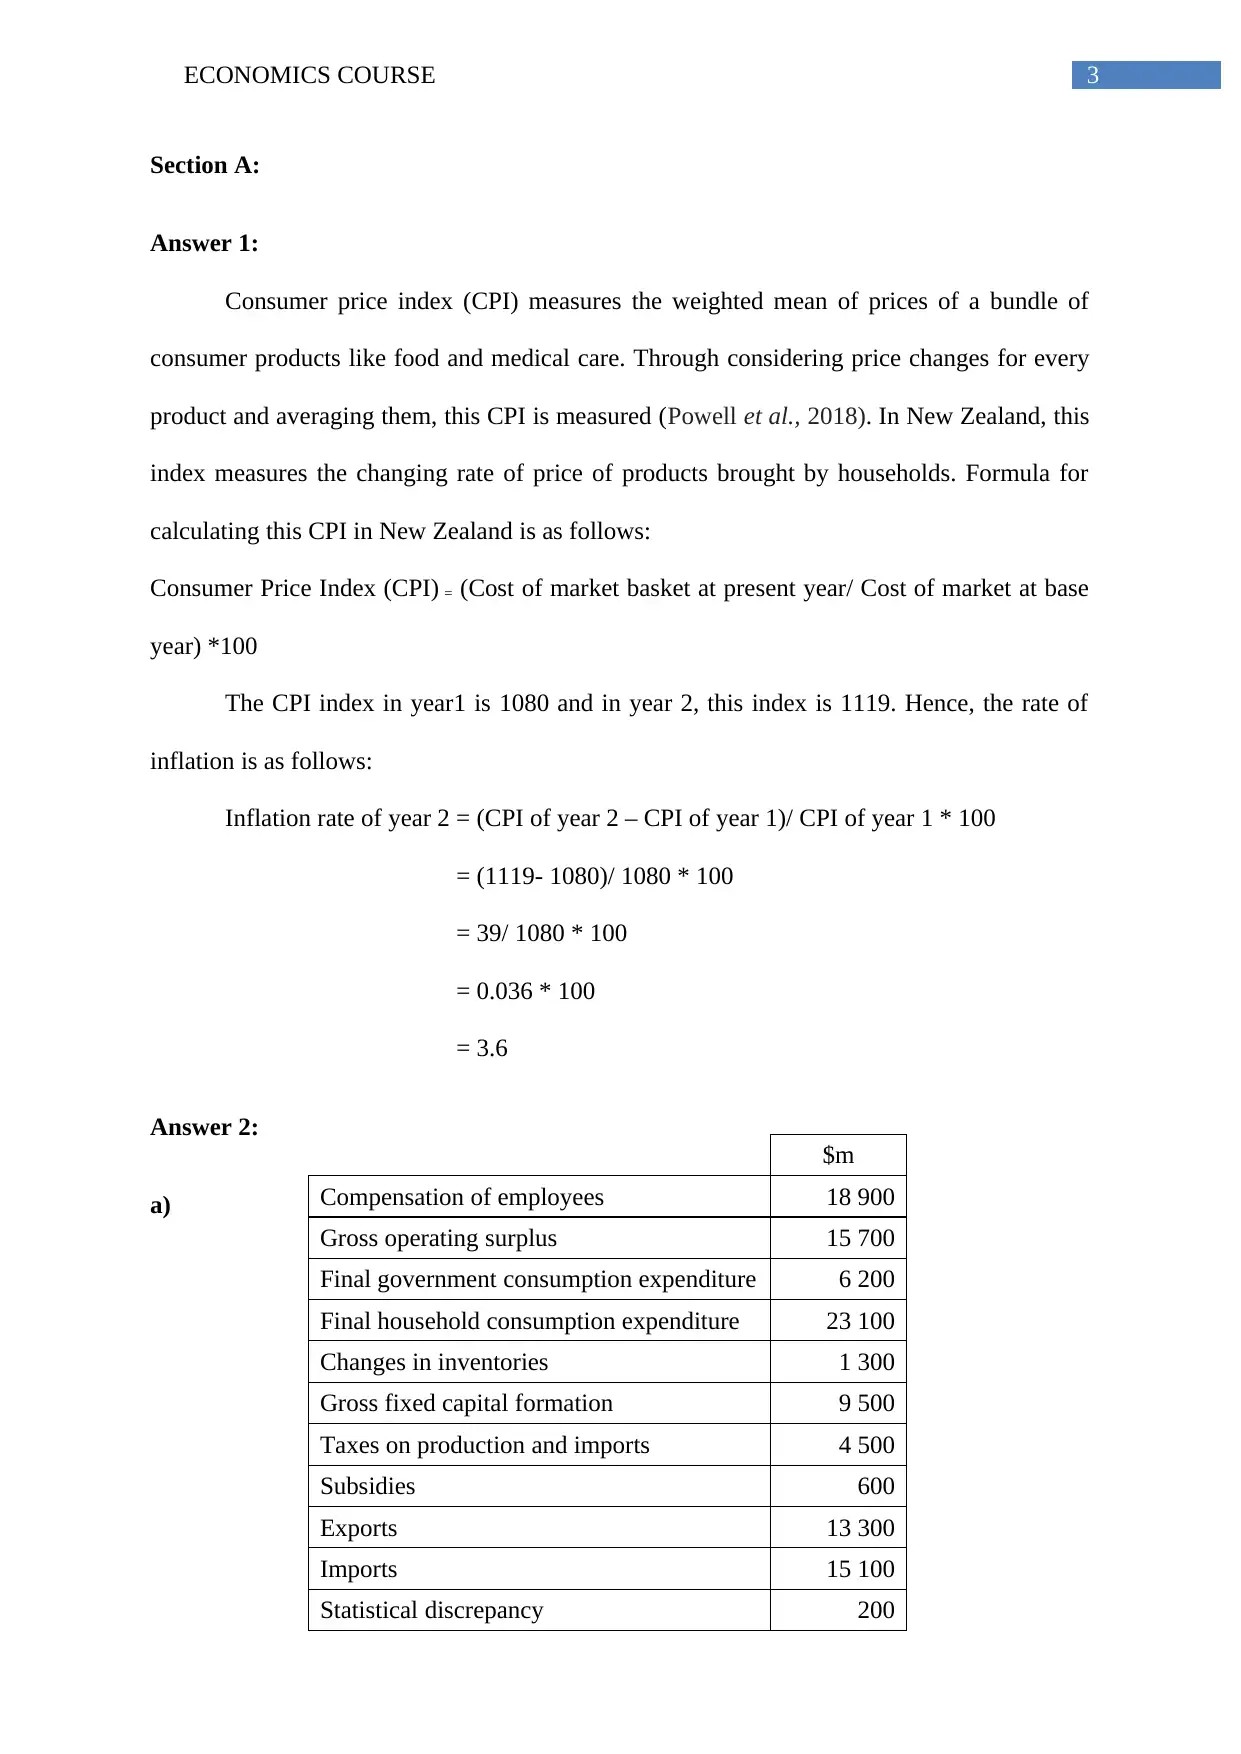
Consumer price index (CPI) measures the weighted mean of prices of a bundle of
consumer products like food and medical care. Through considering price changes for every
product and averaging them, this CPI is measured (Powell et al., 2018). In New Zealand, this
index measures the changing rate of price of products brought by households. Formula for
calculating this CPI in New Zealand is as follows:
Consumer Price Index (CPI) = (Cost of market basket at present year/ Cost of market at base
year) *100
The CPI index in year1 is 1080 and in year 2, this index is 1119. Hence, the rate of
inflation is as follows:
Inflation rate of year 2 = (CPI of year 2 – CPI of year 1)/ CPI of year 1 * 100
= (1119- 1080)/ 1080 * 100
= 39/ 1080 * 100
= 0.036 * 100
= 3.6
Answer 2:
a)
$m
Compensation of employees 18 900
Gross operating surplus 15 700
Final government consumption expenditure 6 200
Final household consumption expenditure 23 100
Changes in inventories 1 300
Gross fixed capital formation 9 500
Taxes on production and imports 4 500
Subsidies 600
Exports 13 300
Imports 15 100
Statistical discrepancy 200
Section A:
Answer 1:
Consumer price index (CPI) measures the weighted mean of prices of a bundle of
consumer products like food and medical care. Through considering price changes for every
product and averaging them, this CPI is measured (Powell et al., 2018). In New Zealand, this
index measures the changing rate of price of products brought by households. Formula for
calculating this CPI in New Zealand is as follows:
Consumer Price Index (CPI) = (Cost of market basket at present year/ Cost of market at base
year) *100
The CPI index in year1 is 1080 and in year 2, this index is 1119. Hence, the rate of
inflation is as follows:
Inflation rate of year 2 = (CPI of year 2 – CPI of year 1)/ CPI of year 1 * 100
= (1119- 1080)/ 1080 * 100
= 39/ 1080 * 100
= 0.036 * 100
= 3.6
Answer 2:
a)
$m
Compensation of employees 18 900
Gross operating surplus 15 700
Final government consumption expenditure 6 200
Final household consumption expenditure 23 100
Changes in inventories 1 300
Gross fixed capital formation 9 500
Taxes on production and imports 4 500
Subsidies 600
Exports 13 300
Imports 15 100
Statistical discrepancy 200
Paraphrase This Document
Need a fresh take? Get an instant paraphrase of this document with our AI Paraphraser
4ECONOMICS COURSE
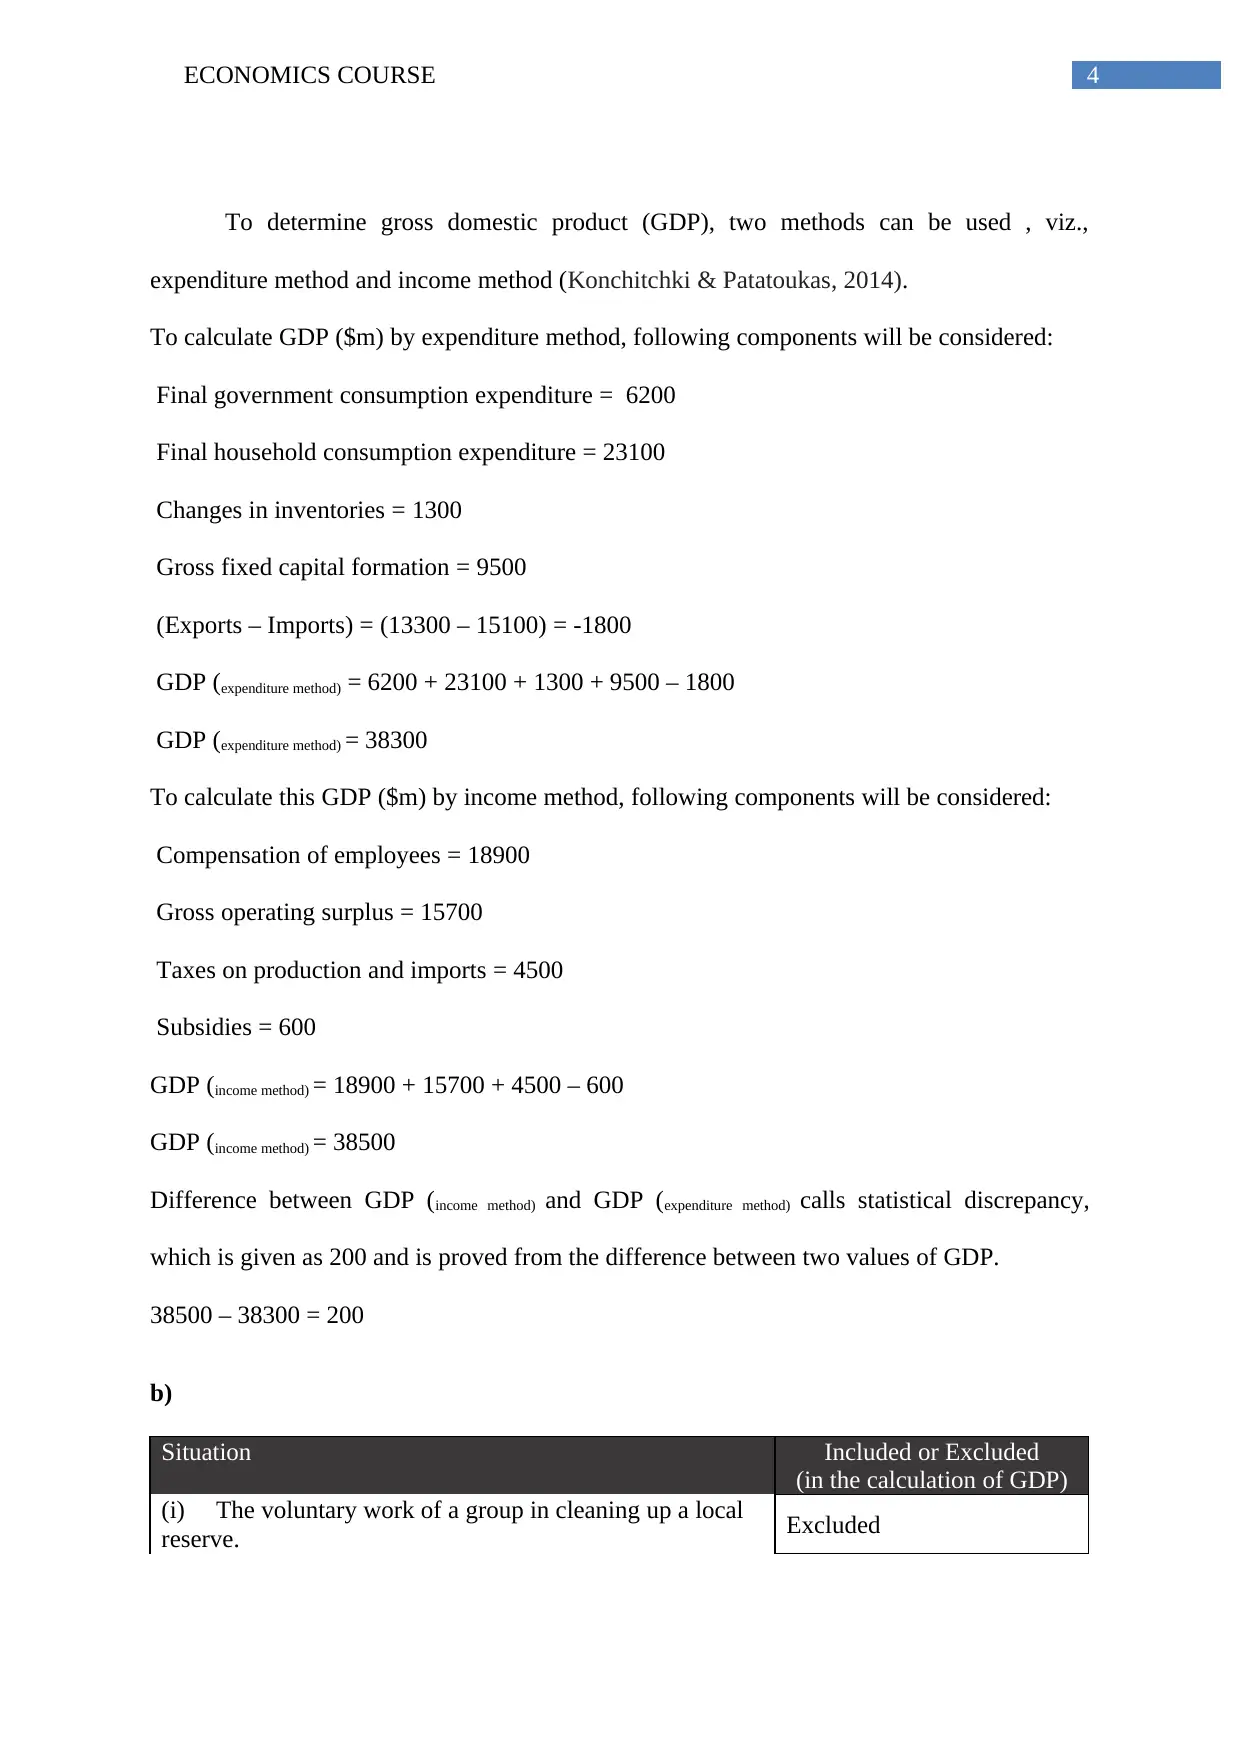
To determine gross domestic product (GDP), two methods can be used , viz.,
expenditure method and income method (Konchitchki & Patatoukas, 2014).
To calculate GDP ($m) by expenditure method, following components will be considered:
Final government consumption expenditure = 6200
Final household consumption expenditure = 23100
Changes in inventories = 1300
Gross fixed capital formation = 9500
(Exports – Imports) = (13300 – 15100) = -1800
GDP (expenditure method) = 6200 + 23100 + 1300 + 9500 – 1800
GDP (expenditure method) = 38300
To calculate this GDP ($m) by income method, following components will be considered:
Compensation of employees = 18900
Gross operating surplus = 15700
Taxes on production and imports = 4500
Subsidies = 600
GDP (income method) = 18900 + 15700 + 4500 – 600
GDP (income method) = 38500
Difference between GDP (income method) and GDP (expenditure method) calls statistical discrepancy,
which is given as 200 and is proved from the difference between two values of GDP.
38500 – 38300 = 200
b)
Situation Included or Excluded
(in the calculation of GDP)
(i) The voluntary work of a group in cleaning up a local
reserve. Excluded
5ECONOMICS COURSE
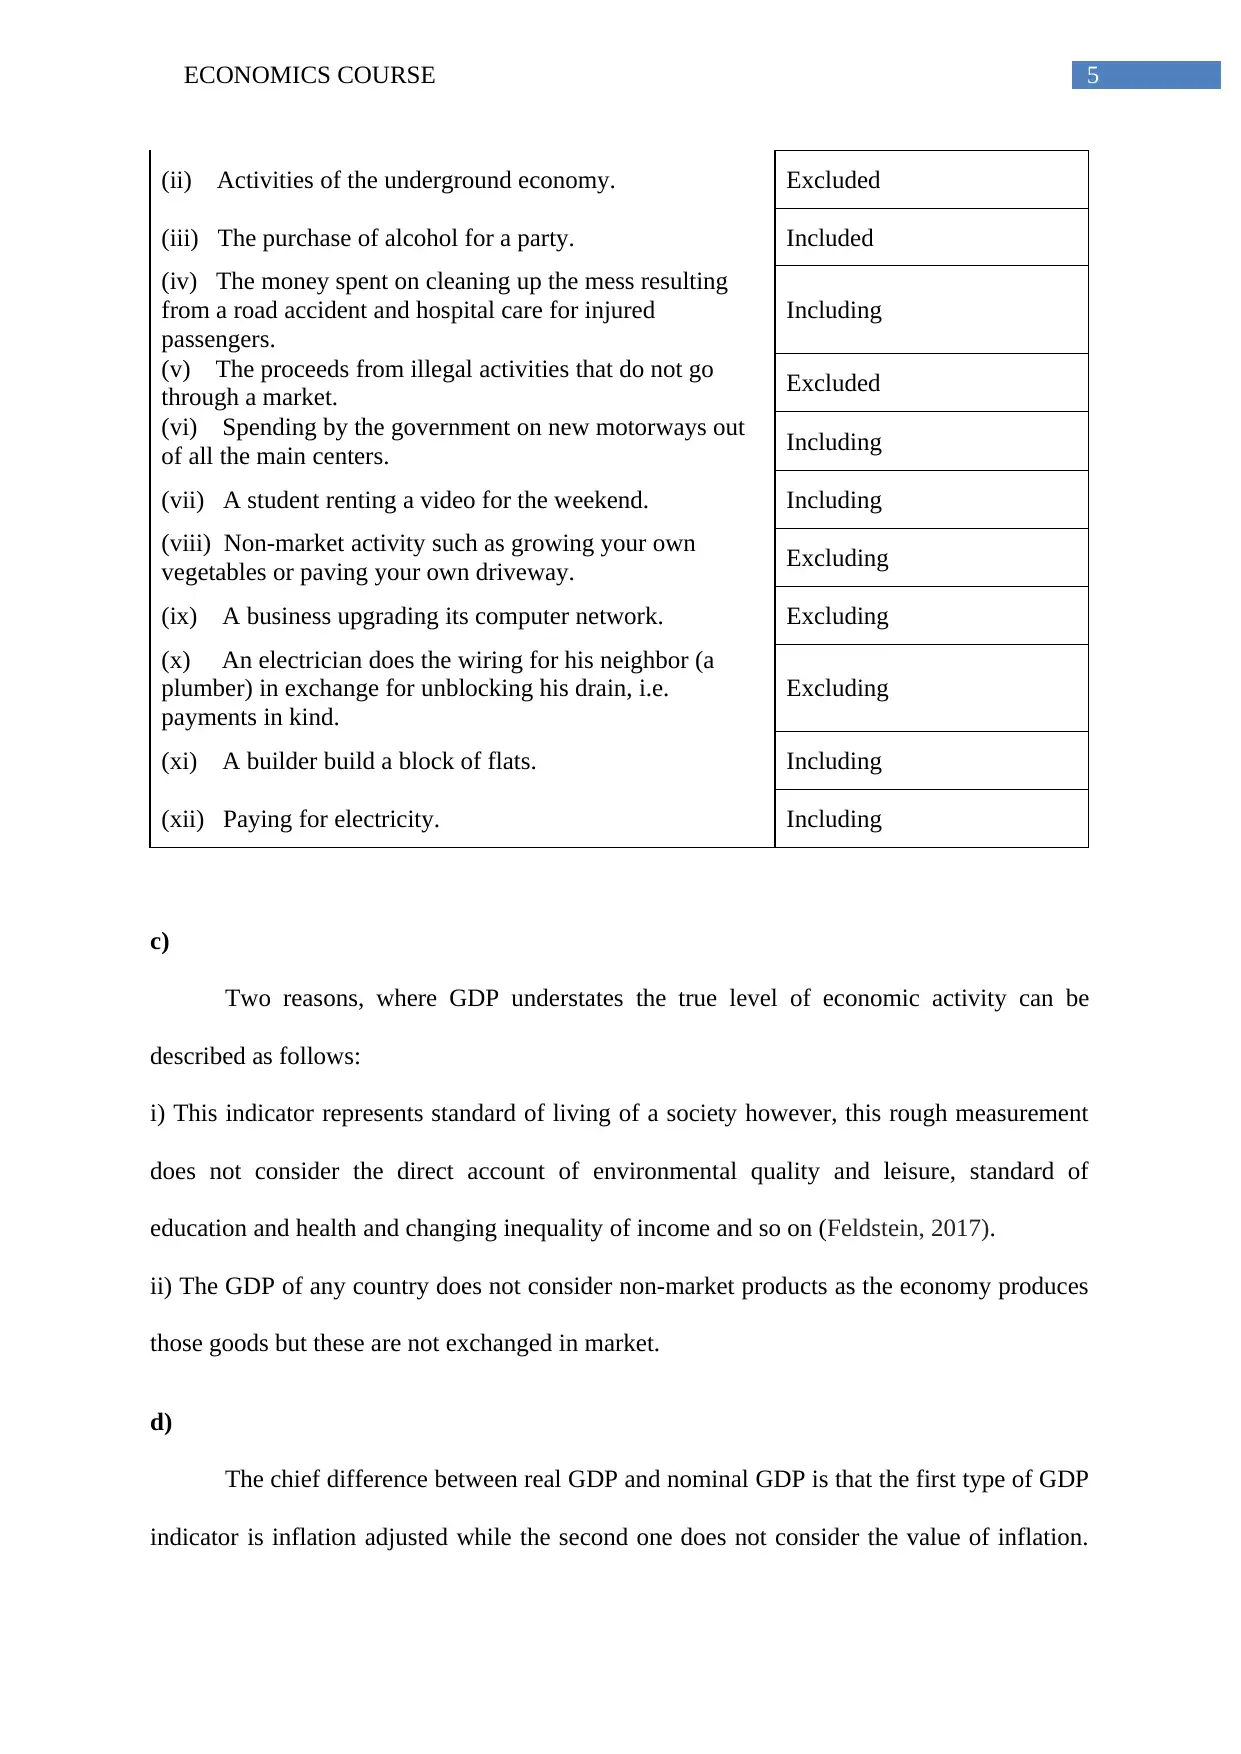
(ii) Activities of the underground economy. Excluded
(iii) The purchase of alcohol for a party. Included
(iv) The money spent on cleaning up the mess resulting
from a road accident and hospital care for injured
passengers.
Including
(v) The proceeds from illegal activities that do not go
through a market. Excluded
(vi) Spending by the government on new motorways out
of all the main centers. Including
(vii) A student renting a video for the weekend. Including
(viii) Non-market activity such as growing your own
vegetables or paving your own driveway. Excluding
(ix) A business upgrading its computer network. Excluding
(x) An electrician does the wiring for his neighbor (a
plumber) in exchange for unblocking his drain, i.e.
payments in kind.
Excluding
(xi) A builder build a block of flats. Including
(xii) Paying for electricity. Including
c)
Two reasons, where GDP understates the true level of economic activity can be
described as follows:
i) This indicator represents standard of living of a society however, this rough measurement
does not consider the direct account of environmental quality and leisure, standard of
education and health and changing inequality of income and so on (Feldstein, 2017).
ii) The GDP of any country does not consider non-market products as the economy produces
those goods but these are not exchanged in market.
d)
The chief difference between real GDP and nominal GDP is that the first type of GDP
indicator is inflation adjusted while the second one does not consider the value of inflation.
⊘ This is a preview!⊘
Do you want full access?
Subscribe today to unlock all pages.
Trusted by 1+ million students worldwide
6ECONOMICS COURSE
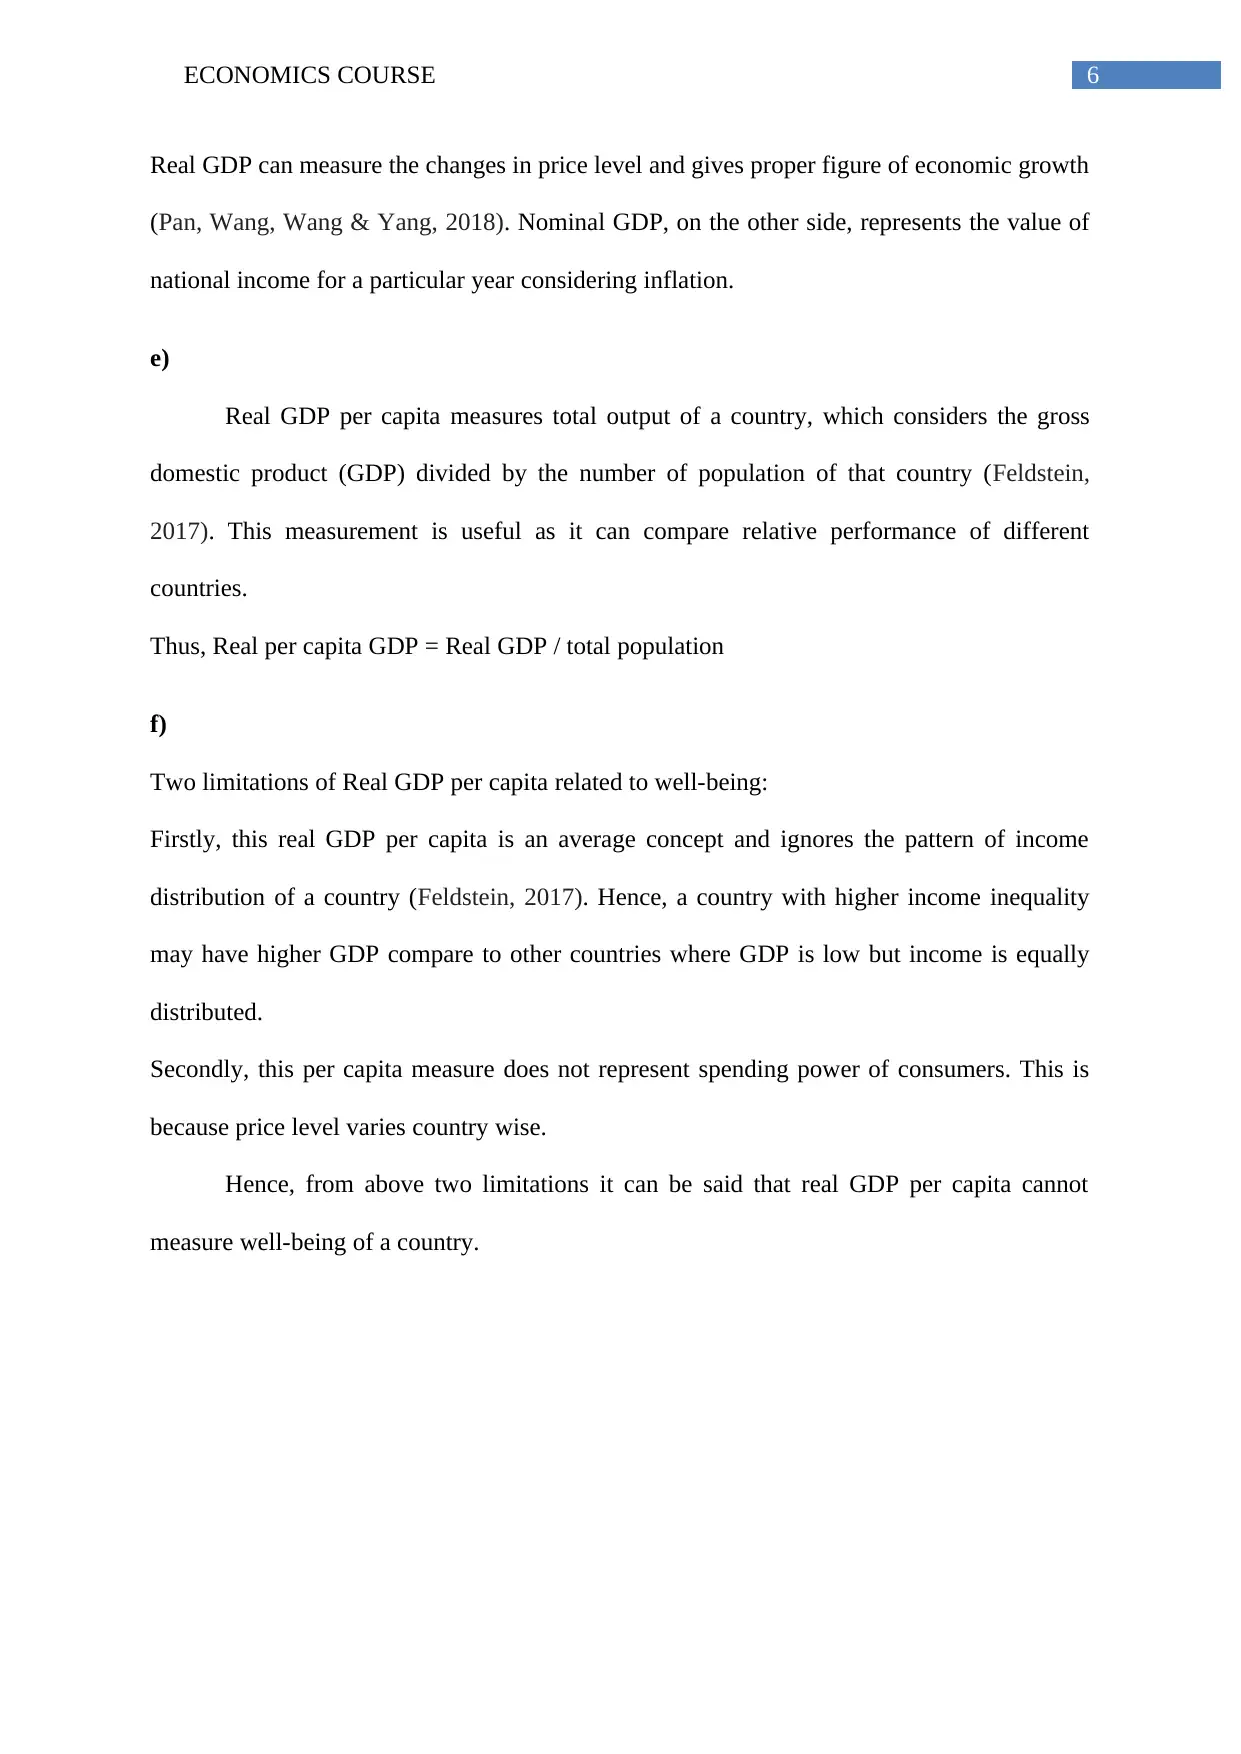
Real GDP can measure the changes in price level and gives proper figure of economic growth
(Pan, Wang, Wang & Yang, 2018). Nominal GDP, on the other side, represents the value of
national income for a particular year considering inflation.
e)
Real GDP per capita measures total output of a country, which considers the gross
domestic product (GDP) divided by the number of population of that country (Feldstein,
2017). This measurement is useful as it can compare relative performance of different
countries.
Thus, Real per capita GDP = Real GDP / total population
f)
Two limitations of Real GDP per capita related to well-being:
Firstly, this real GDP per capita is an average concept and ignores the pattern of income
distribution of a country (Feldstein, 2017). Hence, a country with higher income inequality
may have higher GDP compare to other countries where GDP is low but income is equally
distributed.
Secondly, this per capita measure does not represent spending power of consumers. This is
because price level varies country wise.
Hence, from above two limitations it can be said that real GDP per capita cannot
measure well-being of a country.
Paraphrase This Document
Need a fresh take? Get an instant paraphrase of this document with our AI Paraphraser
7ECONOMICS COURSE
Section B:
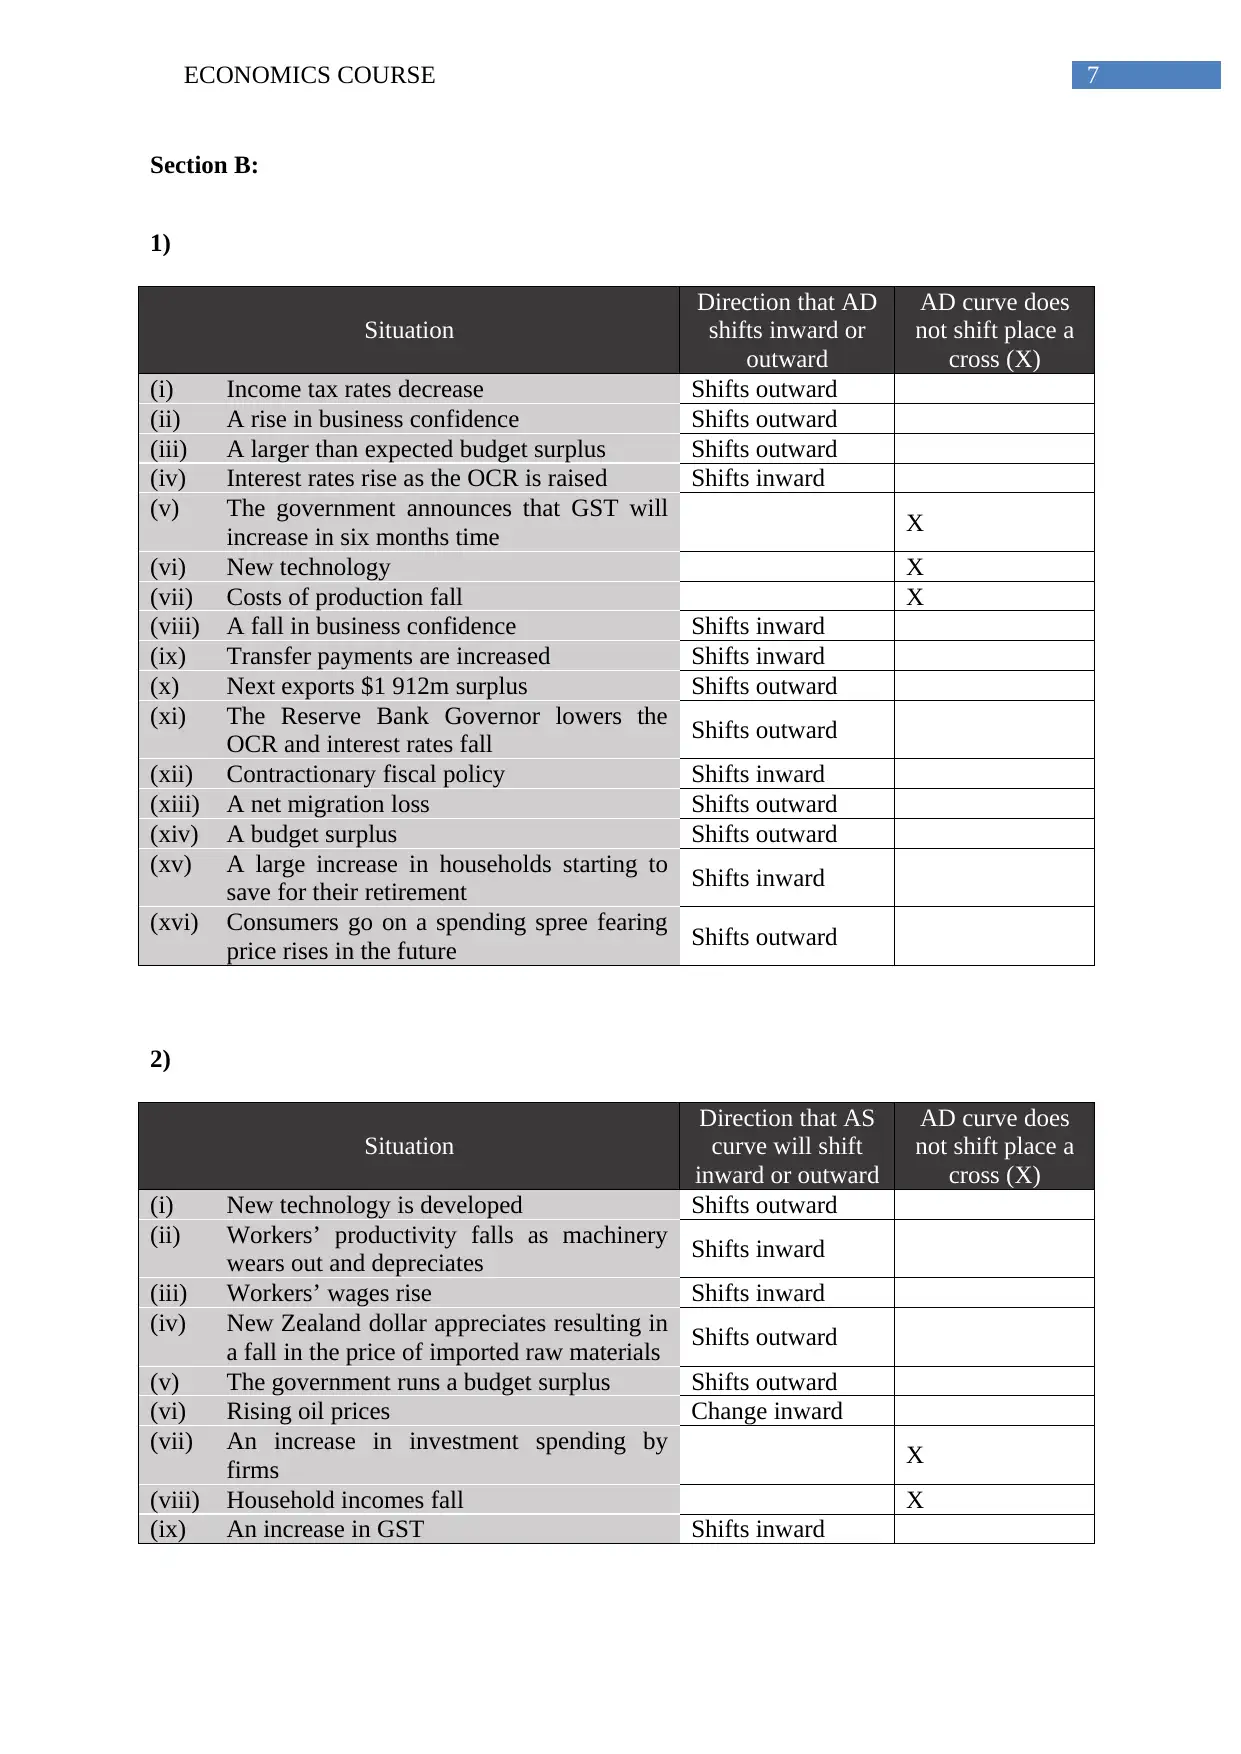
1)
Situation
Direction that AD
shifts inward or
outward
AD curve does
not shift place a
cross (X)
(i) Income tax rates decrease Shifts outward
(ii) A rise in business confidence Shifts outward
(iii) A larger than expected budget surplus Shifts outward
(iv) Interest rates rise as the OCR is raised Shifts inward
(v) The government announces that GST will
increase in six months time X
(vi) New technology X
(vii) Costs of production fall X
(viii) A fall in business confidence Shifts inward
(ix) Transfer payments are increased Shifts inward
(x) Next exports $1 912m surplus Shifts outward
(xi) The Reserve Bank Governor lowers the
OCR and interest rates fall Shifts outward
(xii) Contractionary fiscal policy Shifts inward
(xiii) A net migration loss Shifts outward
(xiv) A budget surplus Shifts outward
(xv) A large increase in households starting to
save for their retirement Shifts inward
(xvi) Consumers go on a spending spree fearing
price rises in the future Shifts outward
2)
Situation
Direction that AS
curve will shift
inward or outward
AD curve does
not shift place a
cross (X)
(i) New technology is developed Shifts outward
(ii) Workers’ productivity falls as machinery
wears out and depreciates Shifts inward
(iii) Workers’ wages rise Shifts inward
(iv) New Zealand dollar appreciates resulting in
a fall in the price of imported raw materials Shifts outward
(v) The government runs a budget surplus Shifts outward
(vi) Rising oil prices Change inward
(vii) An increase in investment spending by
firms X
(viii) Household incomes fall X
(ix) An increase in GST Shifts inward
Section B:
1)
Situation
Direction that AD
shifts inward or
outward
AD curve does
not shift place a
cross (X)
(i) Income tax rates decrease Shifts outward
(ii) A rise in business confidence Shifts outward
(iii) A larger than expected budget surplus Shifts outward
(iv) Interest rates rise as the OCR is raised Shifts inward
(v) The government announces that GST will
increase in six months time X
(vi) New technology X
(vii) Costs of production fall X
(viii) A fall in business confidence Shifts inward
(ix) Transfer payments are increased Shifts inward
(x) Next exports $1 912m surplus Shifts outward
(xi) The Reserve Bank Governor lowers the
OCR and interest rates fall Shifts outward
(xii) Contractionary fiscal policy Shifts inward
(xiii) A net migration loss Shifts outward
(xiv) A budget surplus Shifts outward
(xv) A large increase in households starting to
save for their retirement Shifts inward
(xvi) Consumers go on a spending spree fearing
price rises in the future Shifts outward
2)
Situation
Direction that AS
curve will shift
inward or outward
AD curve does
not shift place a
cross (X)
(i) New technology is developed Shifts outward
(ii) Workers’ productivity falls as machinery
wears out and depreciates Shifts inward
(iii) Workers’ wages rise Shifts inward
(iv) New Zealand dollar appreciates resulting in
a fall in the price of imported raw materials Shifts outward
(v) The government runs a budget surplus Shifts outward
(vi) Rising oil prices Change inward
(vii) An increase in investment spending by
firms X
(viii) Household incomes fall X
(ix) An increase in GST Shifts inward
8ECONOMICS COURSE
AD0
AD1
AS0
Price level
O Real GDP
AS1
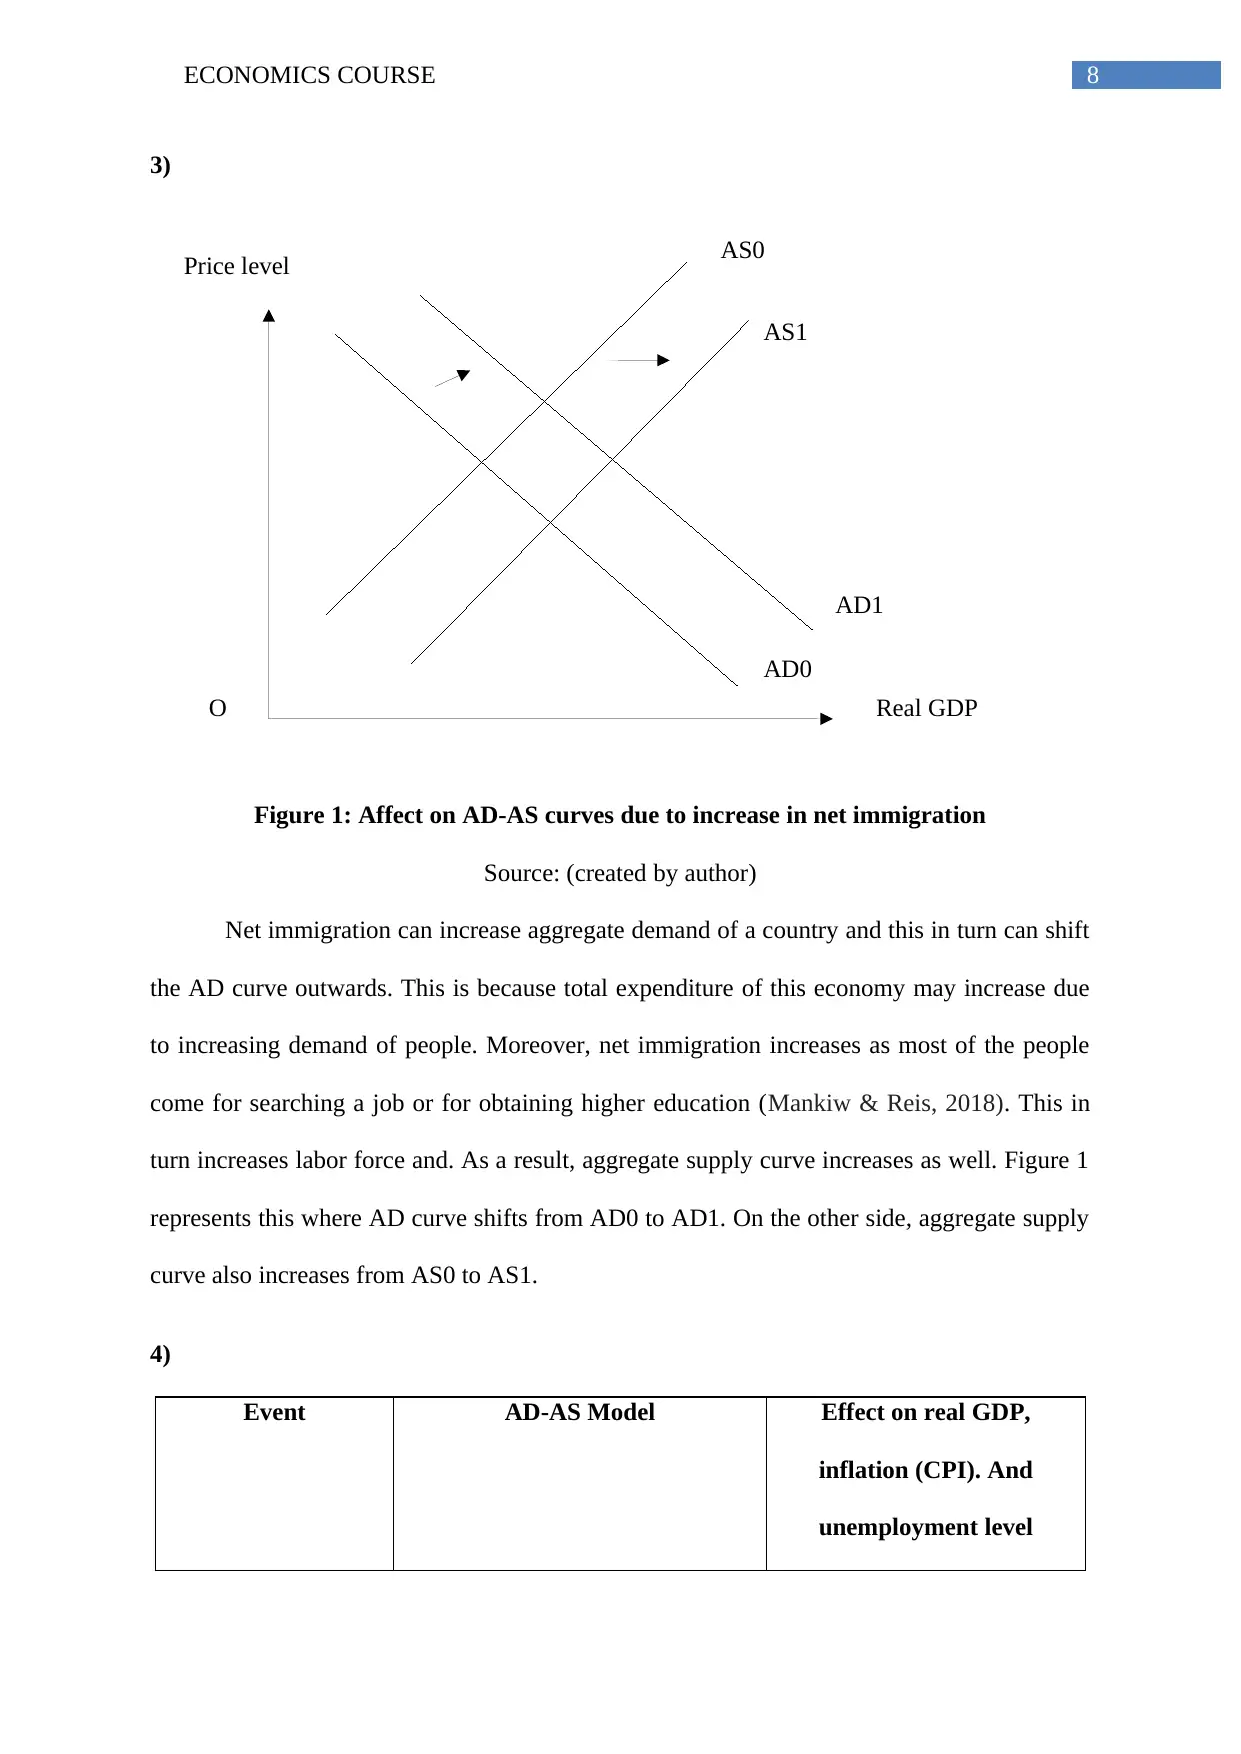
3)
Figure 1: Affect on AD-AS curves due to increase in net immigration
Source: (created by author)
Net immigration can increase aggregate demand of a country and this in turn can shift
the AD curve outwards. This is because total expenditure of this economy may increase due
to increasing demand of people. Moreover, net immigration increases as most of the people
come for searching a job or for obtaining higher education (Mankiw & Reis, 2018). This in
turn increases labor force and. As a result, aggregate supply curve increases as well. Figure 1
represents this where AD curve shifts from AD0 to AD1. On the other side, aggregate supply
curve also increases from AS0 to AS1.
4)
Event AD-AS Model Effect on real GDP,
inflation (CPI). And
unemployment level
AD0
AD1
AS0
Price level
O Real GDP
AS1
3)
Figure 1: Affect on AD-AS curves due to increase in net immigration
Source: (created by author)
Net immigration can increase aggregate demand of a country and this in turn can shift
the AD curve outwards. This is because total expenditure of this economy may increase due
to increasing demand of people. Moreover, net immigration increases as most of the people
come for searching a job or for obtaining higher education (Mankiw & Reis, 2018). This in
turn increases labor force and. As a result, aggregate supply curve increases as well. Figure 1
represents this where AD curve shifts from AD0 to AD1. On the other side, aggregate supply
curve also increases from AS0 to AS1.
4)
Event AD-AS Model Effect on real GDP,
inflation (CPI). And
unemployment level
⊘ This is a preview!⊘
Do you want full access?
Subscribe today to unlock all pages.
Trusted by 1+ million students worldwide
9ECONOMICS COURSE
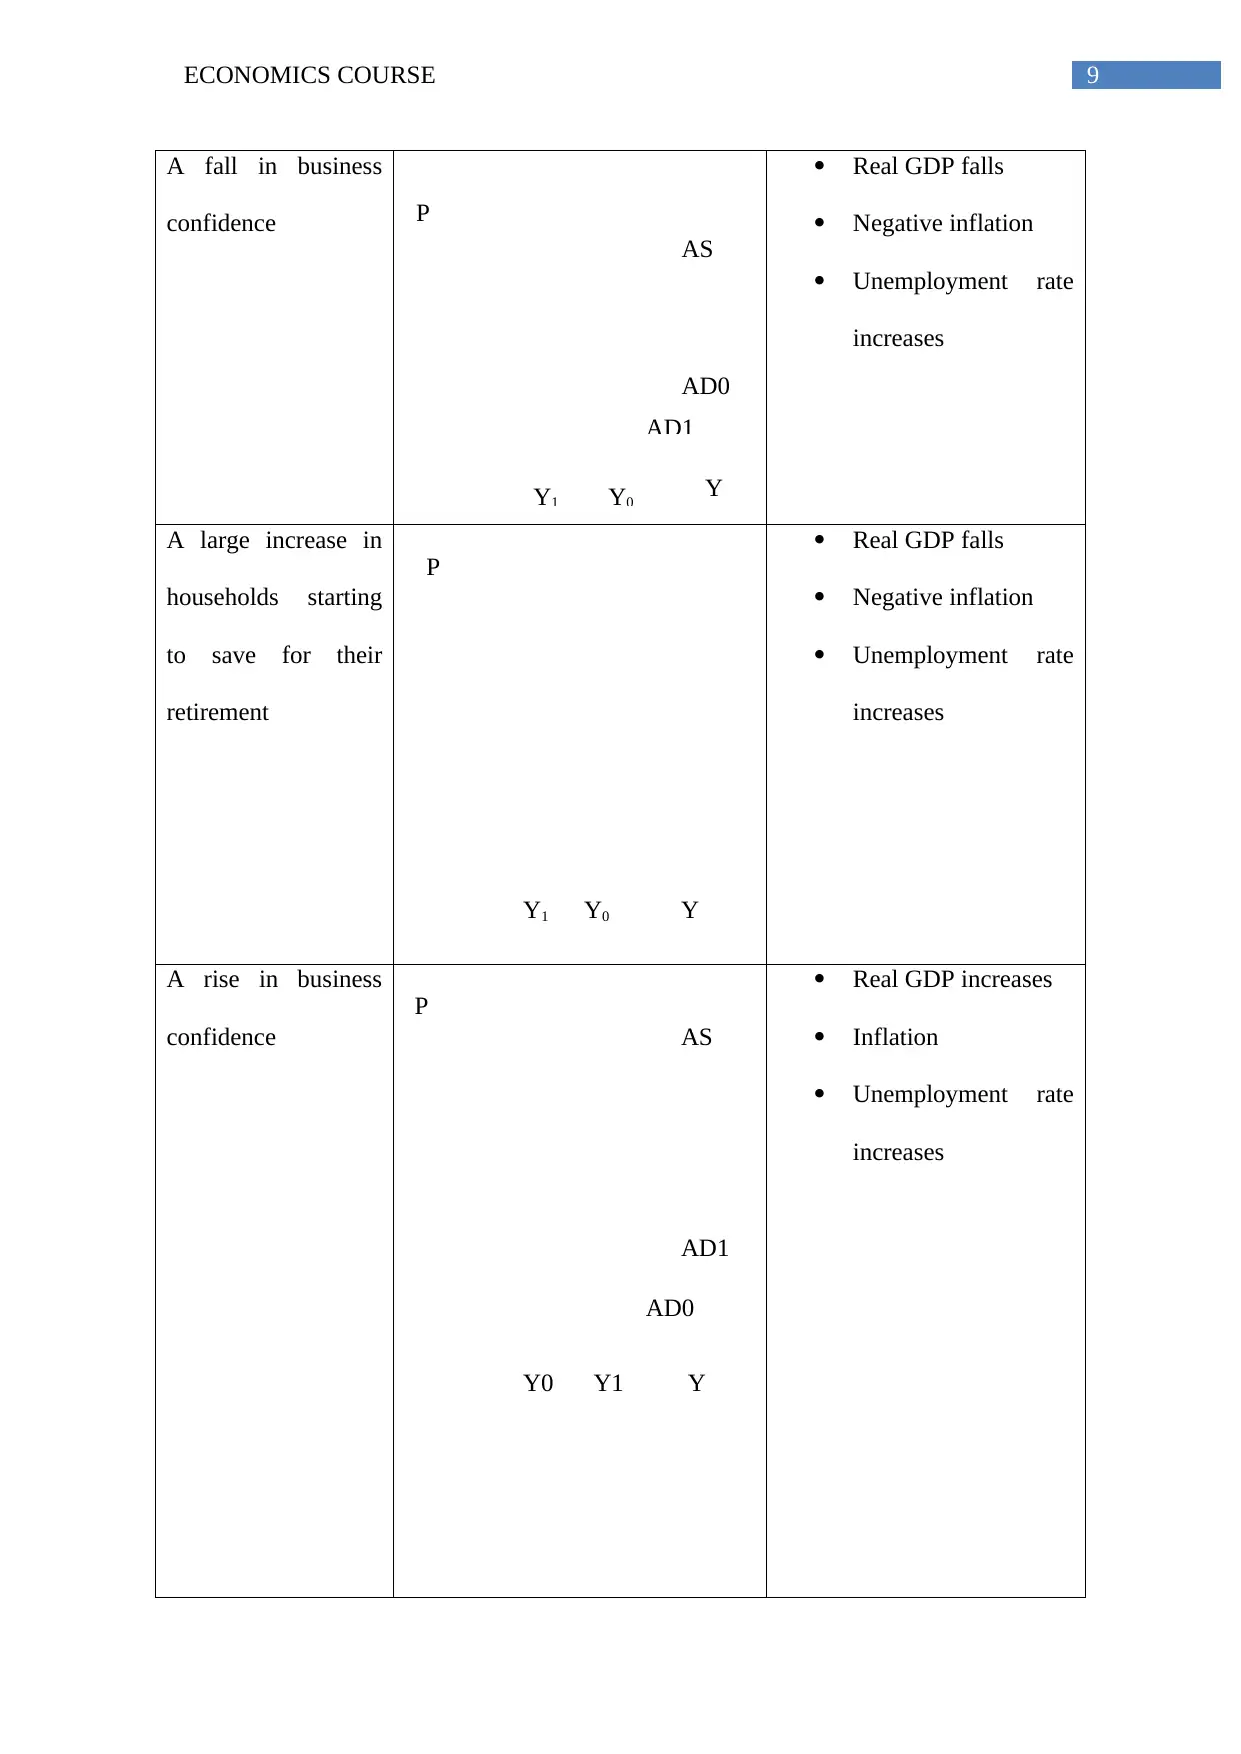
A fall in business
confidence
Real GDP falls
Negative inflation
Unemployment rate
increases
A large increase in
households starting
to save for their
retirement
Real GDP falls
Negative inflation
Unemployment rate
increases
A rise in business
confidence
Real GDP increases
Inflation
Unemployment rate
increases
P
AS
AD1
AD0
YY0Y1
P
YY0Y1
P
Y
AS
AD0
AD1
Y1Y0
Paraphrase This Document
Need a fresh take? Get an instant paraphrase of this document with our AI Paraphraser
10ECONOMICS COURSE
AD1
SAS
Real GDP
Price level LAS
AD2
Y1 Yf
Inflationary gap
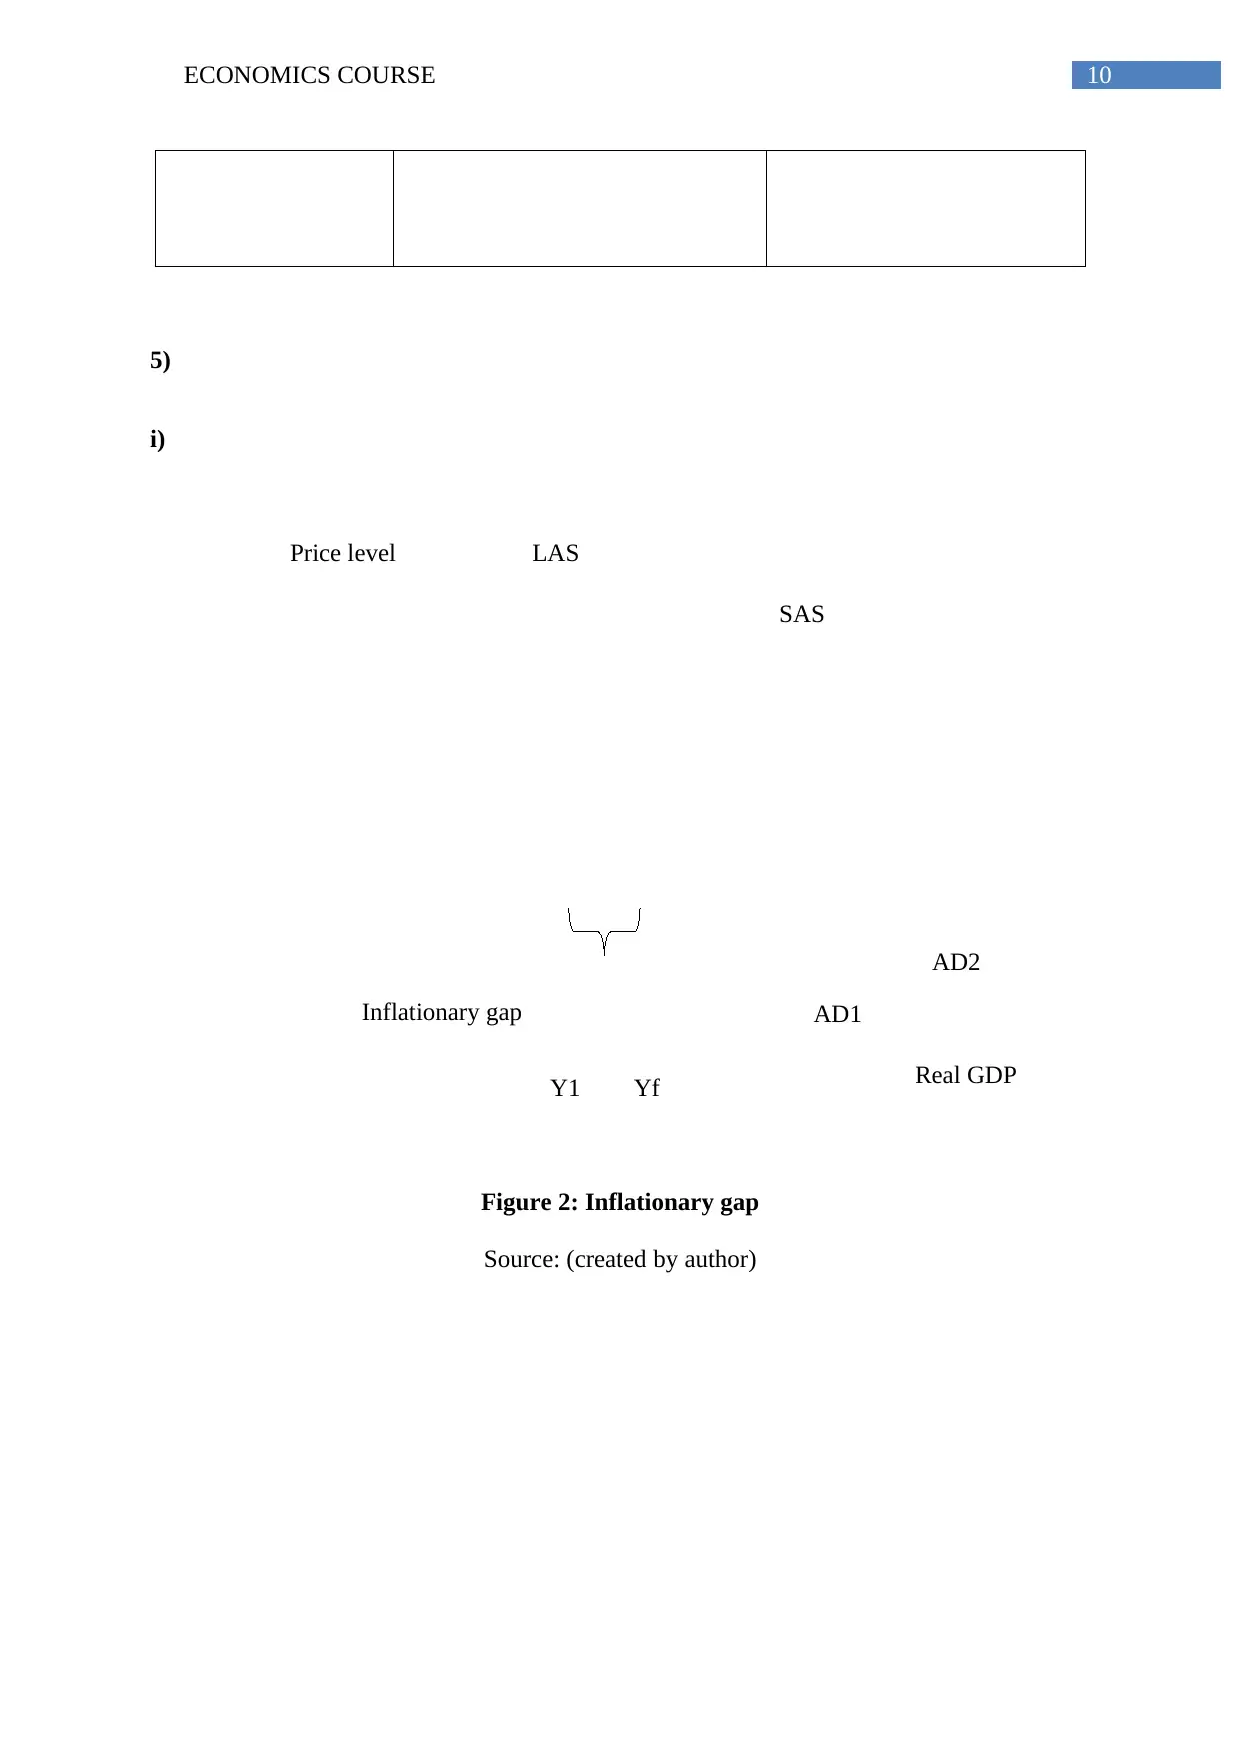
5)
i)
Figure 2: Inflationary gap
Source: (created by author)
AD1
SAS
Real GDP
Price level LAS
AD2
Y1 Yf
Inflationary gap
5)
i)
Figure 2: Inflationary gap
Source: (created by author)
11ECONOMICS COURSE
AS
AD1
AD0
Price level
Real GDP
Y1Y0
P1
P2
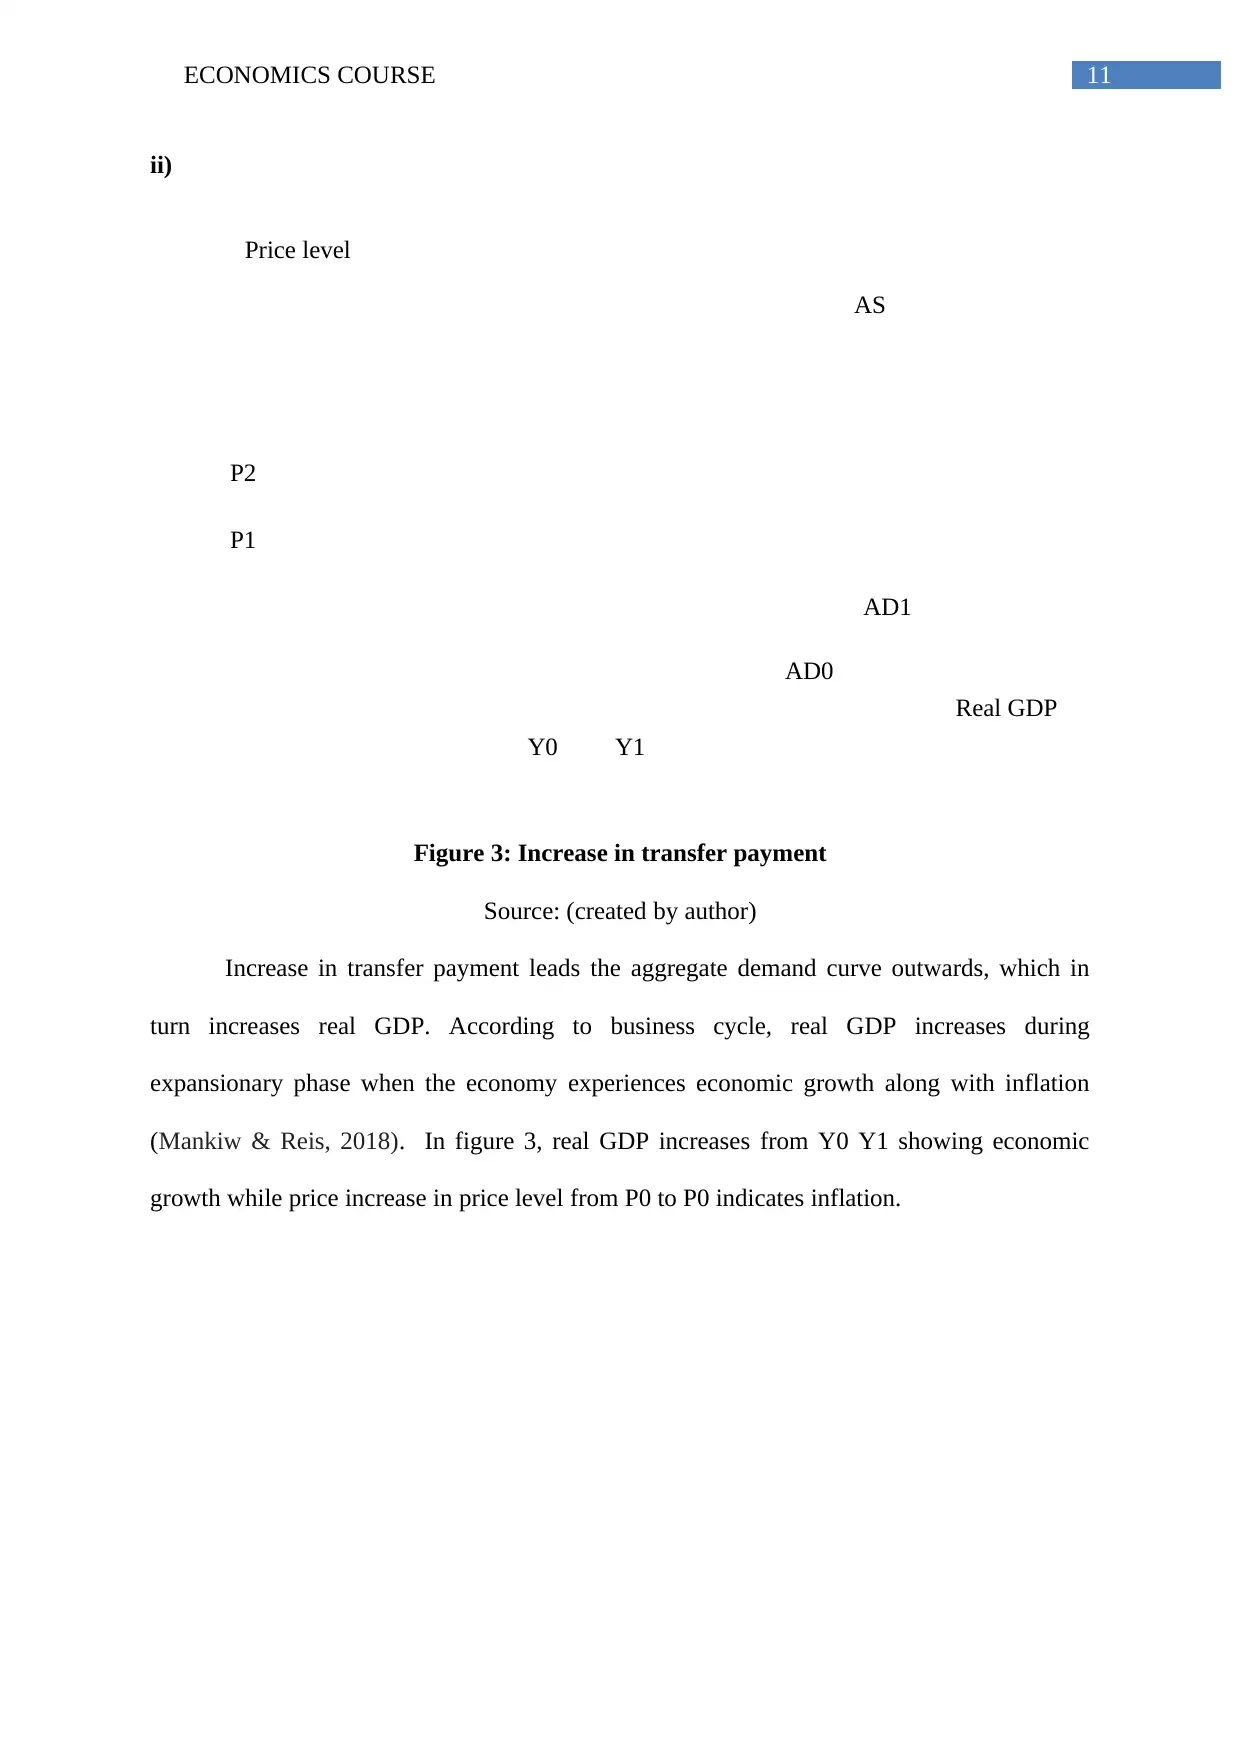
ii)
Figure 3: Increase in transfer payment
Source: (created by author)
Increase in transfer payment leads the aggregate demand curve outwards, which in
turn increases real GDP. According to business cycle, real GDP increases during
expansionary phase when the economy experiences economic growth along with inflation
(Mankiw & Reis, 2018). In figure 3, real GDP increases from Y0 Y1 showing economic
growth while price increase in price level from P0 to P0 indicates inflation.
AS
AD1
AD0
Price level
Real GDP
Y1Y0
P1
P2
ii)
Figure 3: Increase in transfer payment
Source: (created by author)
Increase in transfer payment leads the aggregate demand curve outwards, which in
turn increases real GDP. According to business cycle, real GDP increases during
expansionary phase when the economy experiences economic growth along with inflation
(Mankiw & Reis, 2018). In figure 3, real GDP increases from Y0 Y1 showing economic
growth while price increase in price level from P0 to P0 indicates inflation.
⊘ This is a preview!⊘
Do you want full access?
Subscribe today to unlock all pages.
Trusted by 1+ million students worldwide
1 out of 23
Related Documents


Your All-in-One AI-Powered Toolkit for Academic Success.
+13062052269
info@desklib.com
Available 24*7 on WhatsApp / Email
![[object Object]](/_next/static/media/star-bottom.7253800d.svg)
Unlock your academic potential
Copyright © 2020–2026 A2Z Services. All Rights Reserved. Developed and managed by ZUCOL.