Economics Assignment: Australian GDP, Wage Growth, and Policy Response

Verified

Added on  2023/01/17

|10
|1749
|43
Homework Assignment
AI Summary
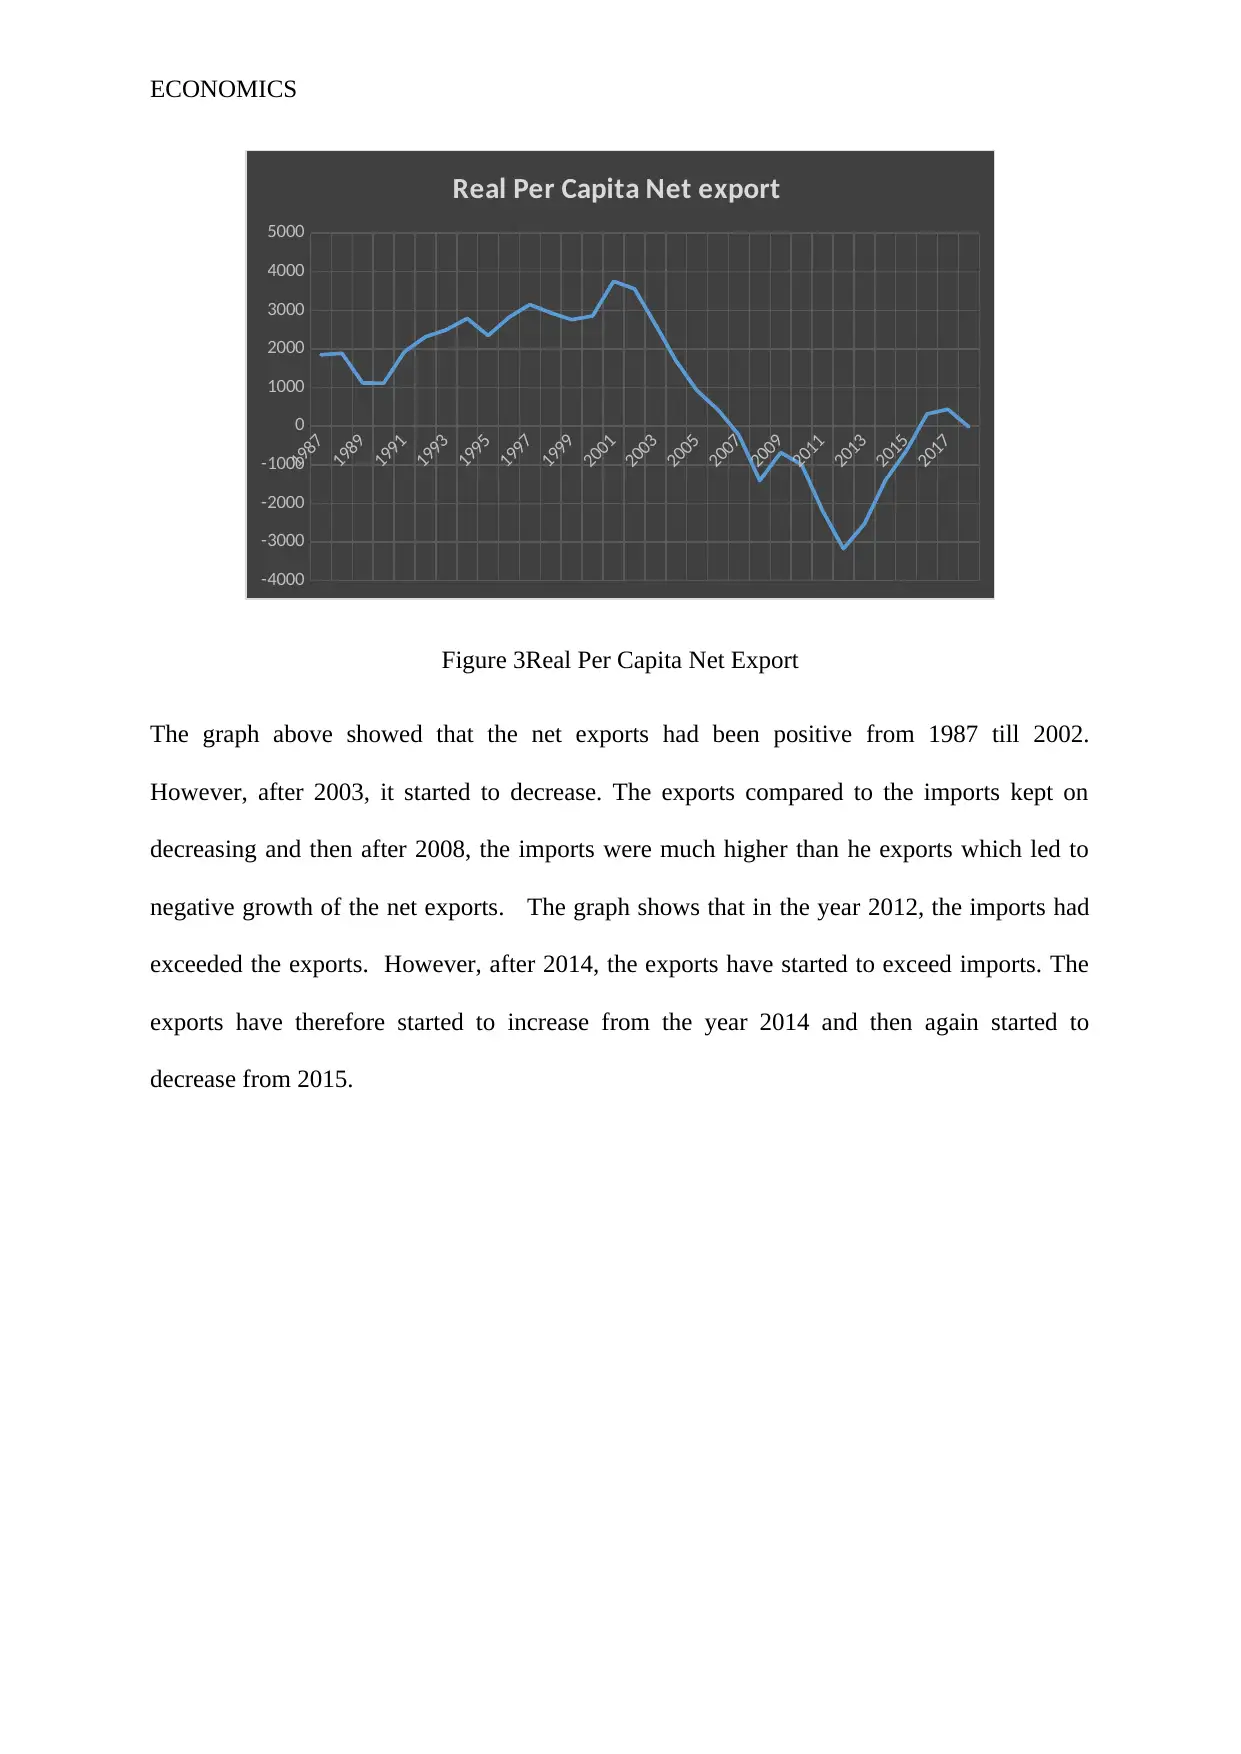
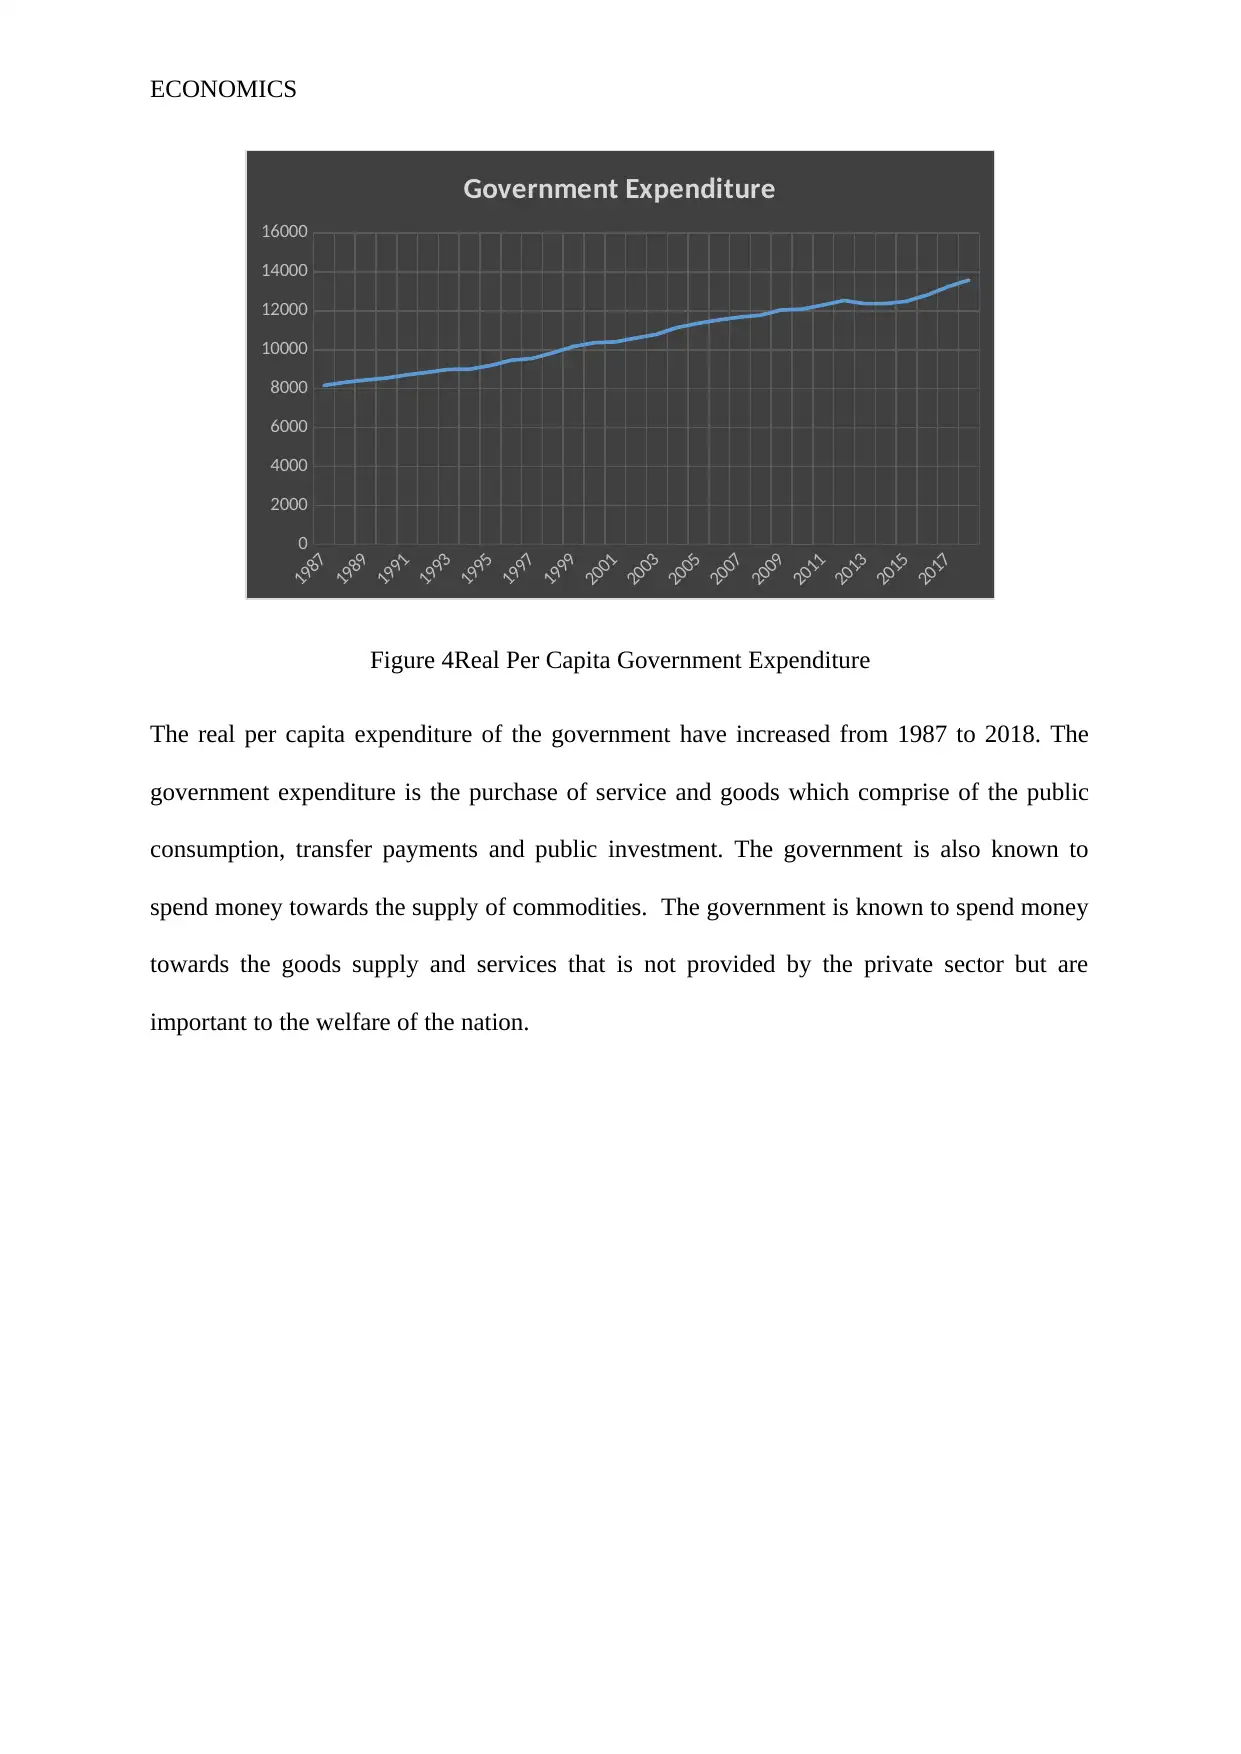
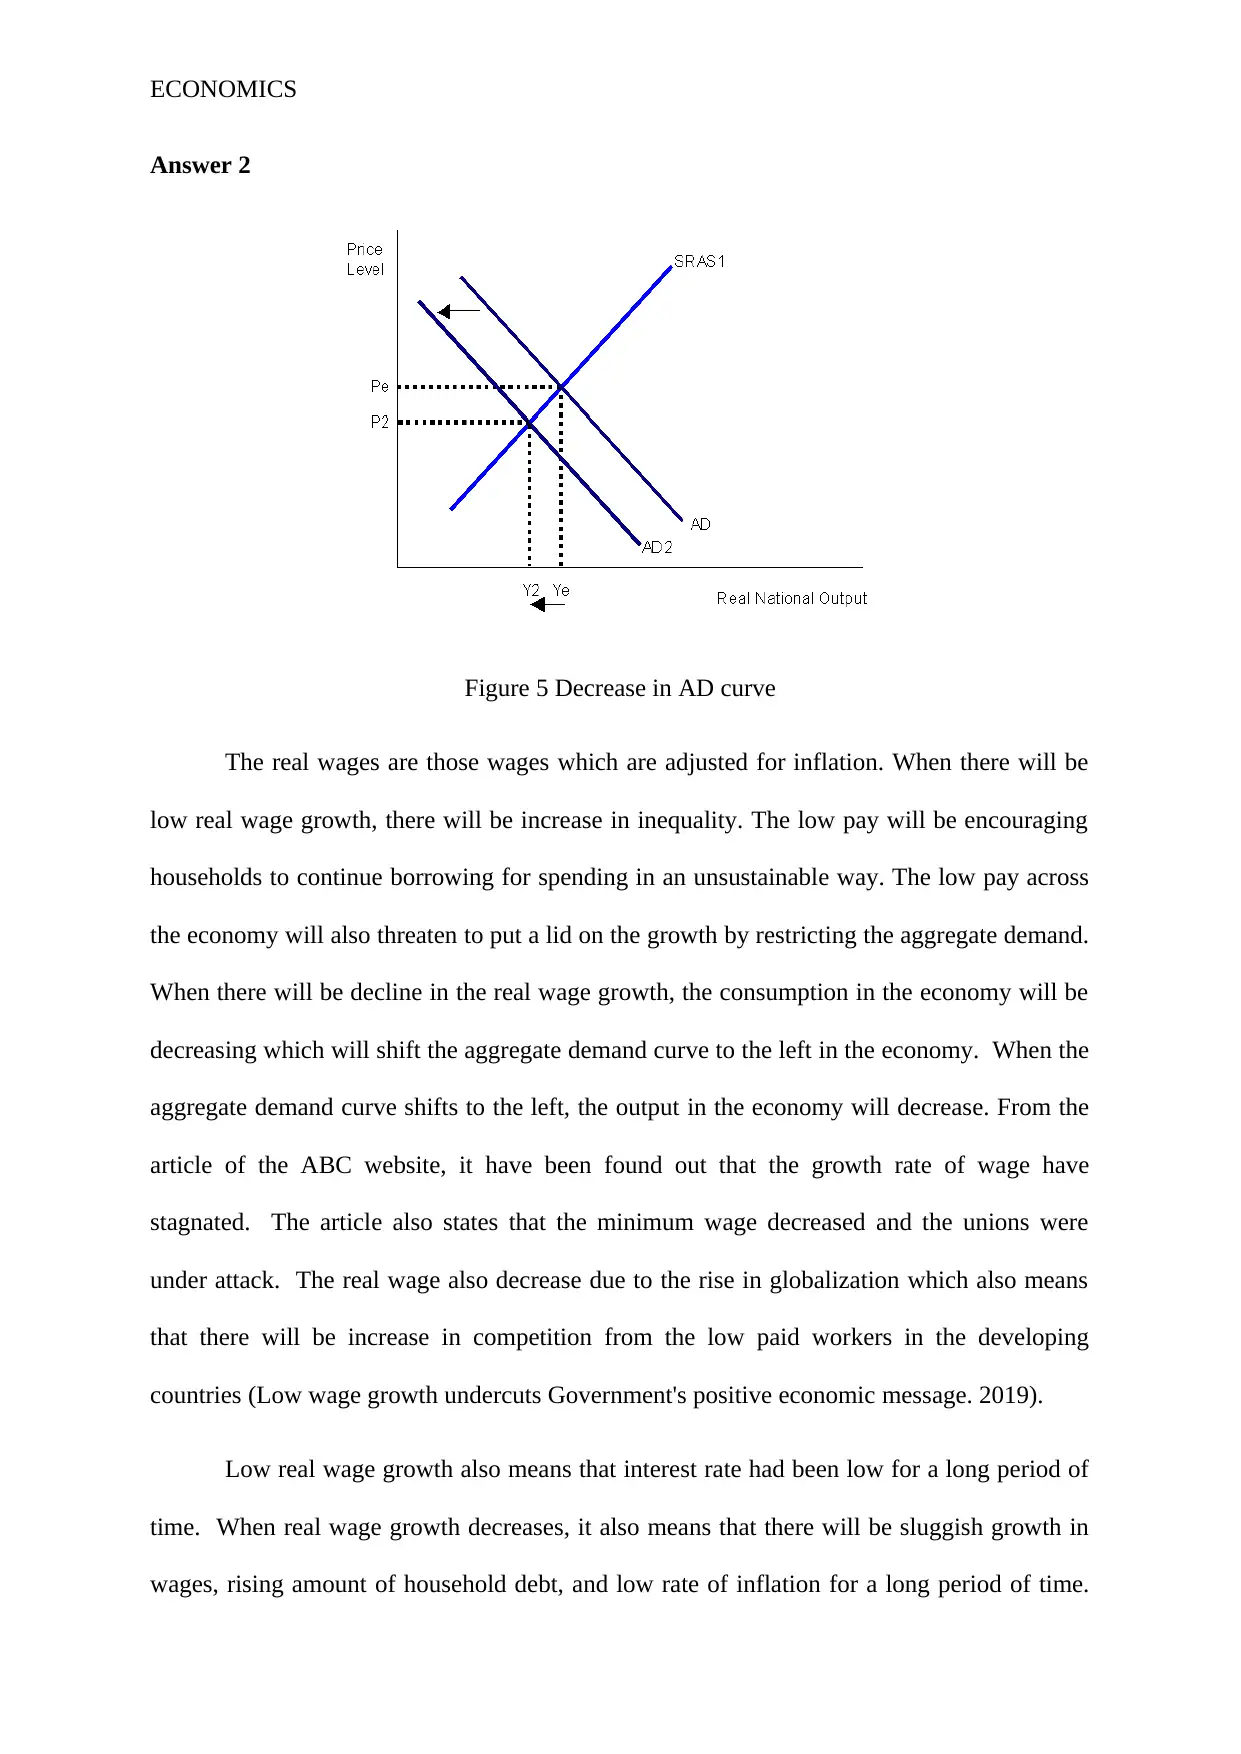
This economics assignment analyzes the Australian economy using data from the Australian Bureau of Statistics (ABS). Question 1 involves calculating and plotting real per capita values for consumption, investment, government expenditure, and net exports from 1987/8 to 2017/18, providing economic explanations for observed trends. Question 2 explores the impact of low real wage growth on macroeconomic equilibrium, using diagrams and media reports to illustrate the effects. It also examines potential government policy responses to mitigate the negative consequences of prolonged low wage growth, such as boosting labor productivity and initiating employment programs. The analysis incorporates relevant economic theories and principles to support the findings and recommendations.
tabler-icon-diamond-filled.svg

Contribute Materials

Your contribution can guide someone’s learning journey. Share your documents today.
Document Page
Running head: ECONOMICS
Economics
Name of the student
Name of the university
Author note
tabler-icon-diamond-filled.svg

Secure Best Marks with AI Grader

Need help grading? Try our AI Grader for instant feedback on your assignments.
Document Page
ECONOMICS
Answer 1
Table 1
Year Consumption Investment
Government
Expenditure Net export
1987 30806.83 8026.464 8166.571 1848.043
1988 31275.45 8476.437 8325.362 1888.047
1989 32103.61 9246.948 8444.018 1115.092
1990 32893.98 9204.085 8550.086 1113.993
1991 33000.96 8231.265 8717.542 1923.703
1992 33447.09 7822.063 8849.053 2313.305
1993 33819.8 8264.815 8991.15 2494.203
1994 34115.37 8658.428 9000.341 2786.944
1995 35086.56 9493.027 9187.612 2346.463
1996 35935.85 9640.875 9462.752 2818.537
1997 26994.86 10180.87 9557.642 3147.109
1998 28034.62 11055.39 9841.16 2932.06
1999 29306.77 11415.86 10170.77 2754.819
2000 30200.51 12196.83 10362.4 2852.353
2001 30766.47 11085.88 10404.12 3749.885
2002 31365.27 11962.29 10604.4 3554.319
2003 32264.89 13315.07 10796.05 2637.544
2004 33520.75 14320.16 11151.05 1679.487
2005 34586.1 14994.28 11361.86 916.2278
2006 35161.86 15986.15 11538.16 423.7053
2007 36389.68 16399.74 11681.75 -234.058
2008 37361.71 17455.04 11777.63 -1410.81
2009 36904.55 17404.99 12050.06 -682.578
2010 37577.86 17464.14 12089.27 -998.445
2011 38468.63 17811.85 12306.48 -2185.04
2012 38911.2 19515.07 12530.13 -3174.06
2013 38971.14 19782.23 12367.32 -2531.79
2014 39343.02 19152.23 12375.63 -1410.22
2015 39688.33 18280.12 12494.11 -644.164
2016 40103.59 17358.65 12811.11 313.8212
2017 40410.66 17050.19 13242.56 437.9719
2018 41025.39 17564 13581.79 -22.6278
(Source: Australian Bureau of Statistics, Australian Government. 2019).
Document Page
ECONOMICS
1987
1989
1991
1993
1995
1997
1999
2001
2003
2005
2007
2009
2011
2013
2015
2017
0
5000
10000
15000
20000
25000
Real per Capita Investment
Figure 1 Real Per Capita investment
The investment in Australia have been quite strong, it kept on rising since 2005.
However, in the present situation there is a biggest fall in the last five years in the mining
investment I the share of gross domestic product. The non mining business investment have
also decreased from 12 to 9 percent of gross domestic product. The economy of Australia is
presently growing very slowly. At the time of recession, the Australian banks have not
invested much in the toxic assets. High investment in Australia have helped in building up
the capital stock per member since 2005 .By the year 2009, the mining business investment
have decreased by a quarter. The Australian economy have further decreased in the fourth
quarter which have taken place due to contraction of the fixed investments and the foreign
sales.
Document Page
ECONOMICS
0
5000
10000
15000
20000
25000
30000
35000
40000
45000
Real per capita Consumption
Figure 2 Real Per Capita Consumption
The above graph shows that the per capita consumption have kept on increasing from
1987 to the present year. The expenditure of the household final consumption is the net
expenditure of services and goods. The Australian economy is largely a mixed market
economy where the gross domestic product presently is around A$1.69 trillion which is
mainly dominated by the service sector. Australian gross domestic product increased by more
than 2 percent in 2008 compared to the previous year. The expenditure of the household final
consumption is the net expenditure of services and goods (Hartigan & Morley, 2018). This is
the reason behind the peak in 2008, shown in the graph. Consumer spending is the amount
which he household buy to fulfil the needs. The private consumption comprises of both goods
and services. However, the growth have further shrinked in the fourth quarter on shrinking
private investment and falling exports. The consumer spending in Australia have increased to
261905 AUD Million in the year 2018. The expenditure of the household final consumption
is the net expenditure of services and goods.
tabler-icon-diamond-filled.svg

Secure Best Marks with AI Grader

Need help grading? Try our AI Grader for instant feedback on your assignments.
Document Page
ECONOMICS
1987
1989
1991
1993
1995
1997
1999
2001
2003
2005
2007
2009
2011
2013
2015
2017
-4000
-3000
-2000
-1000
0
1000
2000
3000
4000
5000
Real Per Capita Net export
Figure 3Real Per Capita Net Export
The graph above showed that the net exports had been positive from 1987 till 2002.
However, after 2003, it started to decrease. The exports compared to the imports kept on
decreasing and then after 2008, the imports were much higher than he exports which led to
negative growth of the net exports. The graph shows that in the year 2012, the imports had
exceeded the exports. However, after 2014, the exports have started to exceed imports. The
exports have therefore started to increase from the year 2014 and then again started to
decrease from 2015.
Document Page
ECONOMICS
1987
1989
1991
1993
1995
1997
1999
2001
2003
2005
2007
2009
2011
2013
2015
2017
0
2000
4000
6000
8000
10000
12000
14000
16000
Government Expenditure
Figure 4Real Per Capita Government Expenditure
The real per capita expenditure of the government have increased from 1987 to 2018. The
government expenditure is the purchase of service and goods which comprise of the public
consumption, transfer payments and public investment. The government is also known to
spend money towards the supply of commodities. The government is known to spend money
towards the goods supply and services that is not provided by the private sector but are
important to the welfare of the nation.
Document Page
ECONOMICS
Answer 2
Figure 5 Decrease in AD curve
The real wages are those wages which are adjusted for inflation. When there will be
low real wage growth, there will be increase in inequality. The low pay will be encouraging
households to continue borrowing for spending in an unsustainable way. The low pay across
the economy will also threaten to put a lid on the growth by restricting the aggregate demand.
When there will be decline in the real wage growth, the consumption in the economy will be
decreasing which will shift the aggregate demand curve to the left in the economy. When the
aggregate demand curve shifts to the left, the output in the economy will decrease. From the
article of the ABC website, it have been found out that the growth rate of wage have
stagnated. The article also states that the minimum wage decreased and the unions were
under attack. The real wage also decrease due to the rise in globalization which also means
that there will be increase in competition from the low paid workers in the developing
countries (Low wage growth undercuts Government's positive economic message. 2019).
Low real wage growth also means that interest rate had been low for a long period of
time. When real wage growth decreases, it also means that there will be sluggish growth in
wages, rising amount of household debt, and low rate of inflation for a long period of time.
tabler-icon-diamond-filled.svg

Paraphrase This Document

Need a fresh take? Get an instant paraphrase of this document with our AI Paraphraser
Document Page
ECONOMICS
When there will be decline in the real wage growth, the consumption in the economy will be
decreasing which will shift the aggregate demand curve to the left in the economy. When the
aggregate demand curve shifts to the left, the output in the economy will decrease. Australian
wage is also known to be hugely affected by the poor corporate performance(Jacobs., &
Rush, 2015). The low real wage growth also took place due to the commodity price boom and
due to the global financial crisis.
Government response
The government should be boosting the labour productivity of growth. The wage
growth can take place through monetary policy which also helps in attaining the full
employment in the economy. The government should initiate in creating large number of jobs
and try to attain full employment in the economy (Stanford, 2017).. It is also advisable to the
government to increase the public spending for initiating large number of employment
programs. Therefore, for increasing thee real wage growth rate, the government should be
working towards creating large number of jobs.
Document Page
ECONOMICS
Reference list
Allen, Darcy. "The sharing economy." Institute of Public Affairs Review: A Quarterly Review
of Politics and Public Affairs, The 67, no. 3 (2015): 24.
Australian Bureau of Statistics, Australian Government. (2019). Retrieved from
https://www.abs.gov.au/
Bishop, J., & Cassidy, N. (2017). Insights into low wage growth in Australia. RBA Bulletin,
March, 13-20.
Dixon, J. M., & Nassios, J. (2016). Modelling the impacts of a cut to company tax in
Australia. Centre for Policy Studies, Victoria University.
Doherty, E., Jackman, B., & Perry, E. (2018). Money in the Australian Economy| Bulletin–
September Quarter 2018. Bulletin, (September).
Hartigan, L., & Morley, J. (2018). A Factor Model Analysis of the Effects of Inflation
Targeting on the Australian Economy. Central Bank Frameworks: Evolution or
Revolution?, 127.
Jacobs, D., & Rush, A. (2015). Why is wage growth so low?. RBA Bulletin, June, 9-18.
Low wage growth undercuts Government's positive economic message. (2019). Retrieved
from https://www.abc.net.au/news/2018-02-02/low-wage-growth-undercuts-
governments-message/9391778
Manalo, J., Perera, D., & Rees, D. M. (2015). Exchange rate movements and the Australian
economy. Economic Modelling, 47, 53-62.
Rees, D. M., Smith, P., & Hall, J. (2016). A Multi‐sector Model of the Australian Economy.
Economic Record, 92(298), 374-408.
Document Page
ECONOMICS
Schroeder, S. (2018). Just how fragile is the Australian economy?. Australian Options, (87),
18.
Stanford, J. (2017). Briefing Note: Labour Share of Australian GDP Hits All-Time Record
Low. The Australia Institute: Centre for Future Work, 13.
chevron_up_icon
1 out of 10
circle_padding
hide_on_mobile
zoom_out_icon
logo.png

Your All-in-One AI-Powered Toolkit for Academic Success.

Available 24*7 on WhatsApp / Email

[object Object]