Regional Macroeconomic Analysis: Arizona's Unemployment Challenges

Verified

Added on  2022/10/19

|14
|1788
|216
Case Study
AI Summary
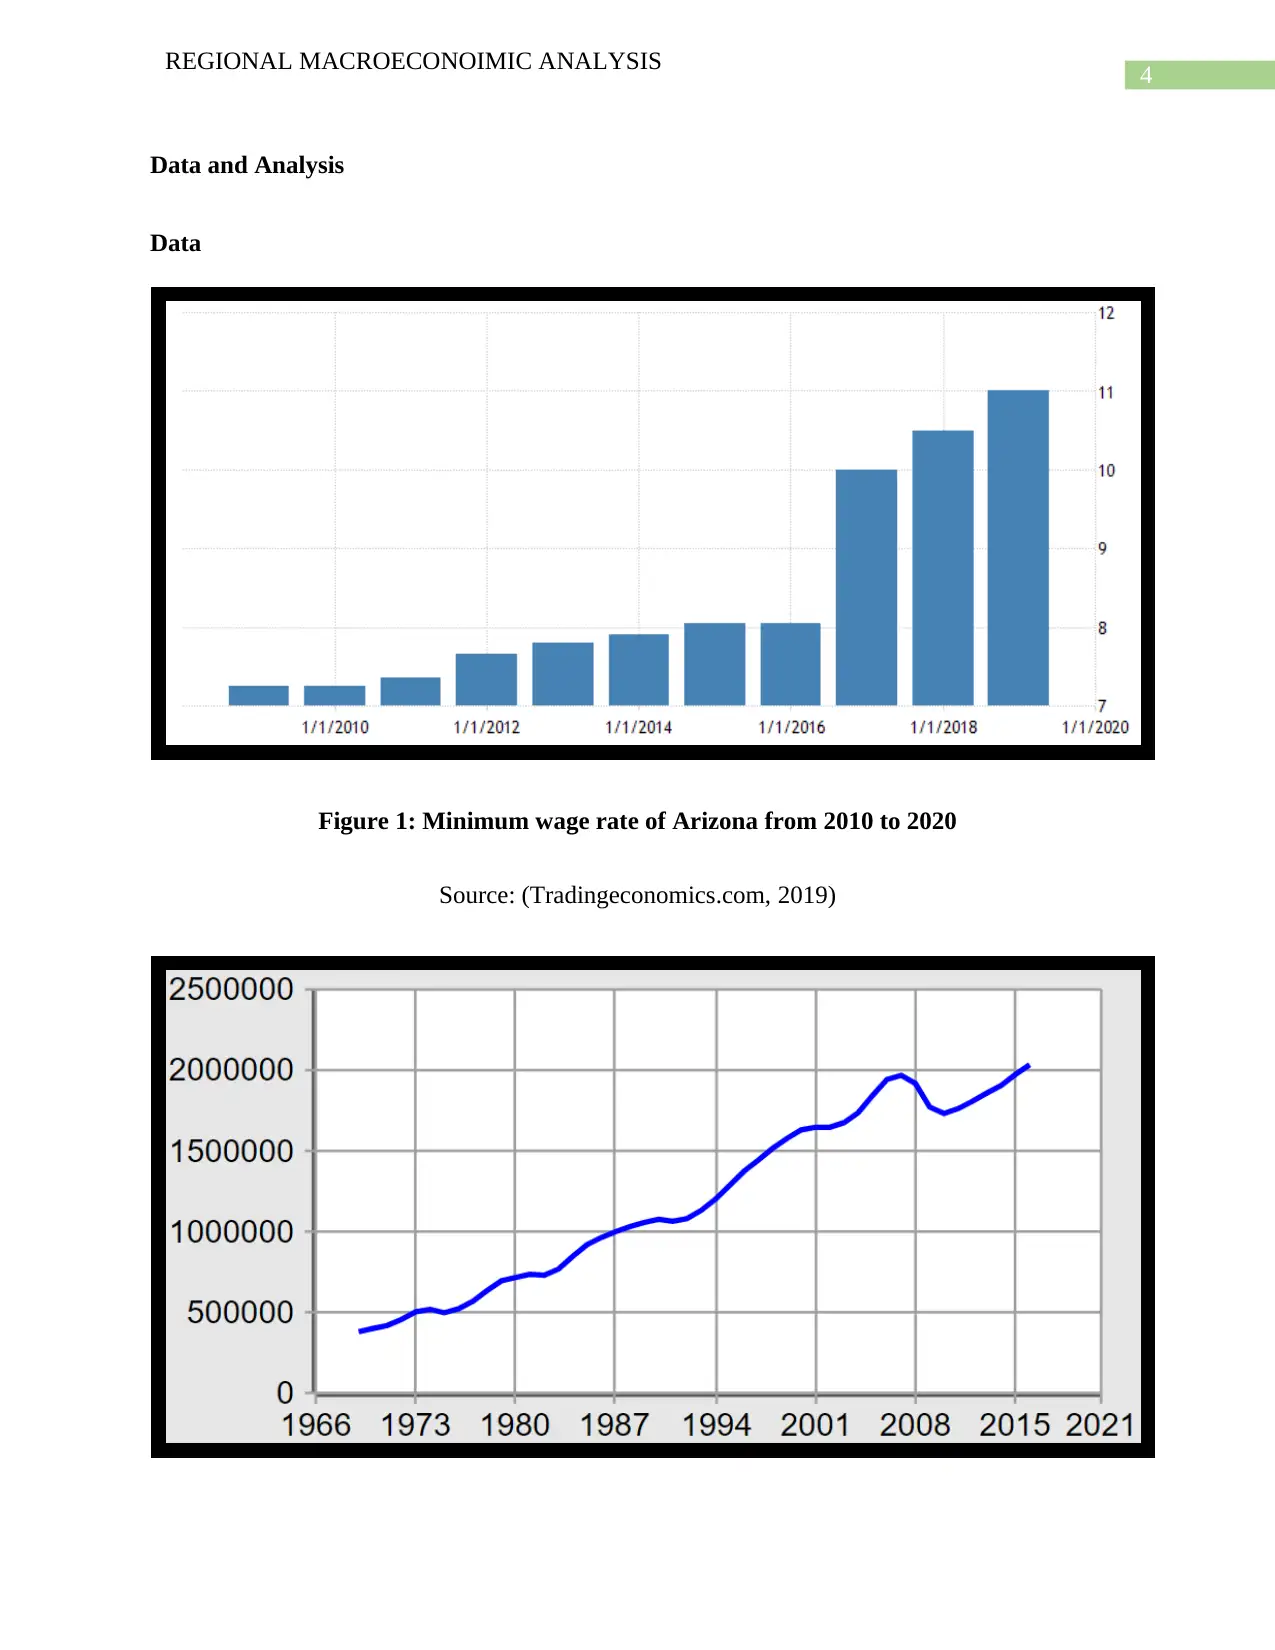
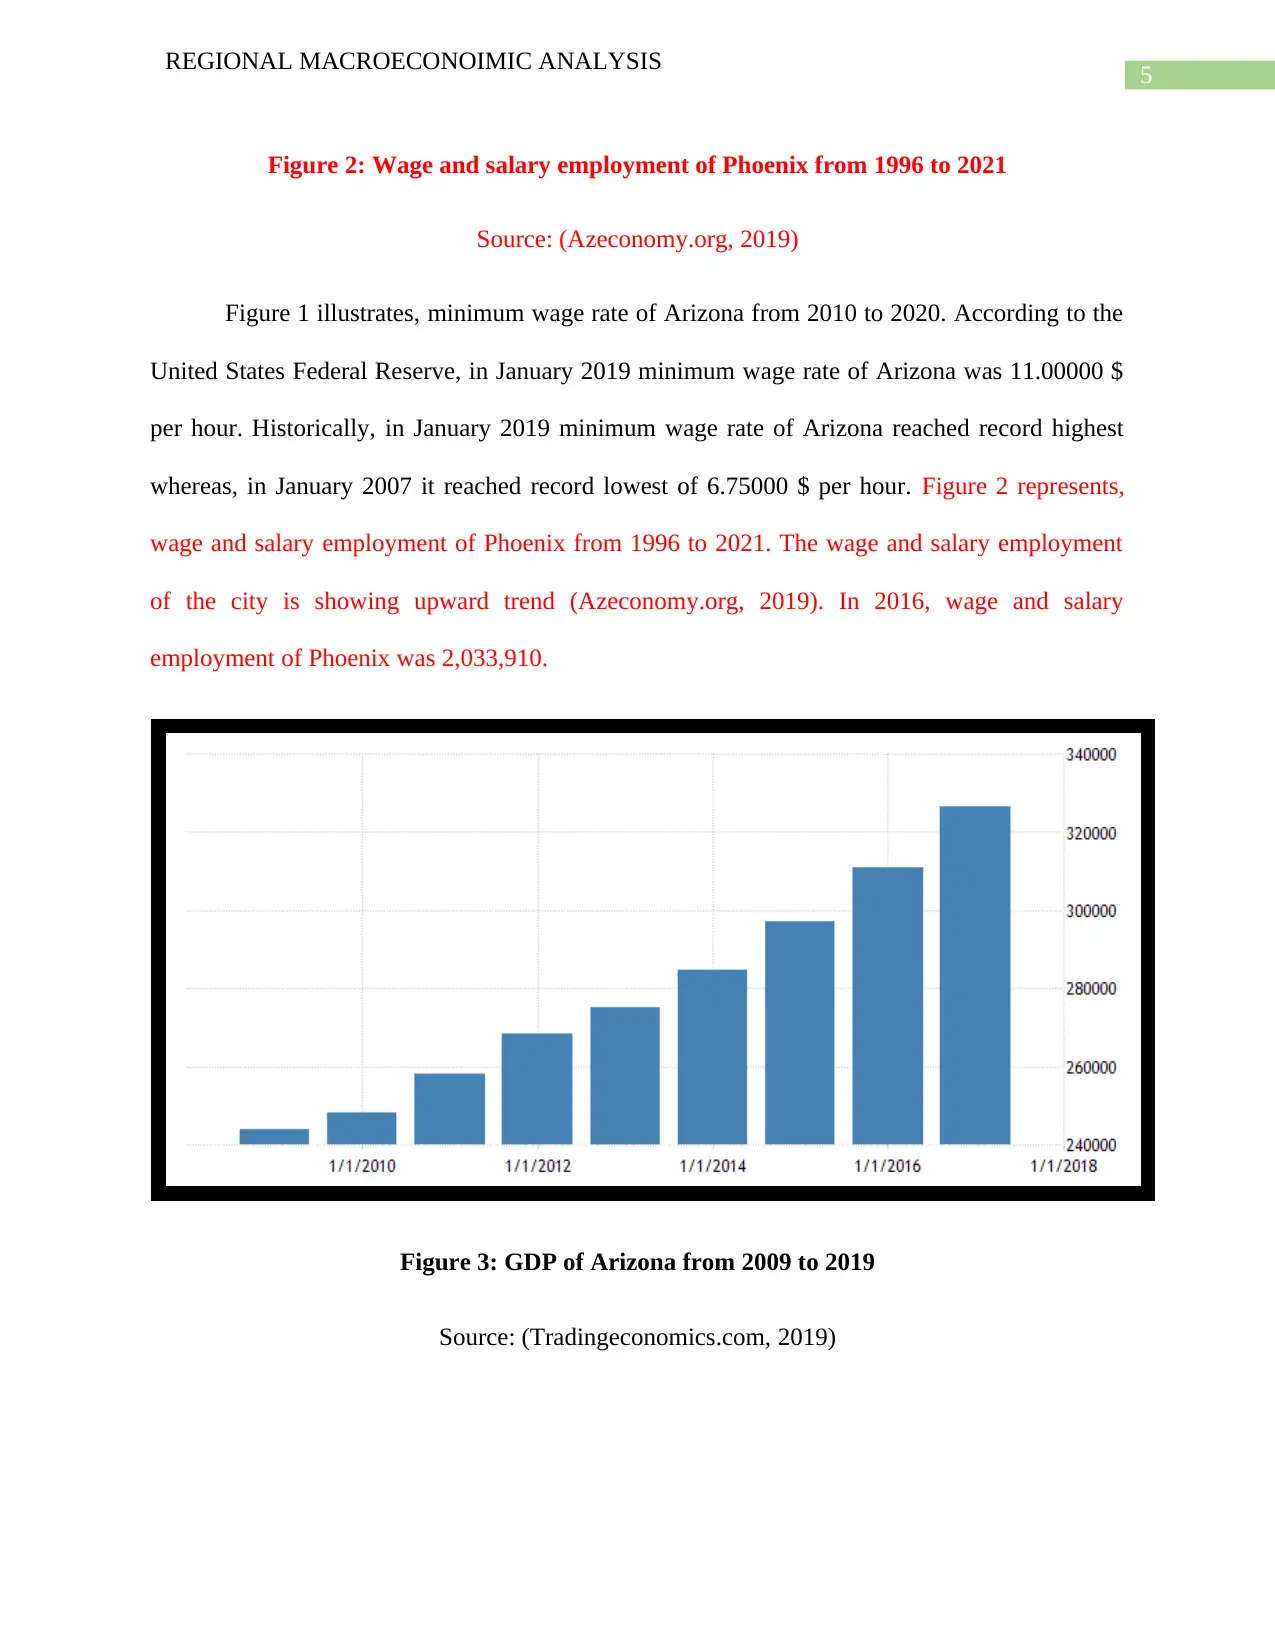
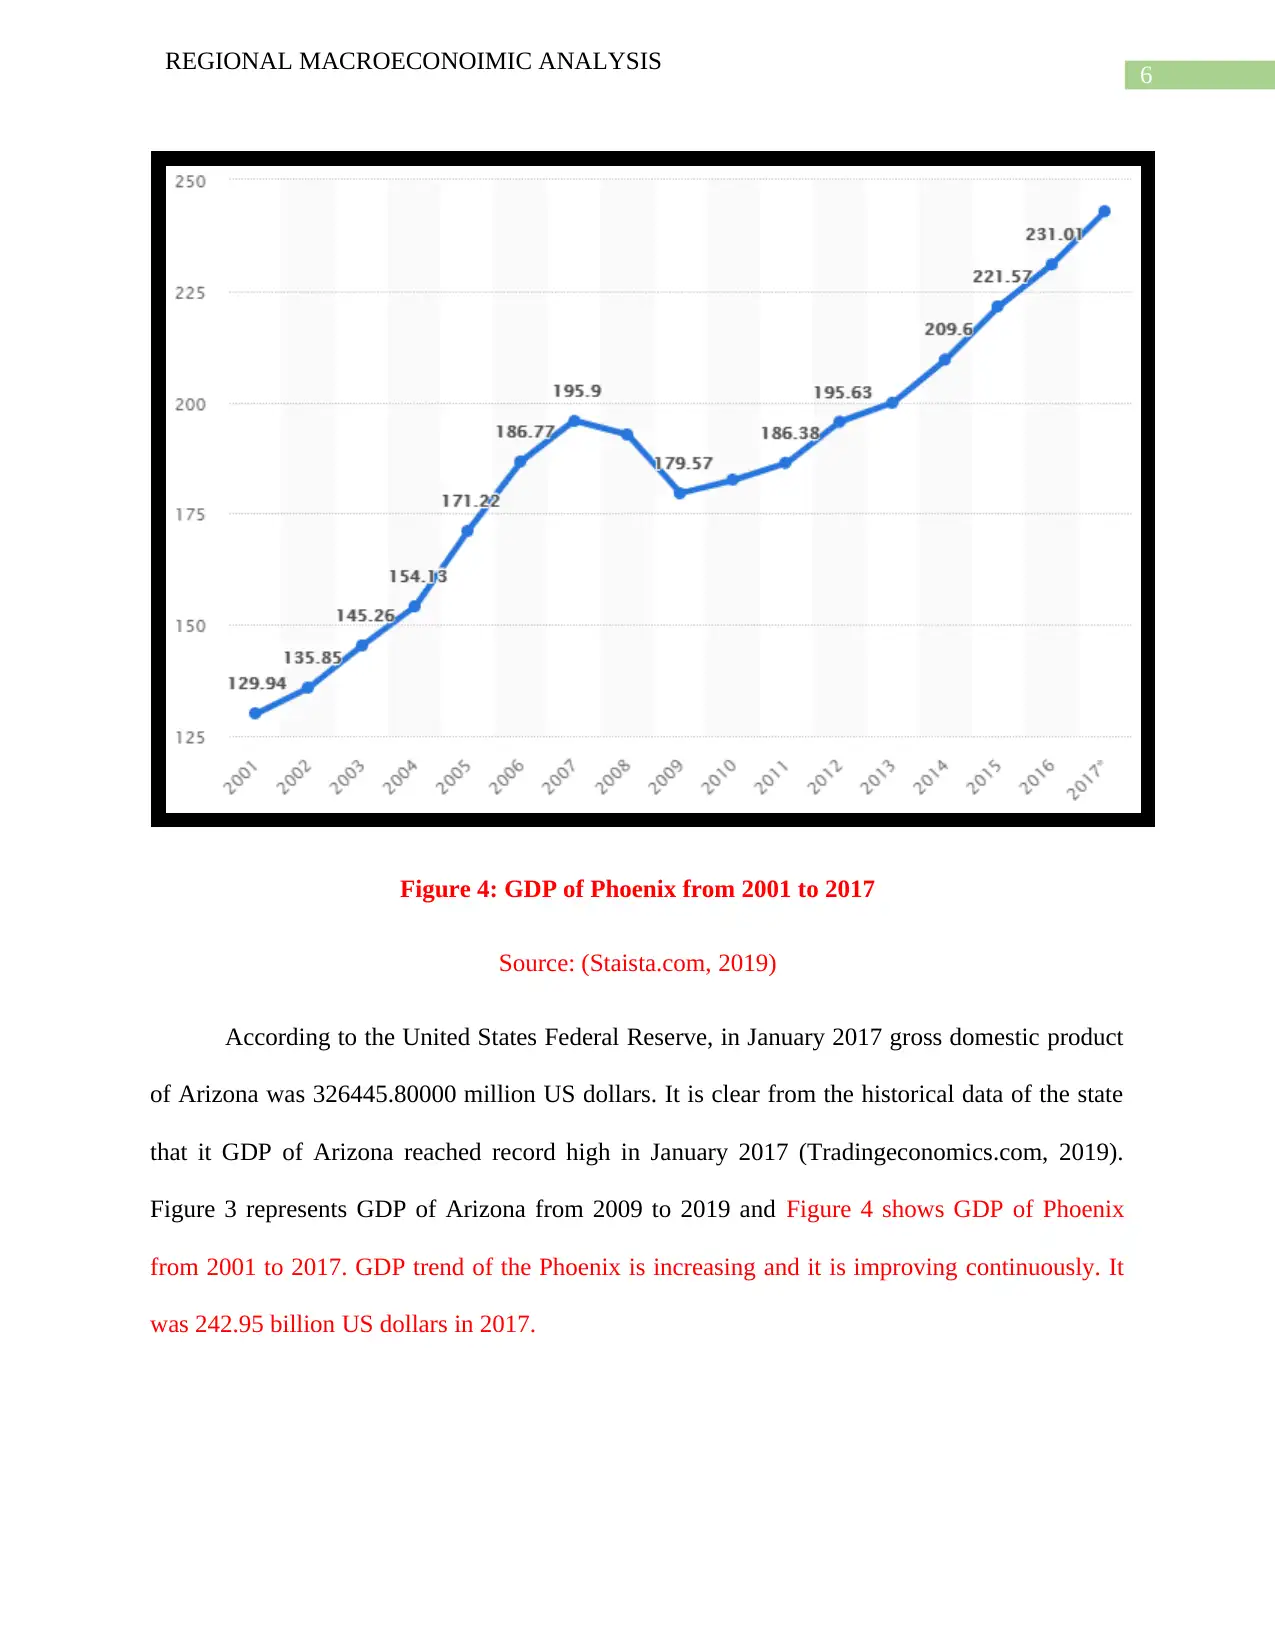
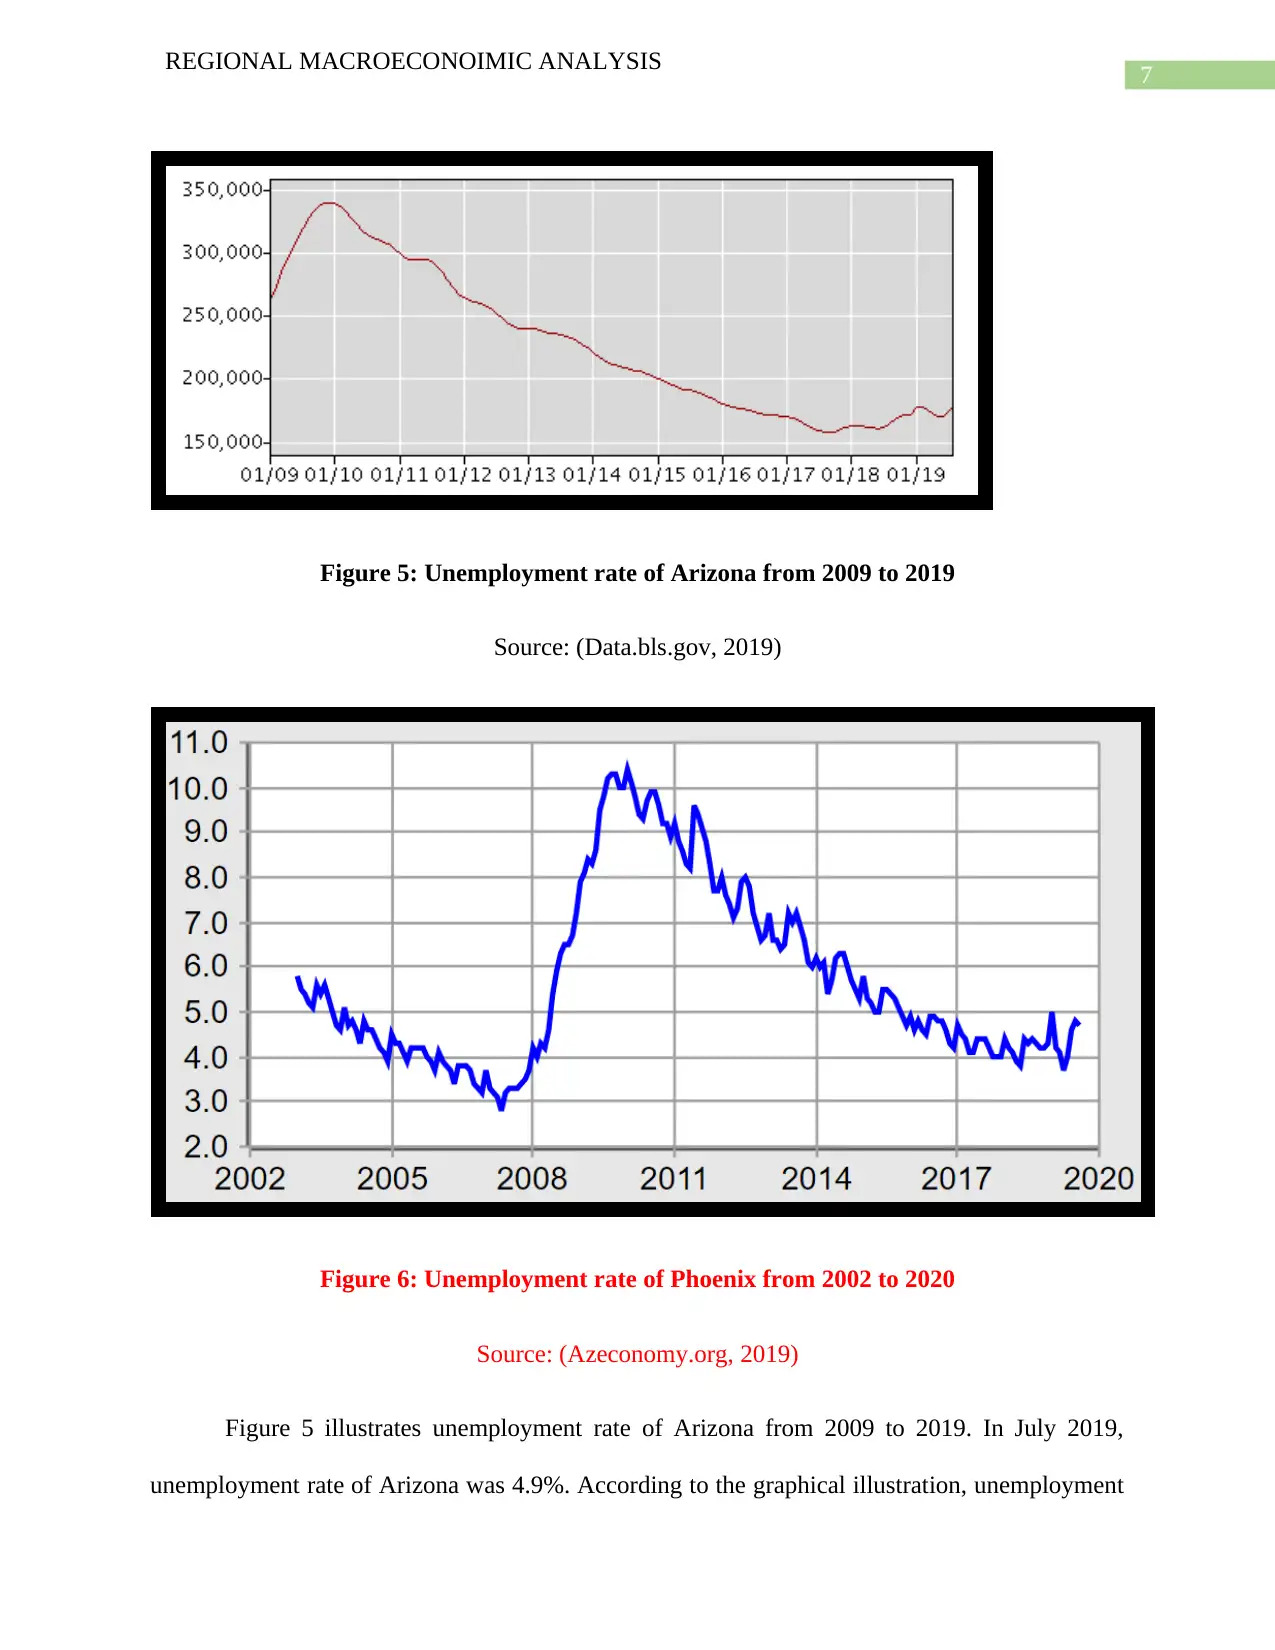
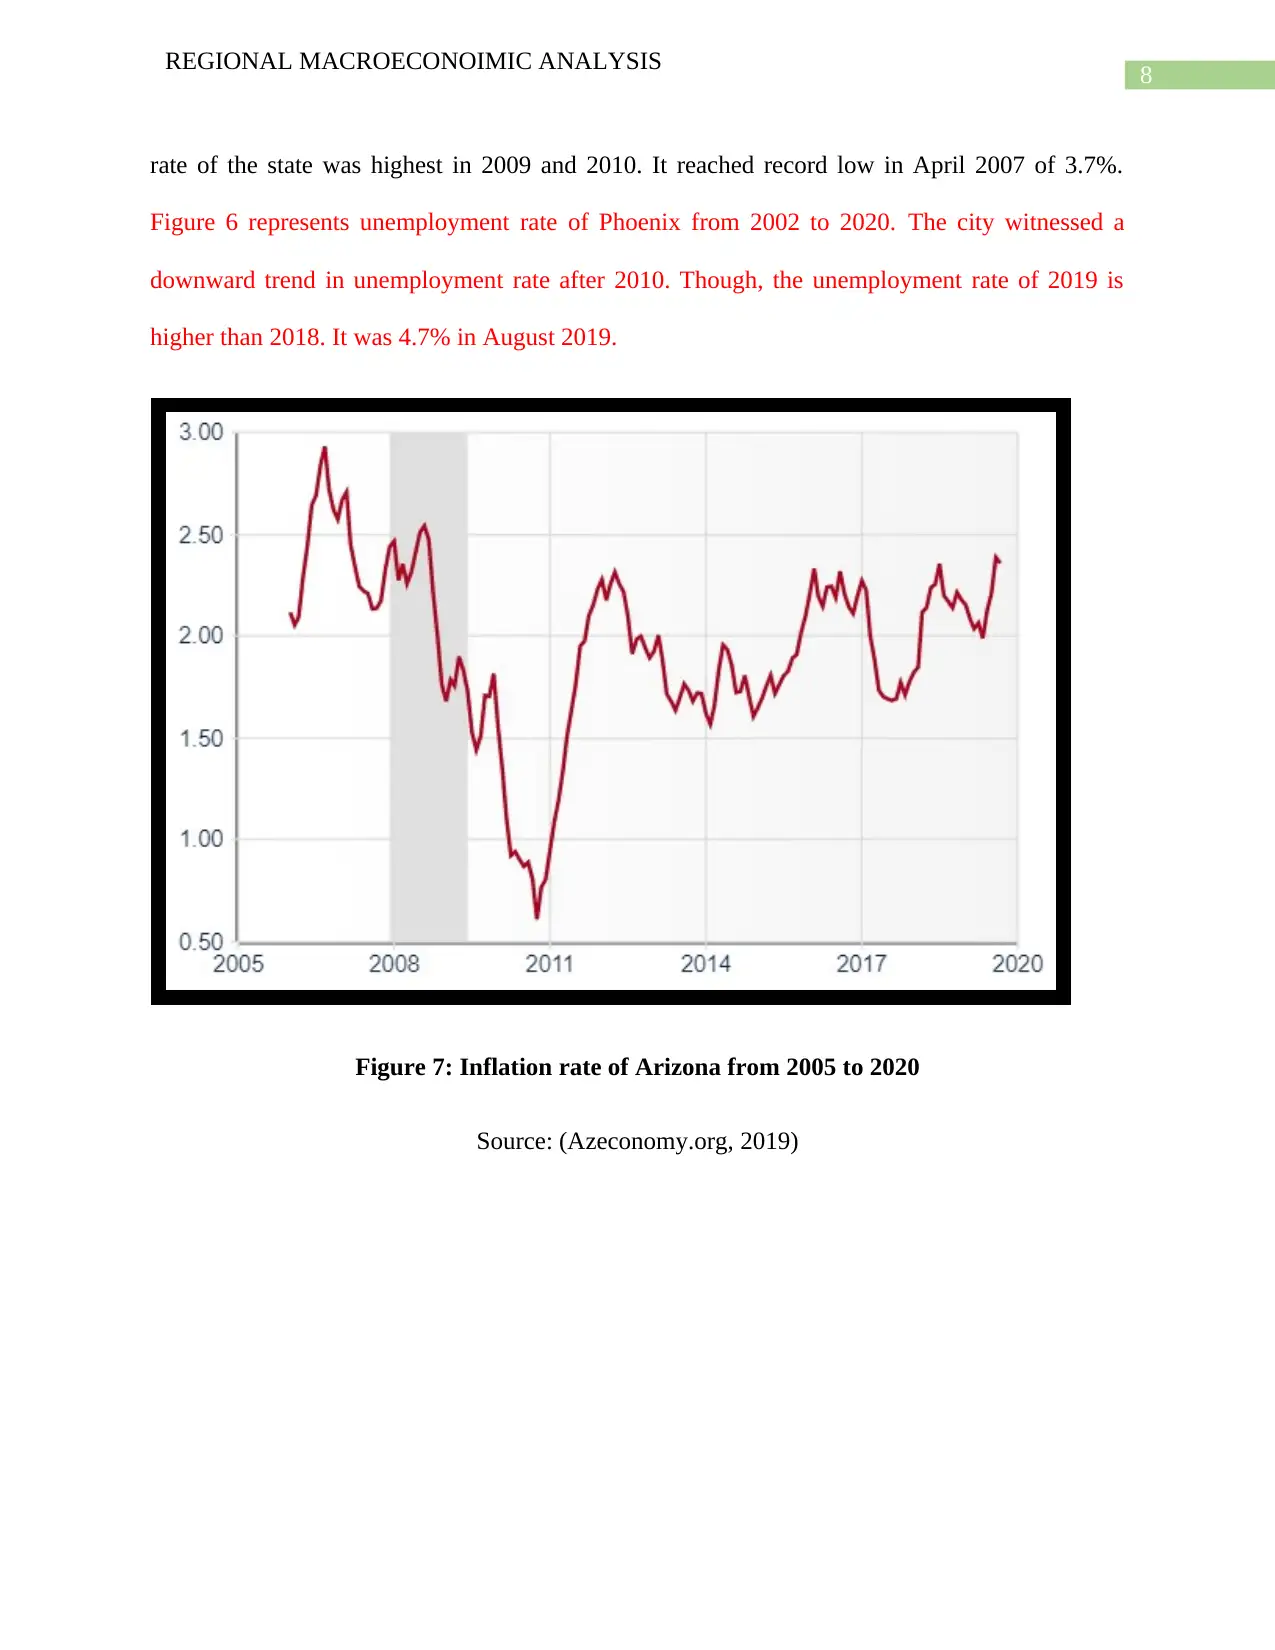
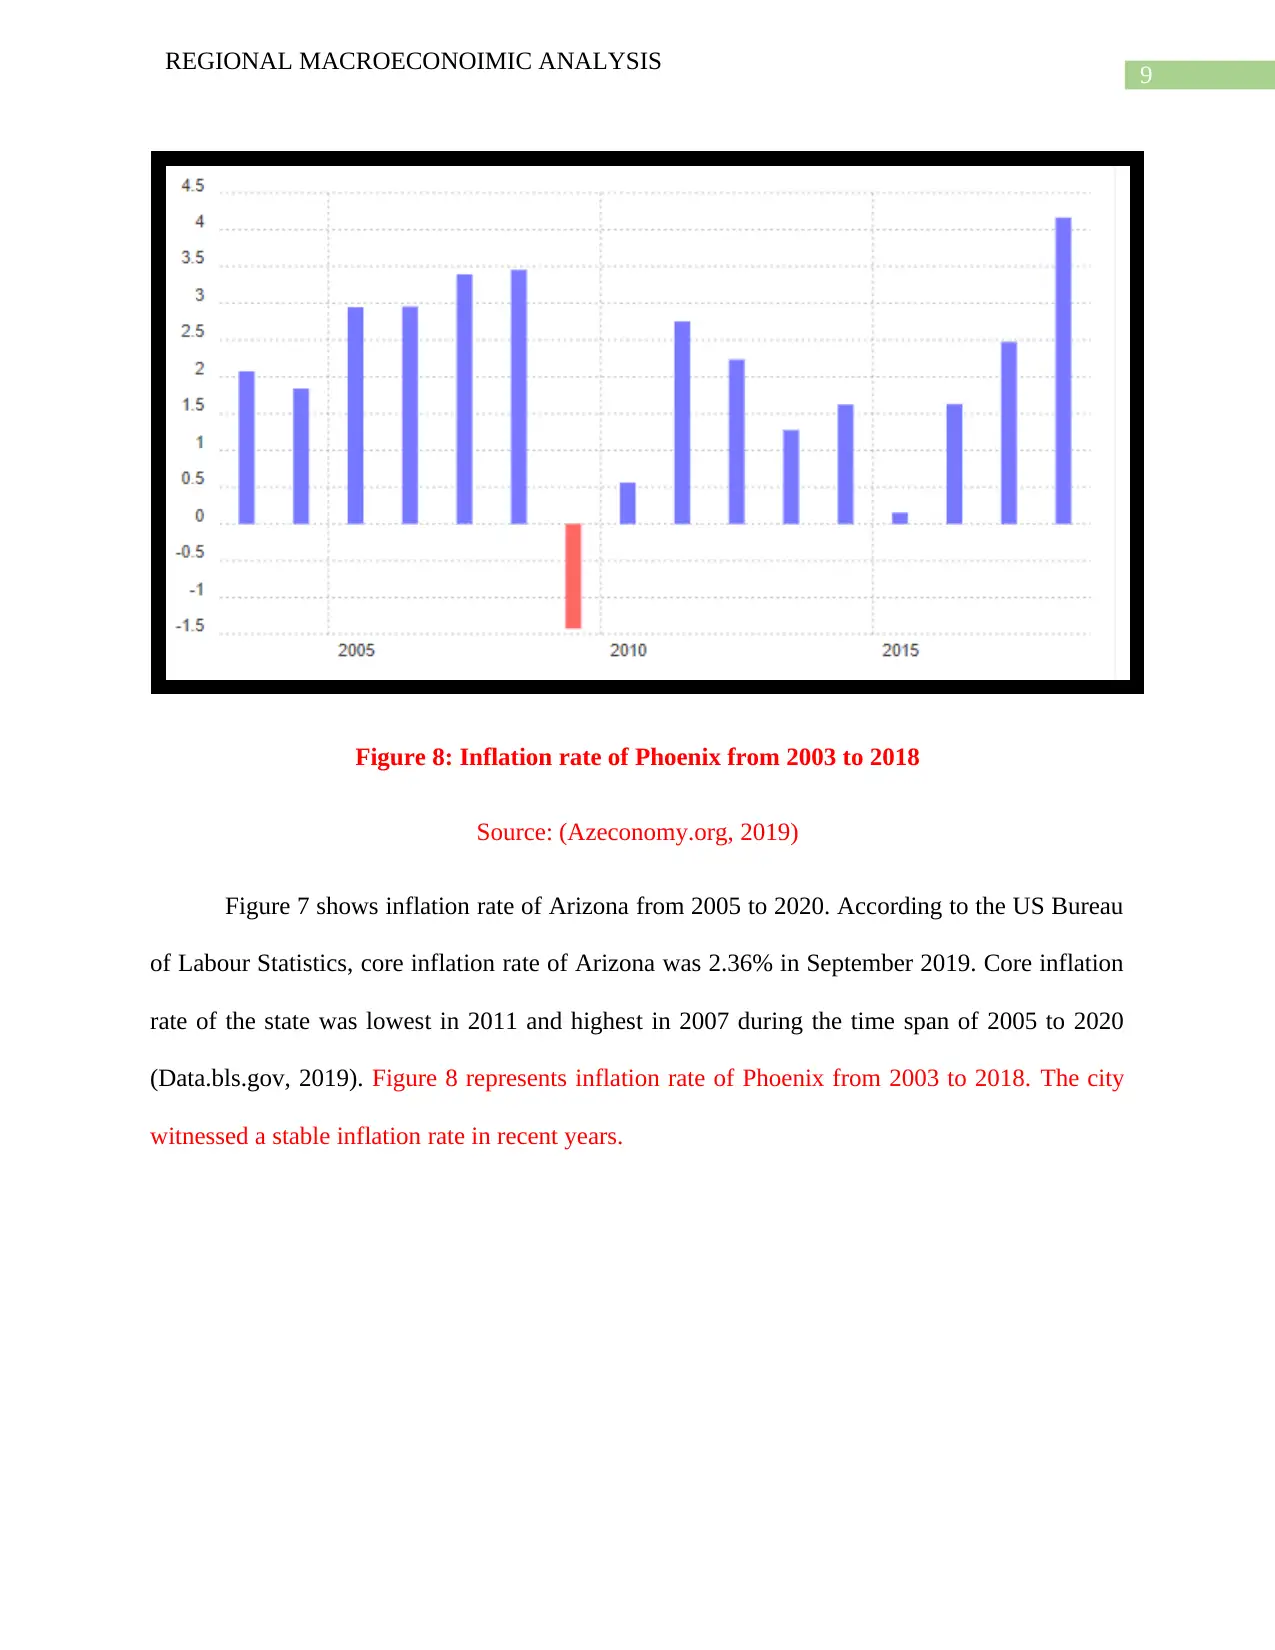
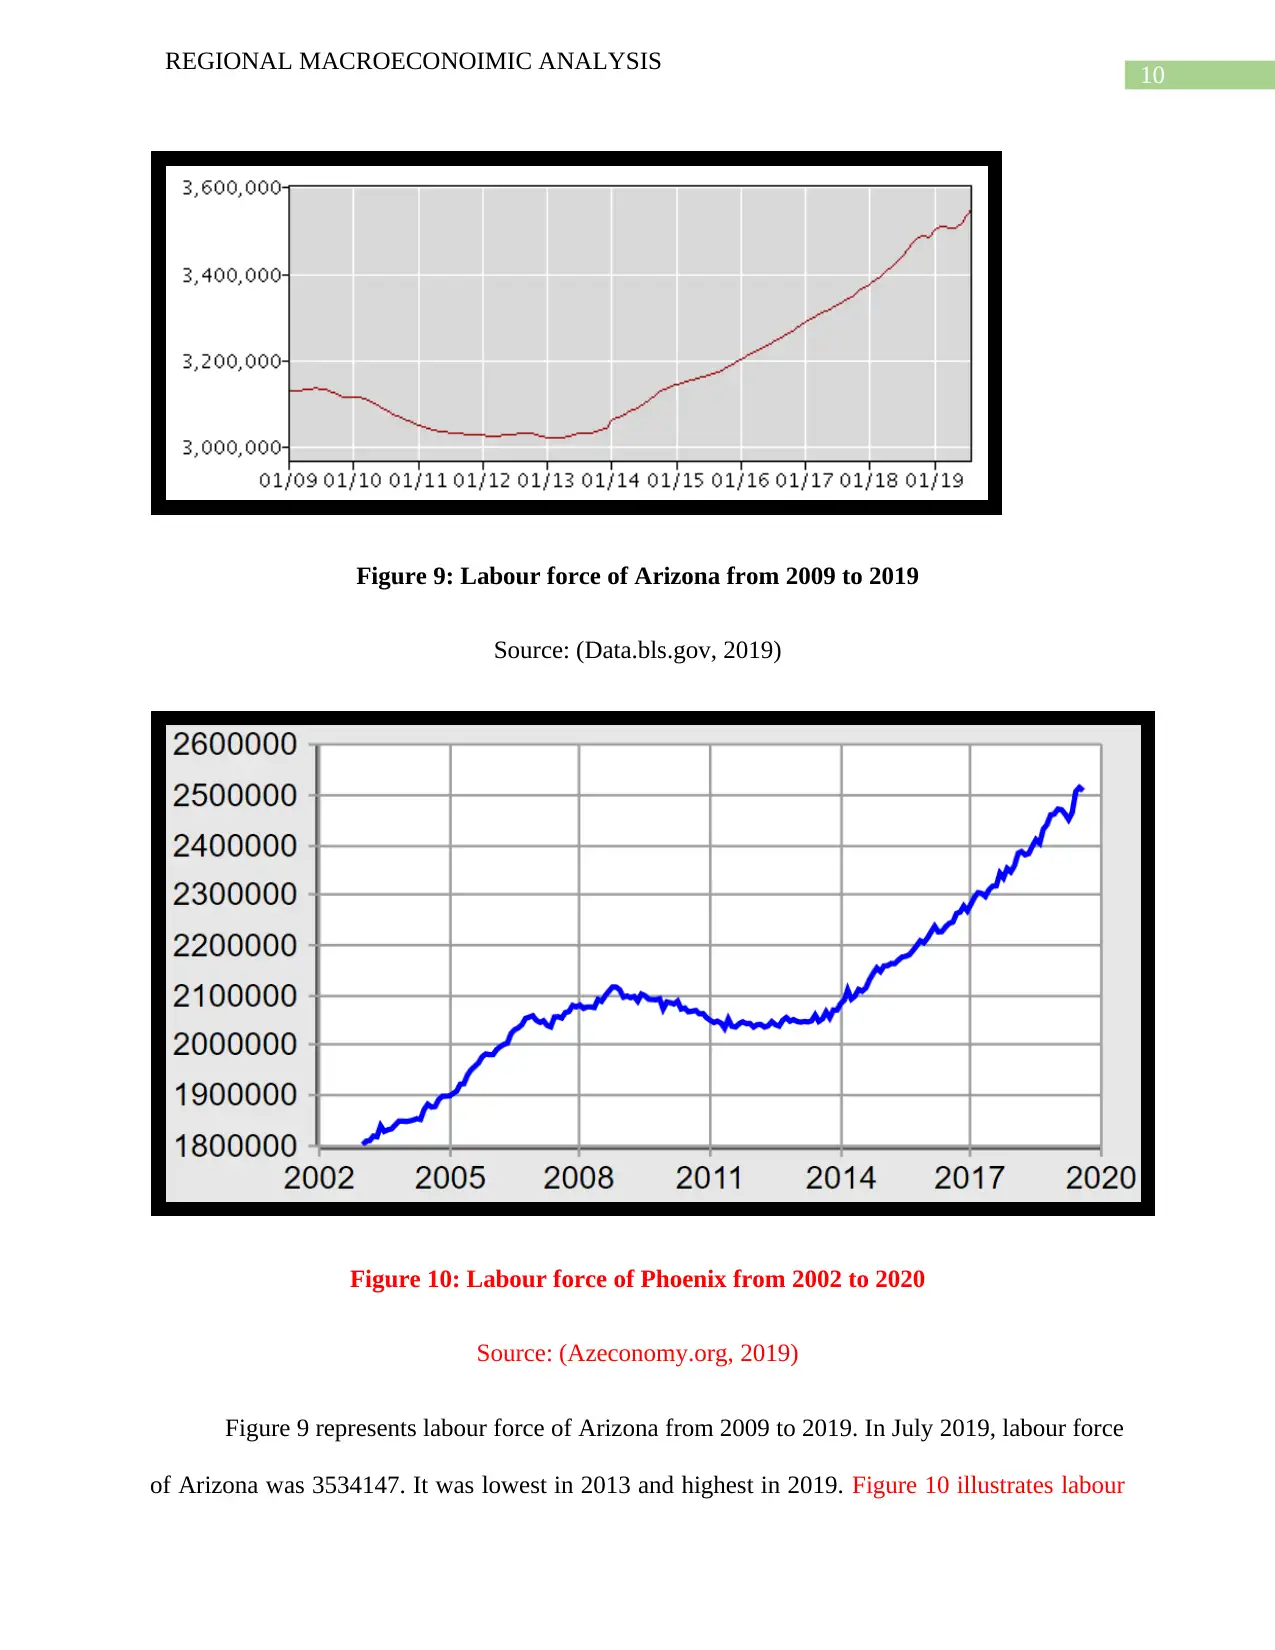
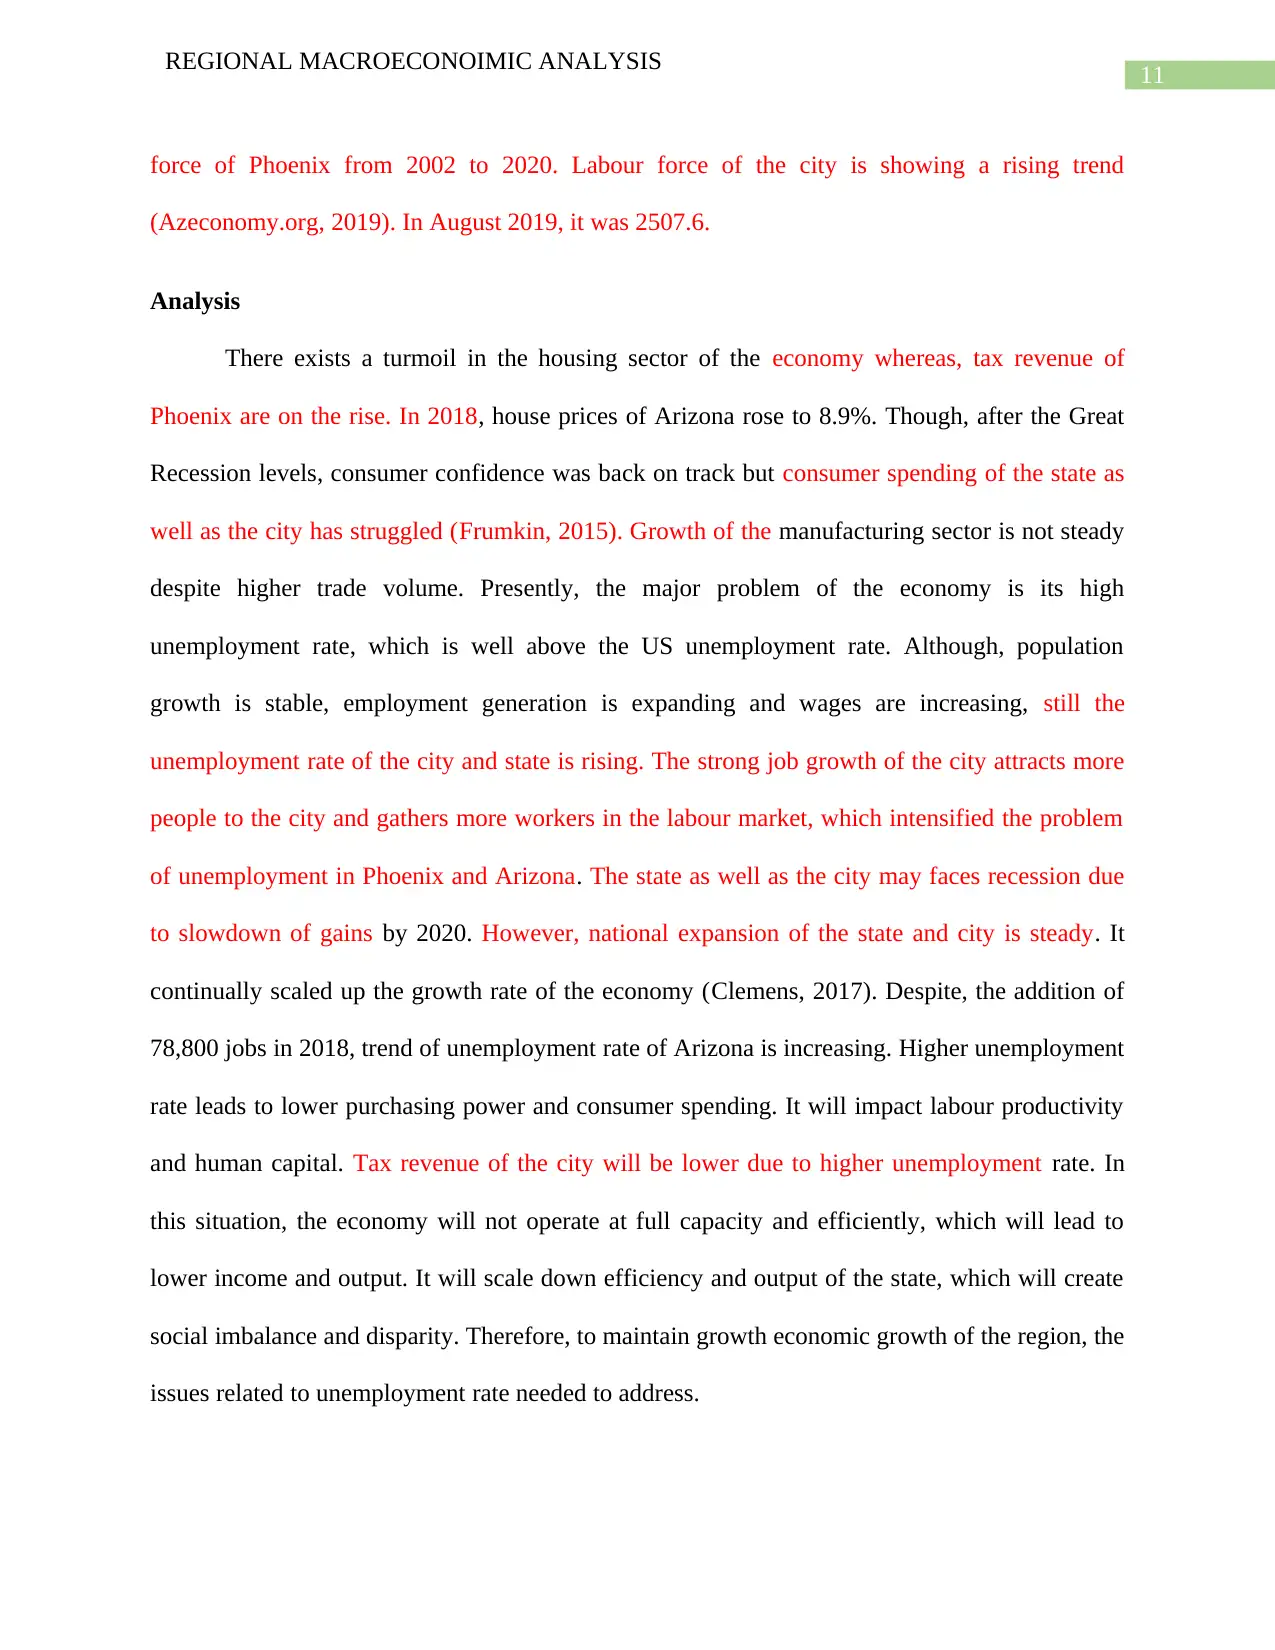
This case study provides a regional macroeconomic analysis of Arizona, examining key indicators such as GDP, unemployment rate, wages, labor force, and inflation. It delves into the economic challenges faced by the state, particularly the high unemployment rate despite strong GDP growth. The analysis includes data from various sources, illustrating trends in minimum wage, employment, GDP, and inflation. The study emphasizes the impact of unemployment on consumer spending, labor productivity, and tax revenue. The author suggests monetary policy tools, such as interest rate adjustments, and educational programs as potential solutions to address the unemployment problem and maintain economic growth and prosperity in Arizona. The assignment includes references to support the analysis and findings.
tabler-icon-diamond-filled.svg

Contribute Materials

Your contribution can guide someone’s learning journey. Share your documents today.
Document Page
Running head: REGIONAL MACROECONOIMIC ANALYSIS
Regional Macroeconomic Analysis
Name of the Author
E-mail Address of the Author
Class Name
Professor’s Name
Date
tabler-icon-diamond-filled.svg

Secure Best Marks with AI Grader

Need help grading? Try our AI Grader for instant feedback on your assignments.
Document Page
1
REGIONAL MACROECONOIMIC ANALYSIS
EXECUTIVE SUMMARY
This paper analyses macroeconomic indicators of Arizona, one of the largest state of US. The
regional macroeconomic analysis will help in examining the problems faced by the economy.
This paper aims to prepare a complete analysis of issues related to unemployment rate. Despite,
strong GDP growth of the region it suffered due to higher unemployment rate. This paper also
suggests economic tool to solve the problem of unemployment rate. It emphasizes on all
macroeconomic indicators and suggest solutions to maintain growth and prosperity of Arizona.
Document Page
2
REGIONAL MACROECONOIMIC ANALYSIS
Table of Contents
Introduction and Region Evaluation................................................................................................3
Data and Analysis............................................................................................................................4
Data..............................................................................................................................................4
Analysis.....................................................................................................................................11
Solution..........................................................................................................................................12
Reference List................................................................................................................................13
Document Page
3
REGIONAL MACROECONOIMIC ANALYSIS
Introduction and Region Evaluation
The southwestern state of United States (US) is Arizona. It is 6th largest state out of 50
states of US. Phoenix is the largest and capital city of Arizona. The role of the city is important
in the growth of Arizona. It stands 14th in terms of population out of all states of the country. In
2018, total population of the state was 7.17 million (Azeconomy.org, 2019). It increased from
population of 7.05 million in 2017. As of 2017, population of Phoenix was 4.73 million. In 2016,
wage and salary employment of Phoenix was 2,033,910. GDP of the city was 242.95 billion US
dollars in 2017. Unemployment rate was 4.7% in August 2019 (Staista.com, 2019). In January
2017, gross domestic product of Arizona was 326445.80000 million US dollars. According to the
U.S. Bureau of Economic Analysis, real GDP of Arizona grew by 4 % in 2018. It was the fourth-
highest state in terms of GDP growth in 2018. The major sectors of Arizona which contributed
maximum to the GDP of state such as rental leasing, manufacturing, construction and real estate
(Heinemann & Noussair, 2015). The most tradable products of Arizona are civilian aircraft,
copper ores, electronic integrated circuits, processor and controllers and engines. These products
contributed significantly on GDP of the state. The region witnessed strong growth of exports.
The government budget of Arizona of 2020 is estimated at 43.4 billion US dollars.
The five macroeconomic indicators of the state are wages, unemployment rate, GDP,
labour force and inflation rate. The main problem of the economy of Arizona is higher
unemployment rate (Herrendorf & Schoellman, 2017). Despite, steady growth in GDP, higher
wages and strong labour force, the economy have suffered due to high unemployment rate.
tabler-icon-diamond-filled.svg

Secure Best Marks with AI Grader

Need help grading? Try our AI Grader for instant feedback on your assignments.
Document Page
4
REGIONAL MACROECONOIMIC ANALYSIS
Data and Analysis
Data
Figure 1: Minimum wage rate of Arizona from 2010 to 2020
Source: (Tradingeconomics.com, 2019)
Document Page
5
REGIONAL MACROECONOIMIC ANALYSIS
Figure 2: Wage and salary employment of Phoenix from 1996 to 2021
Source: (Azeconomy.org, 2019)
Figure 1 illustrates, minimum wage rate of Arizona from 2010 to 2020. According to the
United States Federal Reserve, in January 2019 minimum wage rate of Arizona was 11.00000 $
per hour. Historically, in January 2019 minimum wage rate of Arizona reached record highest
whereas, in January 2007 it reached record lowest of 6.75000 $ per hour. Figure 2 represents,
wage and salary employment of Phoenix from 1996 to 2021. The wage and salary employment
of the city is showing upward trend (Azeconomy.org, 2019). In 2016, wage and salary
employment of Phoenix was 2,033,910.
Figure 3: GDP of Arizona from 2009 to 2019
Source: (Tradingeconomics.com, 2019)
Document Page
6
REGIONAL MACROECONOIMIC ANALYSIS
Figure 4: GDP of Phoenix from 2001 to 2017
Source: (Staista.com, 2019)
According to the United States Federal Reserve, in January 2017 gross domestic product
of Arizona was 326445.80000 million US dollars. It is clear from the historical data of the state
that it GDP of Arizona reached record high in January 2017 (Tradingeconomics.com, 2019).
Figure 3 represents GDP of Arizona from 2009 to 2019 and Figure 4 shows GDP of Phoenix
from 2001 to 2017. GDP trend of the Phoenix is increasing and it is improving continuously. It
was 242.95 billion US dollars in 2017.
tabler-icon-diamond-filled.svg

Paraphrase This Document

Need a fresh take? Get an instant paraphrase of this document with our AI Paraphraser
Document Page
7
REGIONAL MACROECONOIMIC ANALYSIS
Figure 5: Unemployment rate of Arizona from 2009 to 2019
Source: (Data.bls.gov, 2019)
Figure 6: Unemployment rate of Phoenix from 2002 to 2020
Source: (Azeconomy.org, 2019)
Figure 5 illustrates unemployment rate of Arizona from 2009 to 2019. In July 2019,
unemployment rate of Arizona was 4.9%. According to the graphical illustration, unemployment
Document Page
8
REGIONAL MACROECONOIMIC ANALYSIS
rate of the state was highest in 2009 and 2010. It reached record low in April 2007 of 3.7%.
Figure 6 represents unemployment rate of Phoenix from 2002 to 2020. The city witnessed a
downward trend in unemployment rate after 2010. Though, the unemployment rate of 2019 is
higher than 2018. It was 4.7% in August 2019.
Figure 7: Inflation rate of Arizona from 2005 to 2020
Source: (Azeconomy.org, 2019)
Document Page
9
REGIONAL MACROECONOIMIC ANALYSIS
Figure 8: Inflation rate of Phoenix from 2003 to 2018
Source: (Azeconomy.org, 2019)
Figure 7 shows inflation rate of Arizona from 2005 to 2020. According to the US Bureau
of Labour Statistics, core inflation rate of Arizona was 2.36% in September 2019. Core inflation
rate of the state was lowest in 2011 and highest in 2007 during the time span of 2005 to 2020
(Data.bls.gov, 2019). Figure 8 represents inflation rate of Phoenix from 2003 to 2018. The city
witnessed a stable inflation rate in recent years.
tabler-icon-diamond-filled.svg

Secure Best Marks with AI Grader

Need help grading? Try our AI Grader for instant feedback on your assignments.
Document Page
10
REGIONAL MACROECONOIMIC ANALYSIS
Figure 9: Labour force of Arizona from 2009 to 2019
Source: (Data.bls.gov, 2019)
Figure 10: Labour force of Phoenix from 2002 to 2020
Source: (Azeconomy.org, 2019)
Figure 9 represents labour force of Arizona from 2009 to 2019. In July 2019, labour force
of Arizona was 3534147. It was lowest in 2013 and highest in 2019. Figure 10 illustrates labour
Document Page
11
REGIONAL MACROECONOIMIC ANALYSIS
force of Phoenix from 2002 to 2020. Labour force of the city is showing a rising trend
(Azeconomy.org, 2019). In August 2019, it was 2507.6.
Analysis
There exists a turmoil in the housing sector of the economy whereas, tax revenue of
Phoenix are on the rise. In 2018, house prices of Arizona rose to 8.9%. Though, after the Great
Recession levels, consumer confidence was back on track but consumer spending of the state as
well as the city has struggled (Frumkin, 2015). Growth of the manufacturing sector is not steady
despite higher trade volume. Presently, the major problem of the economy is its high
unemployment rate, which is well above the US unemployment rate. Although, population
growth is stable, employment generation is expanding and wages are increasing, still the
unemployment rate of the city and state is rising. The strong job growth of the city attracts more
people to the city and gathers more workers in the labour market, which intensified the problem
of unemployment in Phoenix and Arizona. The state as well as the city may faces recession due
to slowdown of gains by 2020. However, national expansion of the state and city is steady. It
continually scaled up the growth rate of the economy (Clemens, 2017). Despite, the addition of
78,800 jobs in 2018, trend of unemployment rate of Arizona is increasing. Higher unemployment
rate leads to lower purchasing power and consumer spending. It will impact labour productivity
and human capital. Tax revenue of the city will be lower due to higher unemployment rate. In
this situation, the economy will not operate at full capacity and efficiently, which will lead to
lower income and output. It will scale down efficiency and output of the state, which will create
social imbalance and disparity. Therefore, to maintain growth economic growth of the region, the
issues related to unemployment rate needed to address.
Document Page
12
REGIONAL MACROECONOIMIC ANALYSIS
Solution
State government may take monetary policy to control unemployment rate of Phoenix. It
will boost aggregate demand by cutting rate of interest. Rebounded aggregate demand will scale
up growth and development of the region. To control increasing trend of unemployment rate
introduction of monetary policy plays an important role. It will help address issues related to
unemployment (Overstreet, 2019). Government may conduct some training and education
program to spread awareness and reduce unemployment rate. It may use some tools to boost
flexibility of labour market. Rate of unemployment will decrease due to strong growth of labour
market.
tabler-icon-diamond-filled.svg

Paraphrase This Document

Need a fresh take? Get an instant paraphrase of this document with our AI Paraphraser
Document Page
13
REGIONAL MACROECONOIMIC ANALYSIS
Reference List
Arizona Inflation and Prices. (2017). Arizona's Economy. Retrieved 17 October 2019, from
https://www.azeconomy.org/arizona-inflation-and-prices/
Bureau of Labor Statistics Data. (2019). Data.bls.gov. Retrieved 17 October 2019, from
https://data.bls.gov/timeseries/LASST040000000000003?amp
%253bdata_tool=XGtable&output_view=data&include_graphs=true
Clemens, J. (2017). The Minimum Wage and the Great Recession: A Response to Zipperer and
Recapitulation of the Evidence.
Frumkin, N. (2015). Guide to economic indicators. Routledge.
Heinemann, F., & Noussair, C. (2015). Macroeconomic experiments. Journal of Economic
Studies, 42(6), 930-942.
Herrendorf, B., & Schoellman, T. (2017). Wages, human capital, and structural transformation.
Overstreet, D. (2019). The Effect of Minimum Wage on Per Capita Income in Arizona:
Empirical Analysis. Poverty & Public Policy, 11(1-2), 156-168.
Phoenix metro area - GDP 2017 | Statista. (2019). Statista. Retrieved 18 October 2019, from
https://www.statista.com/statistics/183876/gdp-of-the-phoenix-metro-area/
State Minimum Wage Rate for Arizona . (2019). Tradingeconomics.com. Retrieved 17 October
2019, from https://tradingeconomics.com/united-states/state-minimum-wage-rate-for-
arizona-fed-data.html
chevron_up_icon
1 out of 14
circle_padding
hide_on_mobile
zoom_out_icon
logo.png

Your All-in-One AI-Powered Toolkit for Academic Success.

Available 24*7 on WhatsApp / Email

[object Object]