Economics Assignment 1: Macroeconomic Analysis and AD-AS Model
VerifiedAdded on 2021/06/17
|12
|1588
|50
Homework Assignment
AI Summary
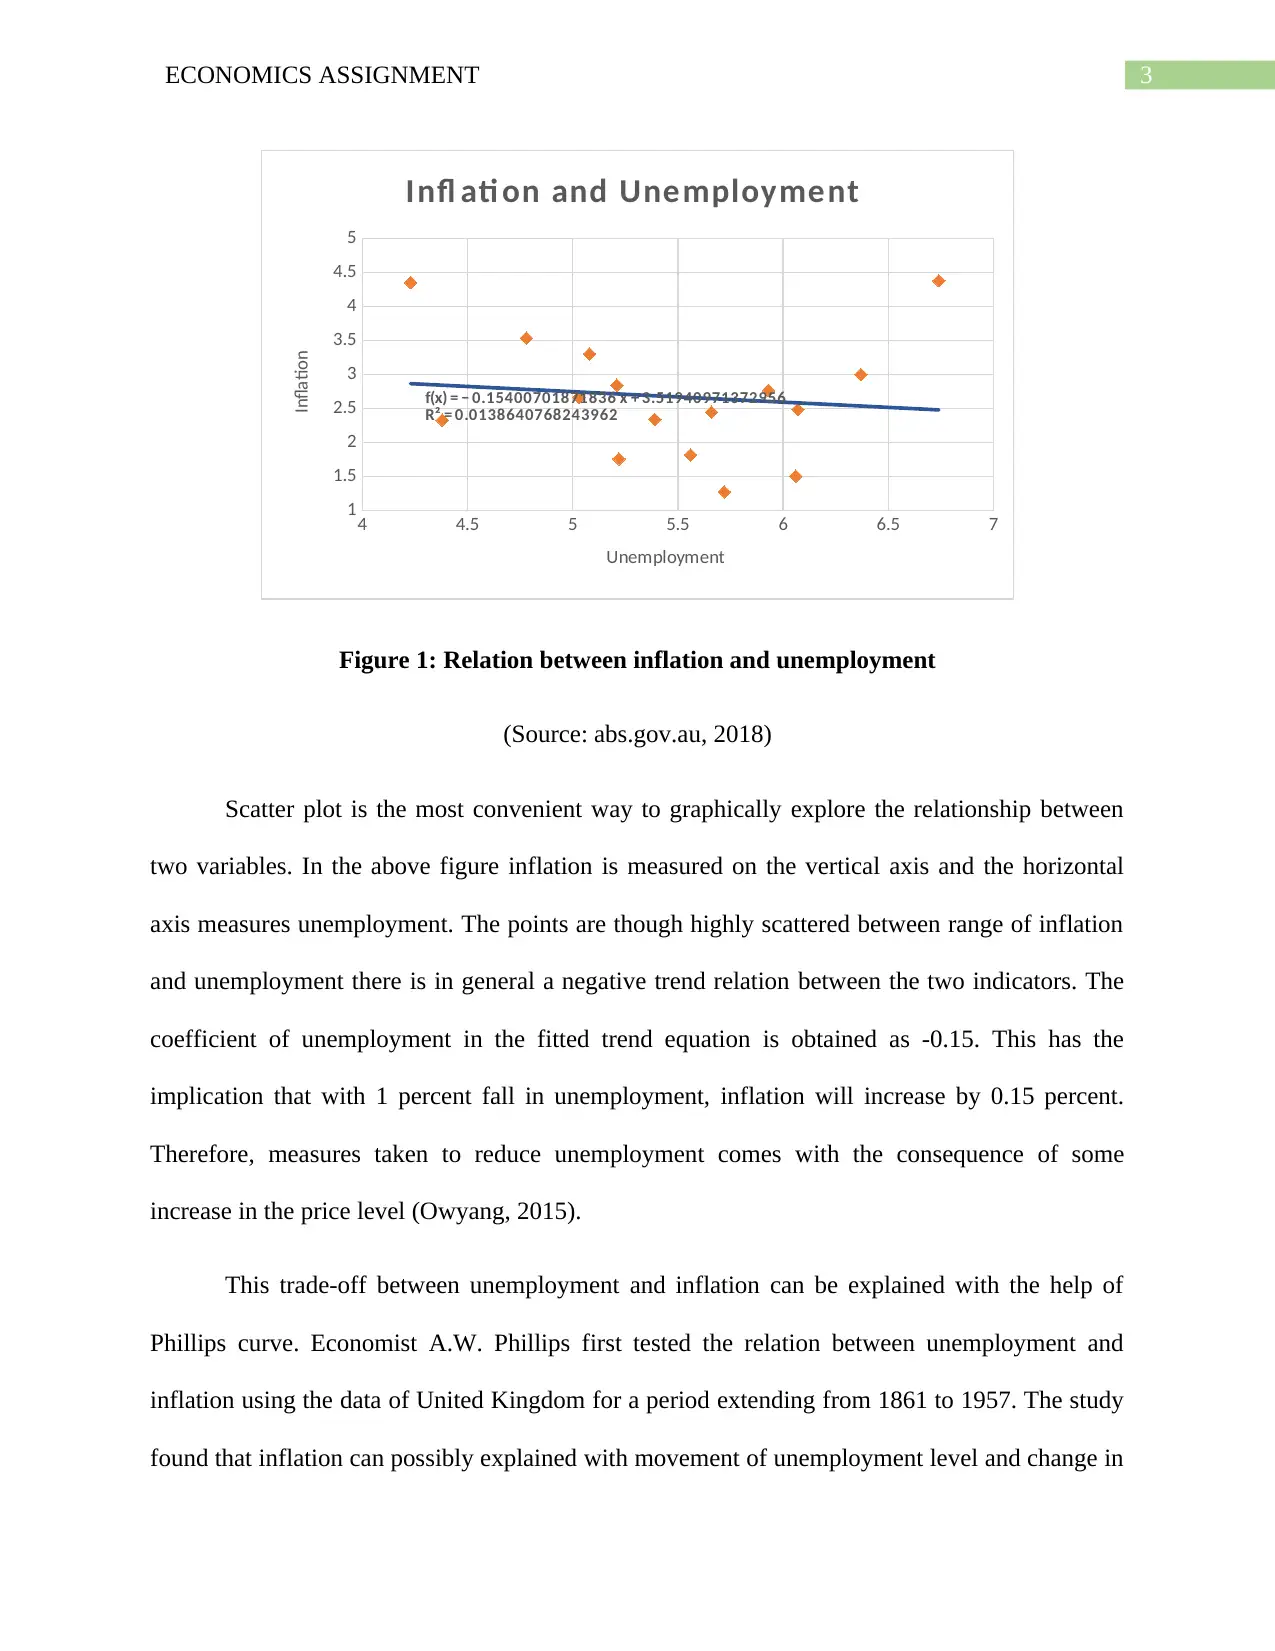
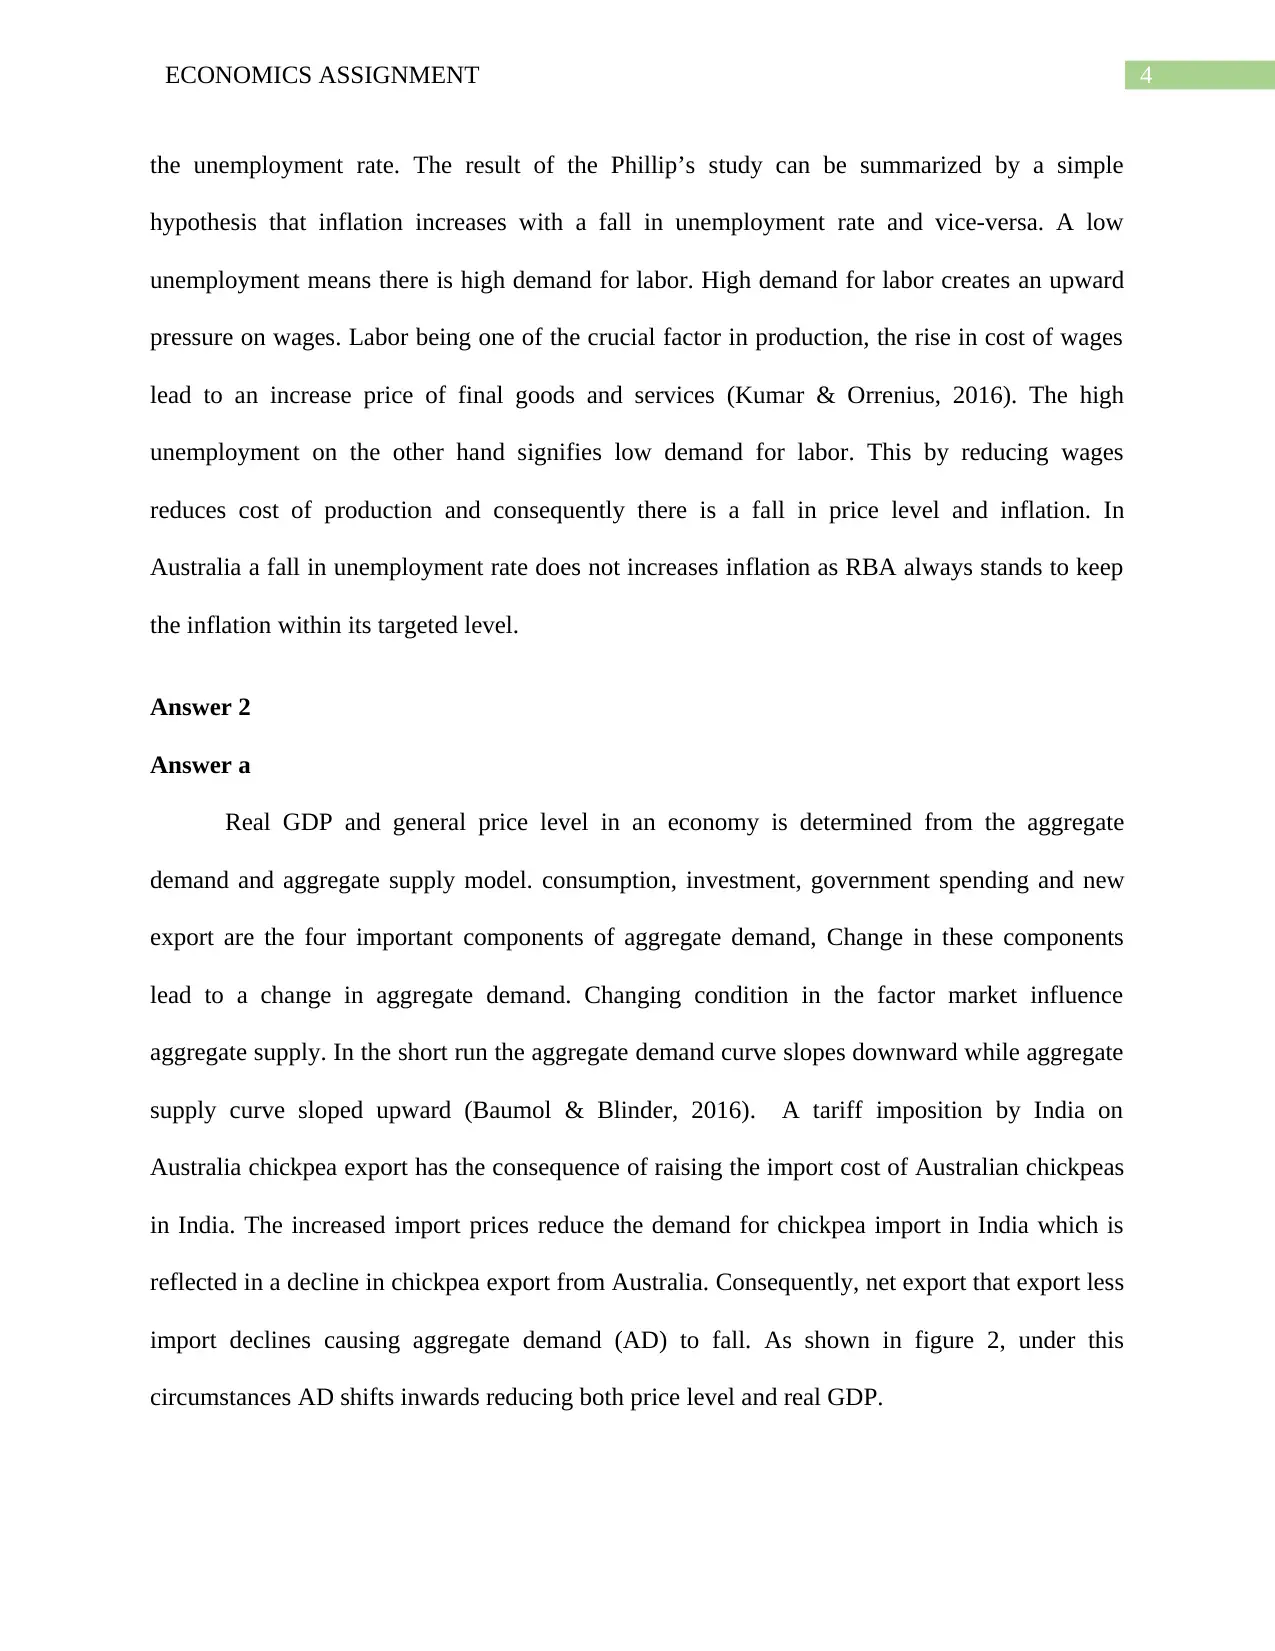
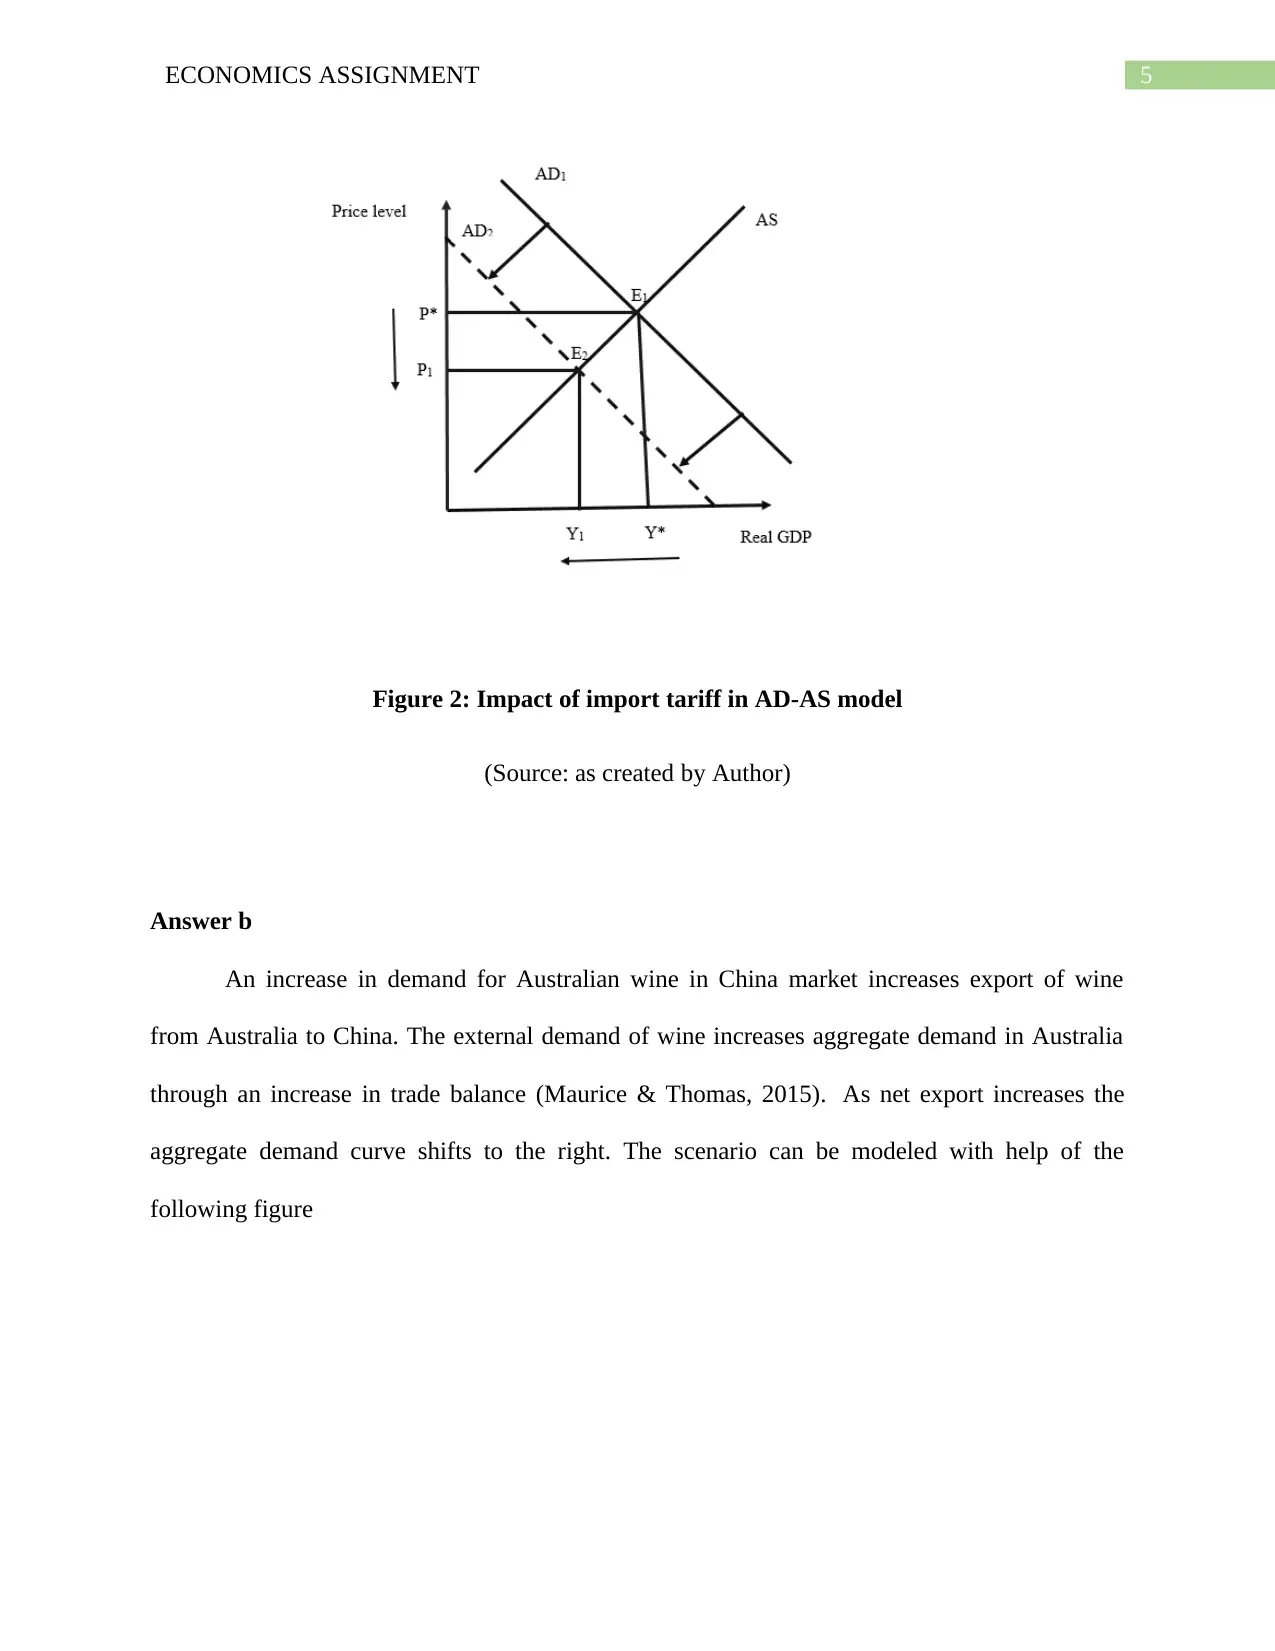
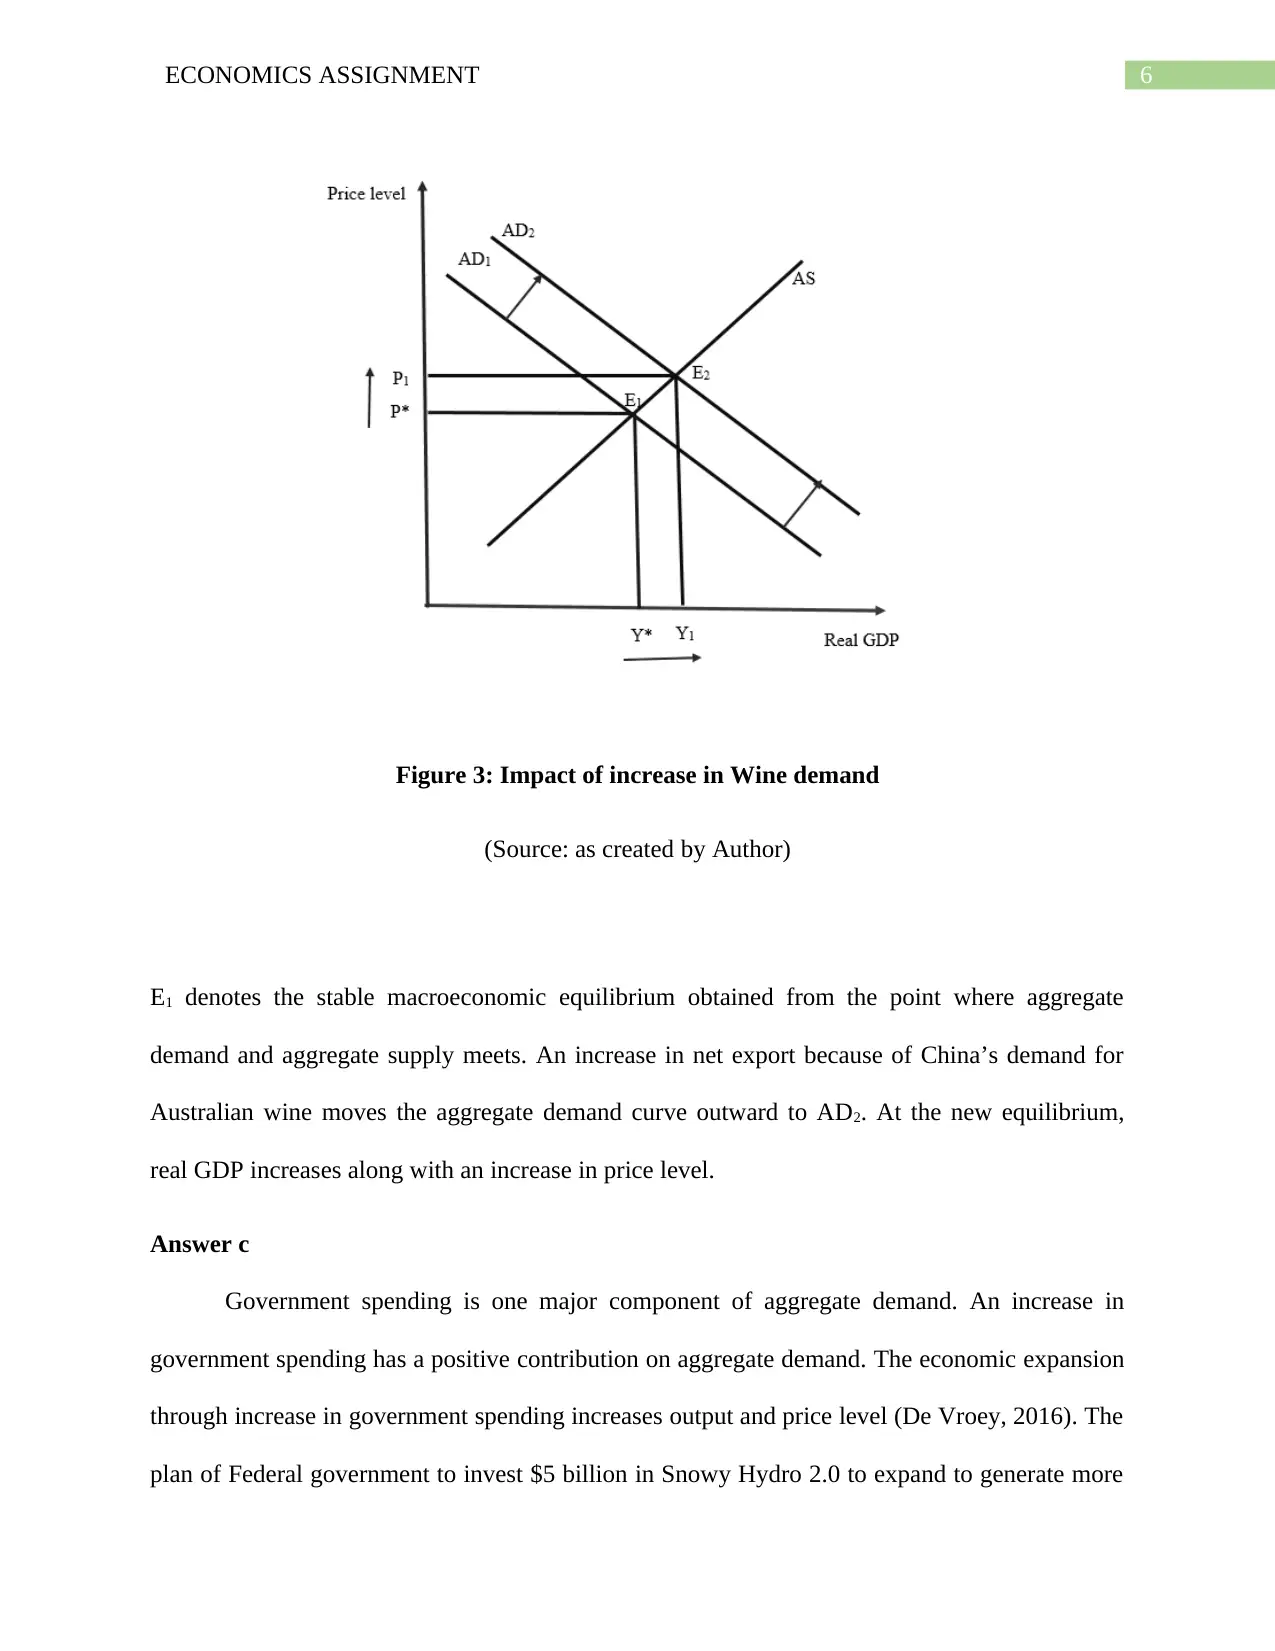
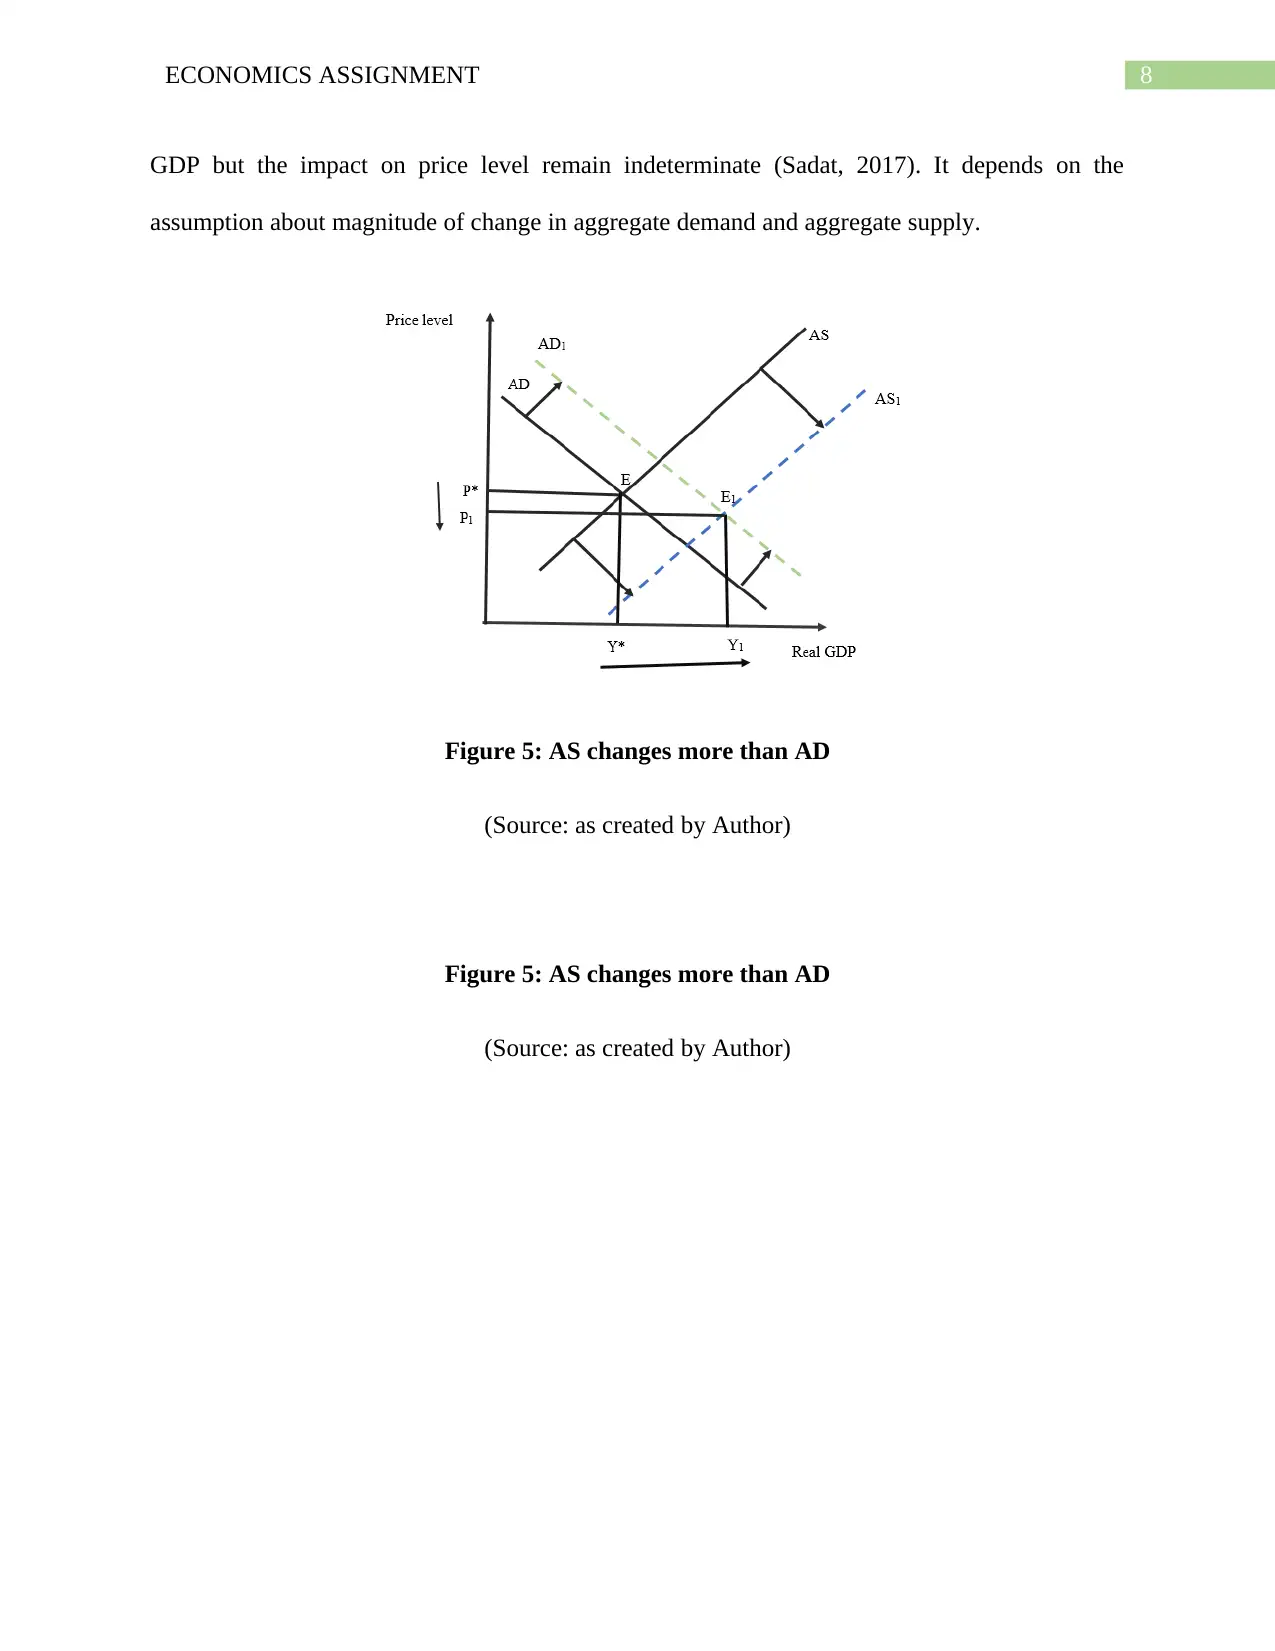
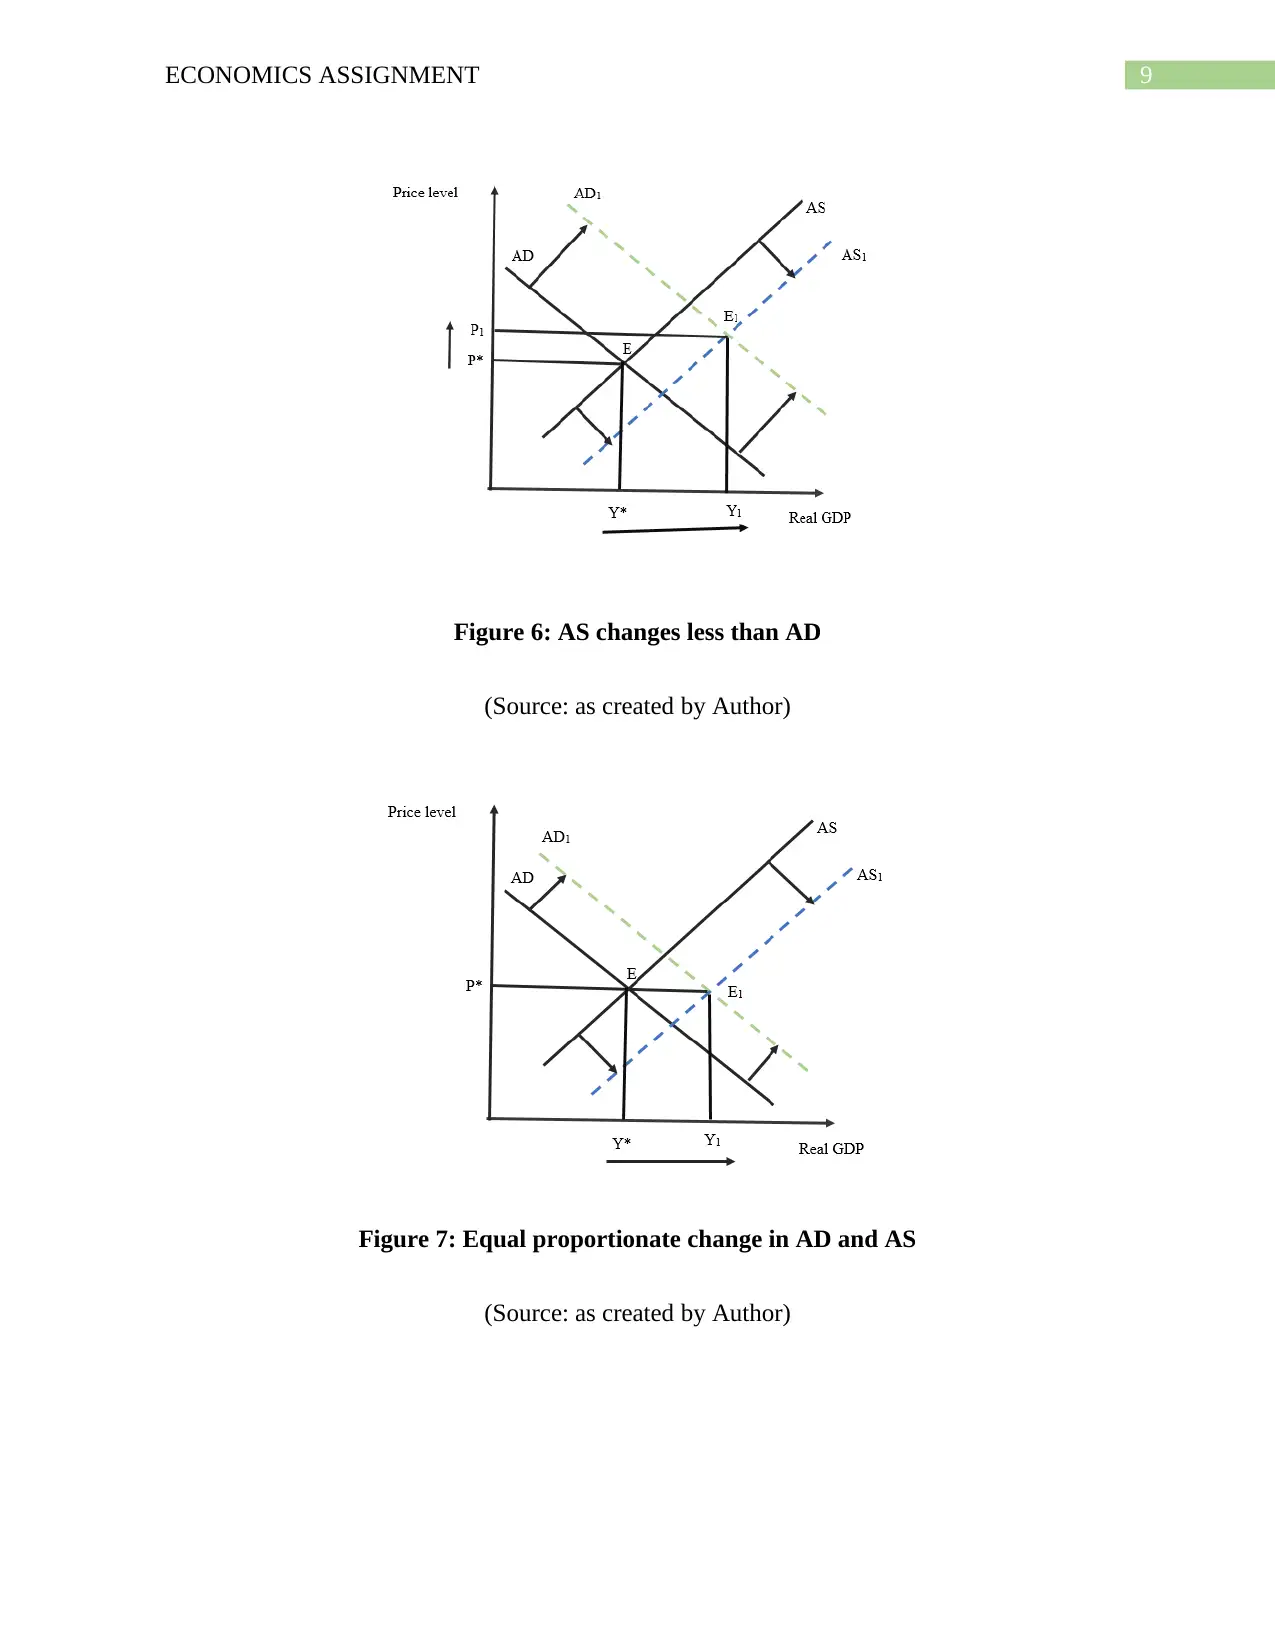
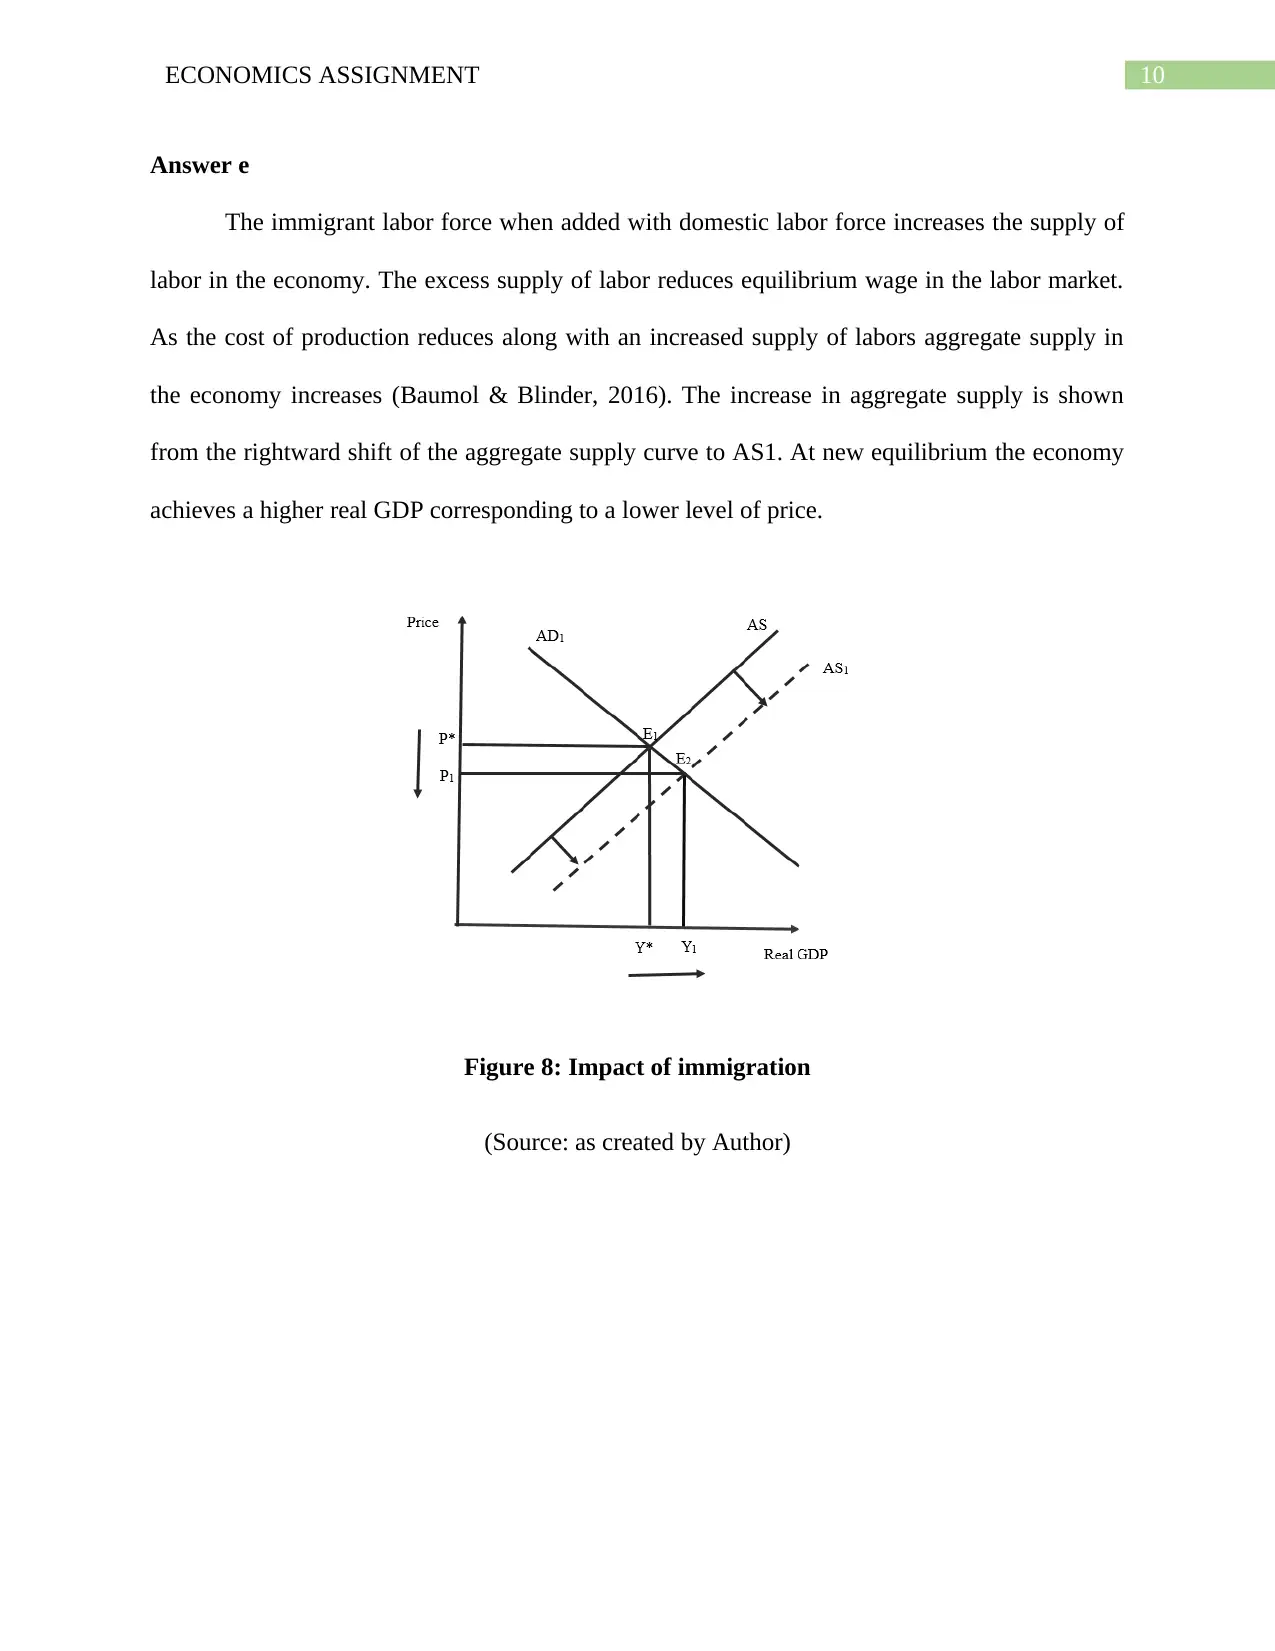
This economics assignment analyzes the macroeconomic performance of a nation, focusing on unemployment and inflation as key indicators. It explores the relationship between these variables, including the Phillips curve and the Reserve Bank of Australia's inflation target. The assignment uses the aggregate demand and aggregate supply (AD-AS) model to examine the impacts of various economic events, such as tariff impositions, changes in export demand, government spending, oil price fluctuations, and immigration, on real GDP and price levels. The analysis includes graphical representations and explanations of how these factors influence macroeconomic equilibrium. The assignment provides a comprehensive overview of macroeconomic principles and their practical application in analyzing economic scenarios.

Running Head: ECONOMICS ASSIGNMENT
Economic Assignment
Name of the Student
Name of the University
Course ID
Economic Assignment
Name of the Student
Name of the University
Course ID
Paraphrase This Document
Need a fresh take? Get an instant paraphrase of this document with our AI Paraphraser

1ECONOMICS ASSIGNMENT
Table of Contents
Answer 1..........................................................................................................................................2
Answer 2..........................................................................................................................................4
Answer a......................................................................................................................................4
Answer b......................................................................................................................................5
Answer c......................................................................................................................................6
Answer d......................................................................................................................................7
Answer e....................................................................................................................................10
References......................................................................................................................................11

2ECONOMICS ASSIGNMENT
Answer 1
Among various indicators of macroeconomic performance of a nation unemployment and
inflation are the two vital indicators. One indicates the movement of price level and hence,
associated with cost of living. Other is an indicator of performance of labor market. Inflation is
the measure of percentage increase in the prevailing price level. Both demand and supply side
factors are responsible in the movement of price level. Inflation resulted from demand side
pressure is known as demand-pull inflation while inflation from increased product cost or supply
side shortage is termed as cost-push inflation (Coibion & Gorodnichenko, 2015). In general,
there can be observed an association between inflation and unemployment. Inflation and
unemployment is often found to move in opposite direction. The trade-off between
unemployment and inflation is theoretically modeled with Phillips curve.
In case of Australia Reserve Bank of Australia aims to keep the inflation rate at a targeted
level of 2%. The Australian government is also concerned about prevailing unemployment and
takes measures to maintain unemployment rate as low as possible. The figure below represents
trend in inflation in unemployment rate of Australia for a considerable long period ranging from
2001 to 2016.
⊘ This is a preview!⊘
Do you want full access?
Subscribe today to unlock all pages.

Trusted by 1+ million students worldwide

3ECONOMICS ASSIGNMENT
4 4.5 5 5.5 6 6.5 7
1
1.5
2
2.5
3
3.5
4
4.5
5
f(x) = − 0.15400701871836 x + 3.51940971372956
R² = 0.0138640768243962
Infl ati on and Unemployment
Unemployment
Inflation
Figure 1: Relation between inflation and unemployment
(Source: abs.gov.au, 2018)
Scatter plot is the most convenient way to graphically explore the relationship between
two variables. In the above figure inflation is measured on the vertical axis and the horizontal
axis measures unemployment. The points are though highly scattered between range of inflation
and unemployment there is in general a negative trend relation between the two indicators. The
coefficient of unemployment in the fitted trend equation is obtained as -0.15. This has the
implication that with 1 percent fall in unemployment, inflation will increase by 0.15 percent.
Therefore, measures taken to reduce unemployment comes with the consequence of some
increase in the price level (Owyang, 2015).
This trade-off between unemployment and inflation can be explained with the help of
Phillips curve. Economist A.W. Phillips first tested the relation between unemployment and
inflation using the data of United Kingdom for a period extending from 1861 to 1957. The study
found that inflation can possibly explained with movement of unemployment level and change in
Paraphrase This Document
Need a fresh take? Get an instant paraphrase of this document with our AI Paraphraser

4ECONOMICS ASSIGNMENT
the unemployment rate. The result of the Phillip’s study can be summarized by a simple
hypothesis that inflation increases with a fall in unemployment rate and vice-versa. A low
unemployment means there is high demand for labor. High demand for labor creates an upward
pressure on wages. Labor being one of the crucial factor in production, the rise in cost of wages
lead to an increase price of final goods and services (Kumar & Orrenius, 2016). The high
unemployment on the other hand signifies low demand for labor. This by reducing wages
reduces cost of production and consequently there is a fall in price level and inflation. In
Australia a fall in unemployment rate does not increases inflation as RBA always stands to keep
the inflation within its targeted level.
Answer 2
Answer a
Real GDP and general price level in an economy is determined from the aggregate
demand and aggregate supply model. consumption, investment, government spending and new
export are the four important components of aggregate demand, Change in these components
lead to a change in aggregate demand. Changing condition in the factor market influence
aggregate supply. In the short run the aggregate demand curve slopes downward while aggregate
supply curve sloped upward (Baumol & Blinder, 2016). A tariff imposition by India on
Australia chickpea export has the consequence of raising the import cost of Australian chickpeas
in India. The increased import prices reduce the demand for chickpea import in India which is
reflected in a decline in chickpea export from Australia. Consequently, net export that export less
import declines causing aggregate demand (AD) to fall. As shown in figure 2, under this
circumstances AD shifts inwards reducing both price level and real GDP.

5ECONOMICS ASSIGNMENT
Figure 2: Impact of import tariff in AD-AS model
(Source: as created by Author)
Answer b
An increase in demand for Australian wine in China market increases export of wine
from Australia to China. The external demand of wine increases aggregate demand in Australia
through an increase in trade balance (Maurice & Thomas, 2015). As net export increases the
aggregate demand curve shifts to the right. The scenario can be modeled with help of the
following figure
⊘ This is a preview!⊘
Do you want full access?
Subscribe today to unlock all pages.

Trusted by 1+ million students worldwide

6ECONOMICS ASSIGNMENT
Figure 3: Impact of increase in Wine demand
(Source: as created by Author)
E1 denotes the stable macroeconomic equilibrium obtained from the point where aggregate
demand and aggregate supply meets. An increase in net export because of China’s demand for
Australian wine moves the aggregate demand curve outward to AD2. At the new equilibrium,
real GDP increases along with an increase in price level.
Answer c
Government spending is one major component of aggregate demand. An increase in
government spending has a positive contribution on aggregate demand. The economic expansion
through increase in government spending increases output and price level (De Vroey, 2016). The
plan of Federal government to invest $5 billion in Snowy Hydro 2.0 to expand to generate more
Paraphrase This Document
Need a fresh take? Get an instant paraphrase of this document with our AI Paraphraser

7ECONOMICS ASSIGNMENT
electricity power capacity thus increases aggregate demand through increases in public spending
or investment. The resulted increase in aggregate demand makes a parallel shift in aggregate
demand to the right. The economy now reaches to a new equilibrium at a higher price and output
level.
Figure 4: Impact of increase in government spending
(Source: as created by Author)
Answer d
Oil is used as one primary input in many industries. A fall in price of oil reduces the
overall import cost of Australia. Given the imported oil demand, a fall in price positively
influences trade balance with an increase in aggregate demand. The industries using oil as a
primary input now faces a lower price of oil and hence a lower cost of production. The fall in oil
price thus increases aggregate supply through output expansion by business. The simultaneous
change in aggregate demand and aggregate supply though have a clear impact of raising real

8ECONOMICS ASSIGNMENT
GDP but the impact on price level remain indeterminate (Sadat, 2017). It depends on the
assumption about magnitude of change in aggregate demand and aggregate supply.
Figure 5: AS changes more than AD
(Source: as created by Author)
Figure 5: AS changes more than AD
(Source: as created by Author)
GDP but the impact on price level remain indeterminate (Sadat, 2017). It depends on the
assumption about magnitude of change in aggregate demand and aggregate supply.
Figure 5: AS changes more than AD
(Source: as created by Author)
Figure 5: AS changes more than AD
(Source: as created by Author)
⊘ This is a preview!⊘
Do you want full access?
Subscribe today to unlock all pages.

Trusted by 1+ million students worldwide

9ECONOMICS ASSIGNMENT
Figure 6: AS changes less than AD
(Source: as created by Author)
Figure 7: Equal proportionate change in AD and AS
(Source: as created by Author)
Figure 6: AS changes less than AD
(Source: as created by Author)
Figure 7: Equal proportionate change in AD and AS
(Source: as created by Author)
Paraphrase This Document
Need a fresh take? Get an instant paraphrase of this document with our AI Paraphraser

10ECONOMICS ASSIGNMENT
Answer e
The immigrant labor force when added with domestic labor force increases the supply of
labor in the economy. The excess supply of labor reduces equilibrium wage in the labor market.
As the cost of production reduces along with an increased supply of labors aggregate supply in
the economy increases (Baumol & Blinder, 2016). The increase in aggregate supply is shown
from the rightward shift of the aggregate supply curve to AS1. At new equilibrium the economy
achieves a higher real GDP corresponding to a lower level of price.
Figure 8: Impact of immigration
(Source: as created by Author)

11ECONOMICS ASSIGNMENT
References
6202.0 - Labour Force, Australia, Mar 2018. (2018). Retrieved from
http://www.abs.gov.au/ausstats/abs@.nsf/mf/6202.0?opendocument&ref=HPKI
Baumol, W. J., & Blinder, A. S. (2016). Principles of Macroeconomics. Cengage Learning.
Coibion, O., & Gorodnichenko, Y. (2015). Is the Phillips curve alive and well after all? Inflation
expectations and the missing disinflation. American Economic Journal:
Macroeconomics, 7(1), 197-232.
De Vroey, M. (2016). A history of macroeconomics from Keynes to Lucas and beyond.
Cambridge University Press.
Kumar, A., & Orrenius, P. M. (2016). A closer look at the Phillips curve using state-level
data. Journal of Macroeconomics, 47, 84-102.
Maurice, S. C., & Thomas, C. (2015). Managerial Economics. McGraw-Hill Higher Education.
Owyang, M. (2015). Has the Phillips Curve Relationship Broken Down. St. Louis Fed On the
Economy.
Sadat, S. D. (2017). Rethinking Macroeconomics: An Introduction. International Journal of
Economics, Management and Accounting, 25(3), 635-639.
⊘ This is a preview!⊘
Do you want full access?
Subscribe today to unlock all pages.

Trusted by 1+ million students worldwide
1 out of 12
Related Documents

Your All-in-One AI-Powered Toolkit for Academic Success.
+13062052269
info@desklib.com
Available 24*7 on WhatsApp / Email
Unlock your academic potential
Copyright © 2020–2025 A2Z Services. All Rights Reserved. Developed and managed by ZUCOL.