Macroeconomic Assignment: Stable Equilibrium in Global Economies
VerifiedAdded on 2020/05/28
|16
|1815
|408
Report
AI Summary
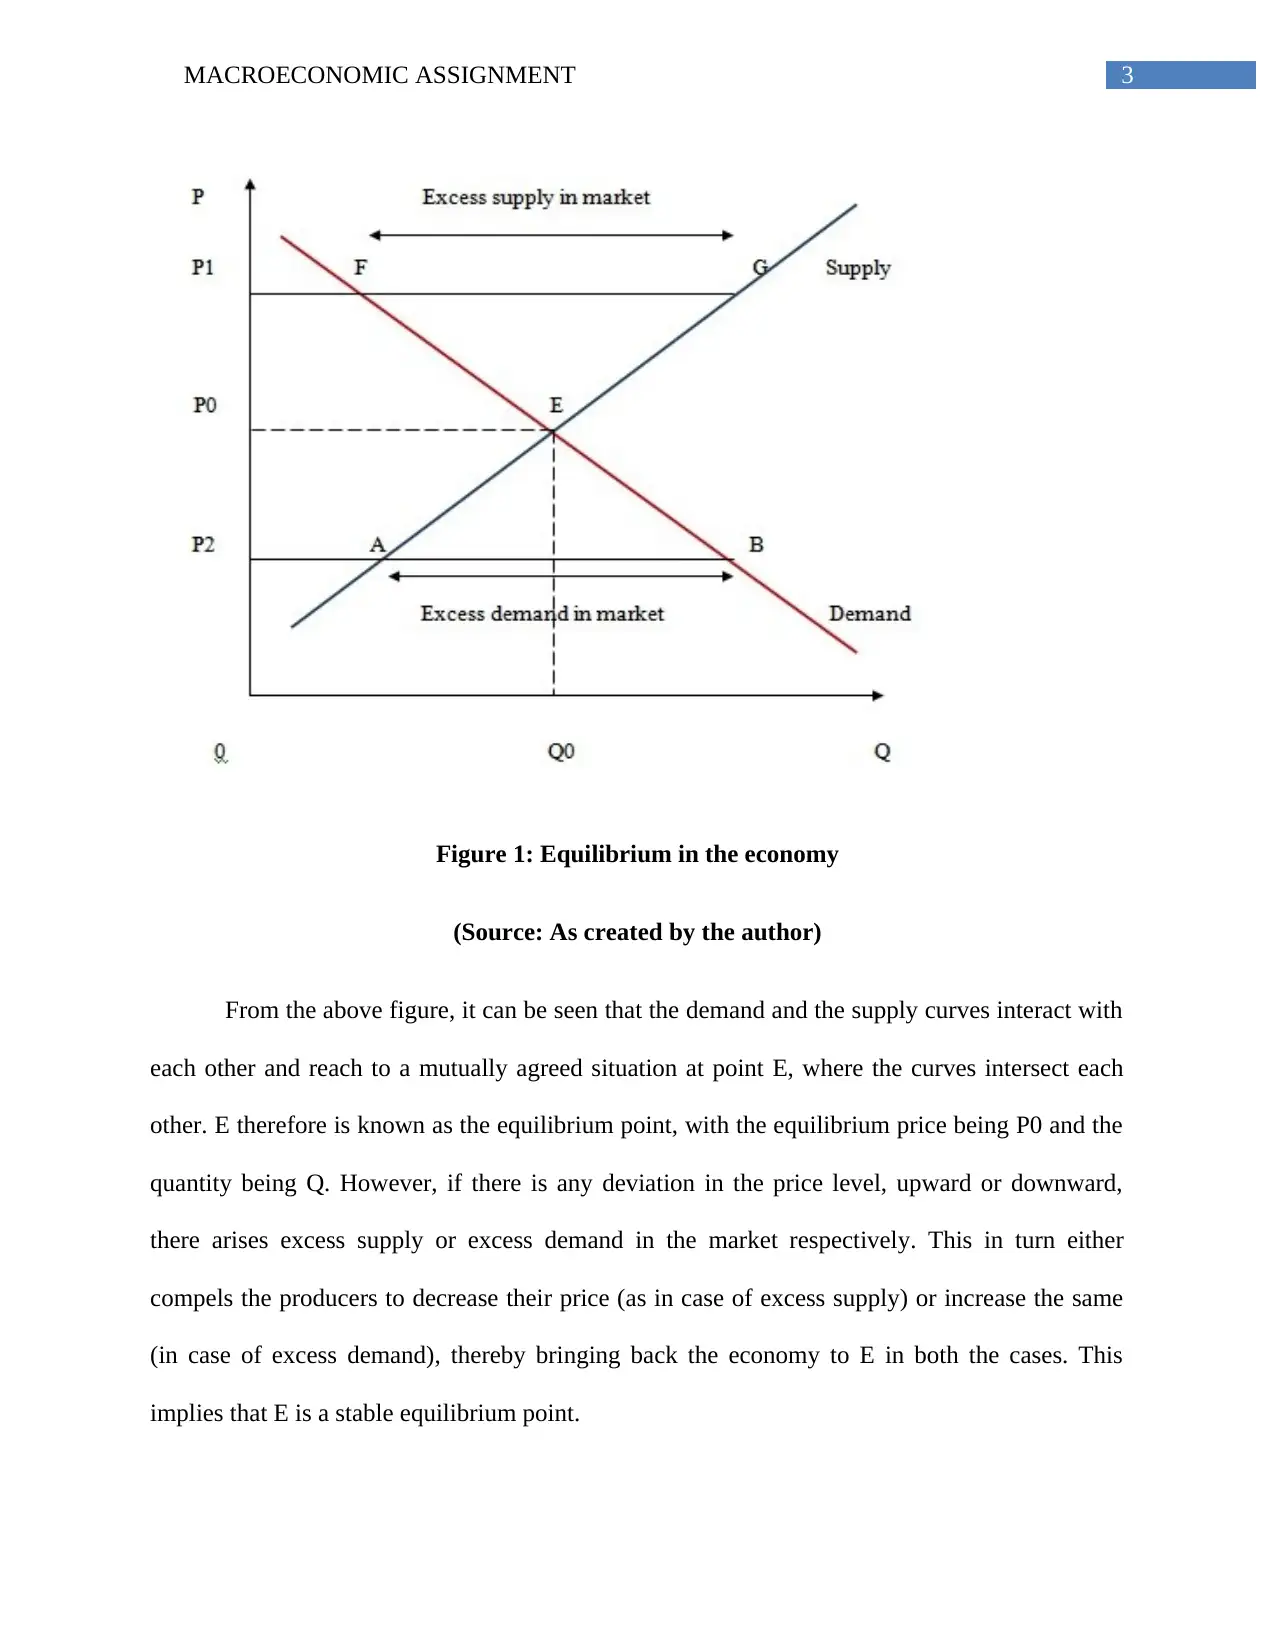
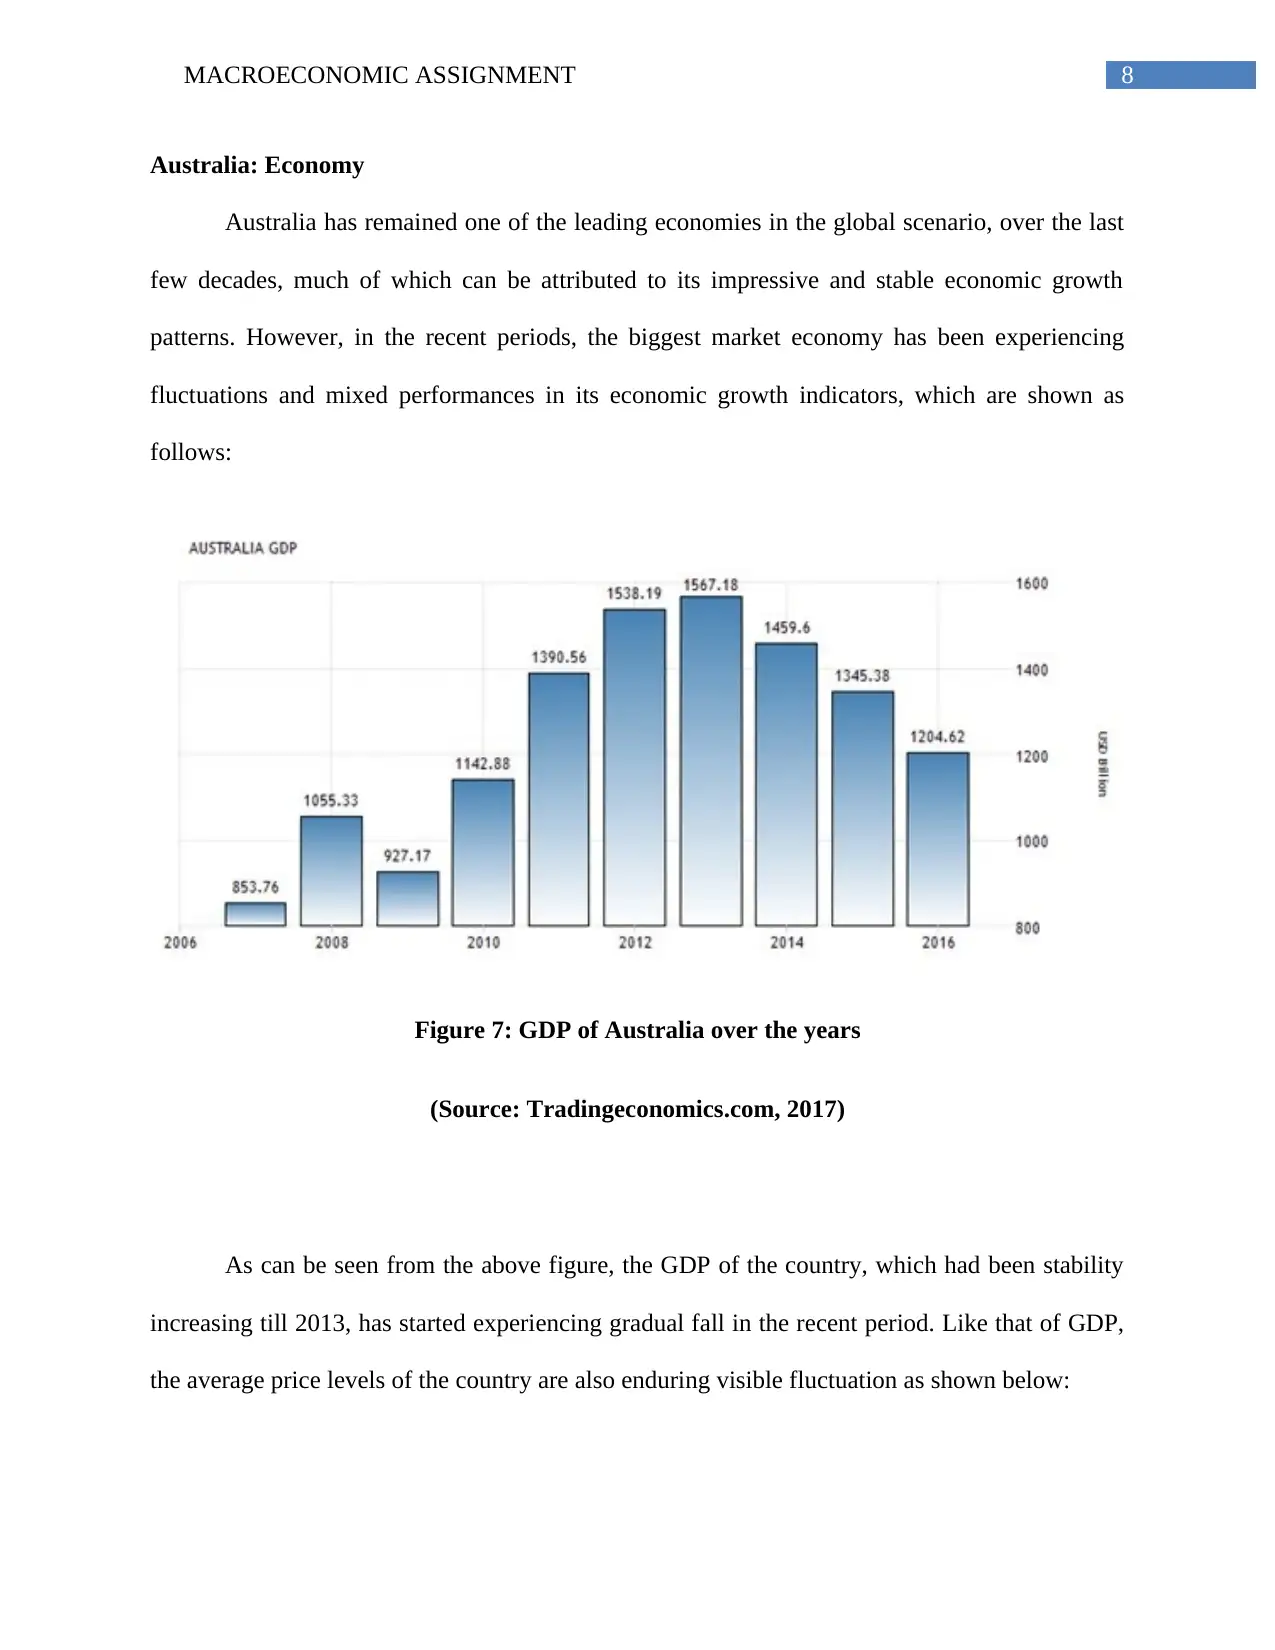
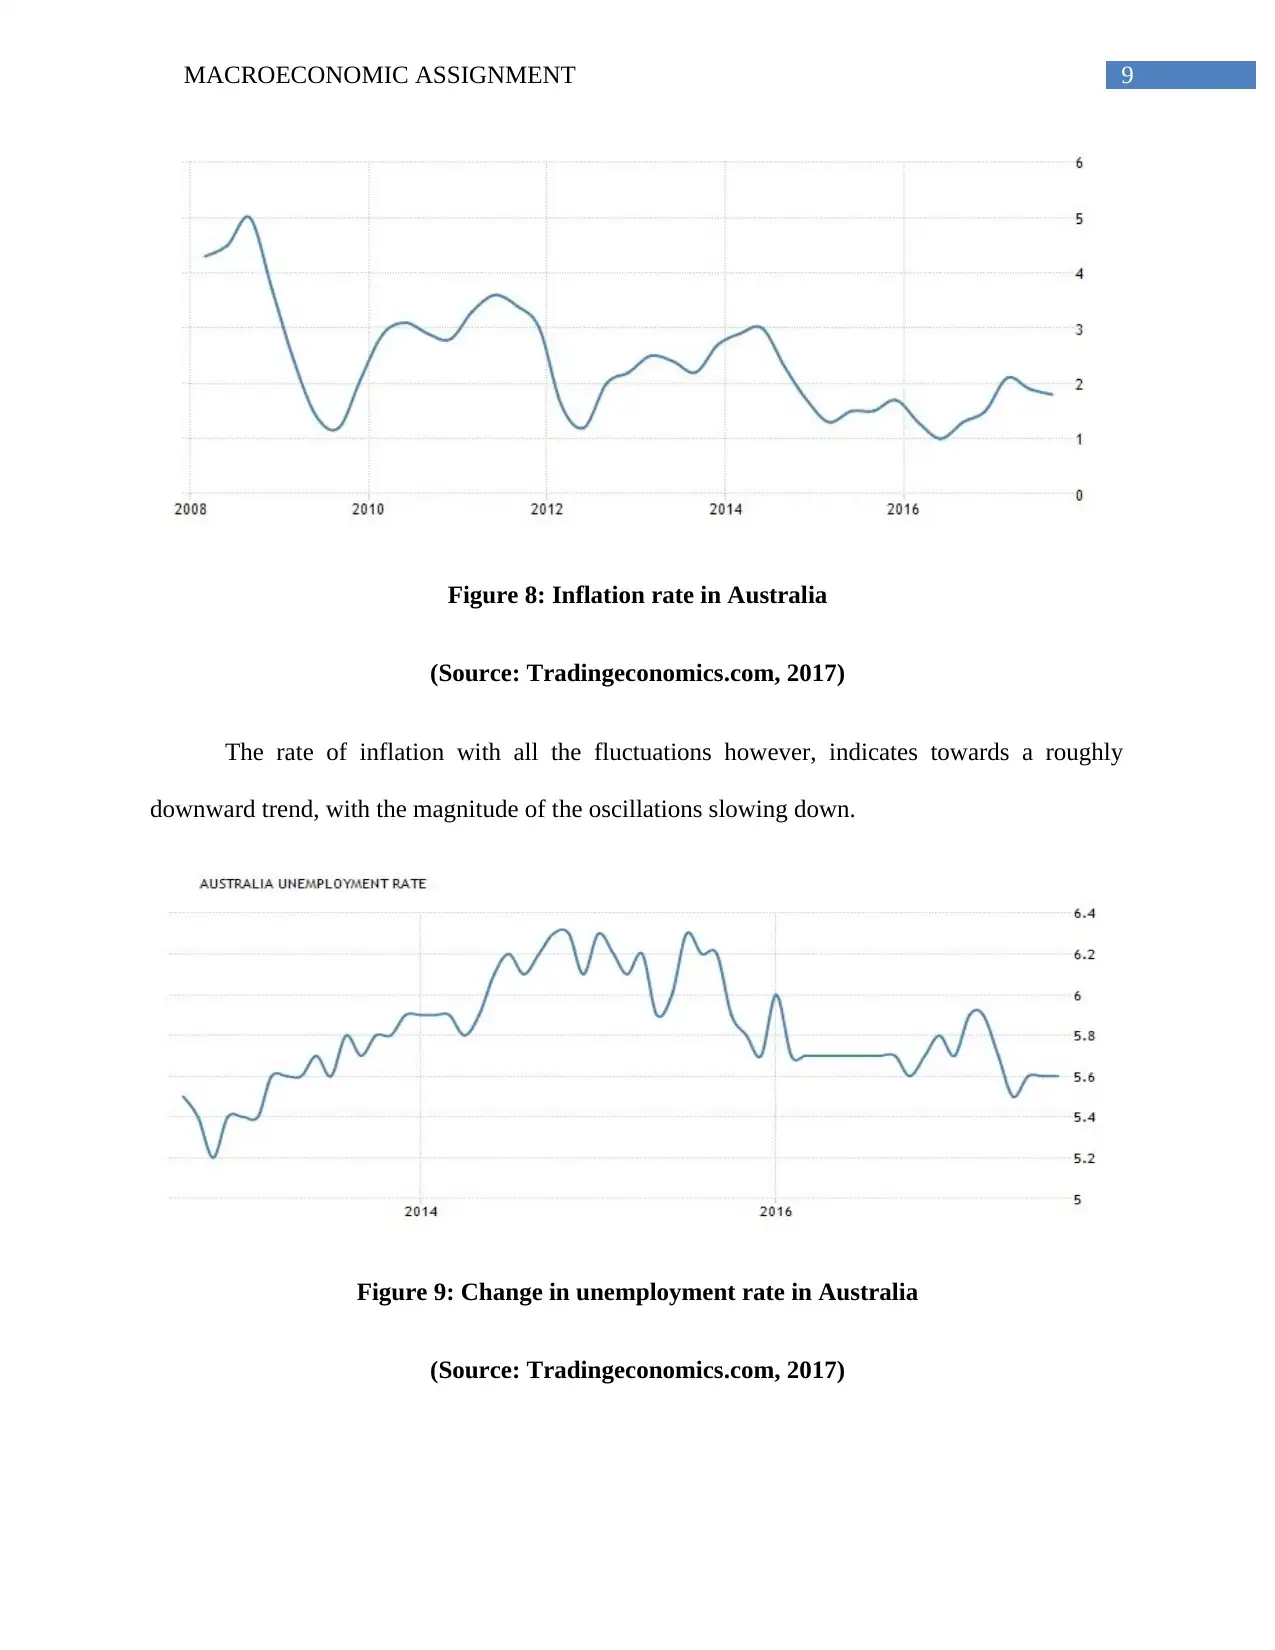
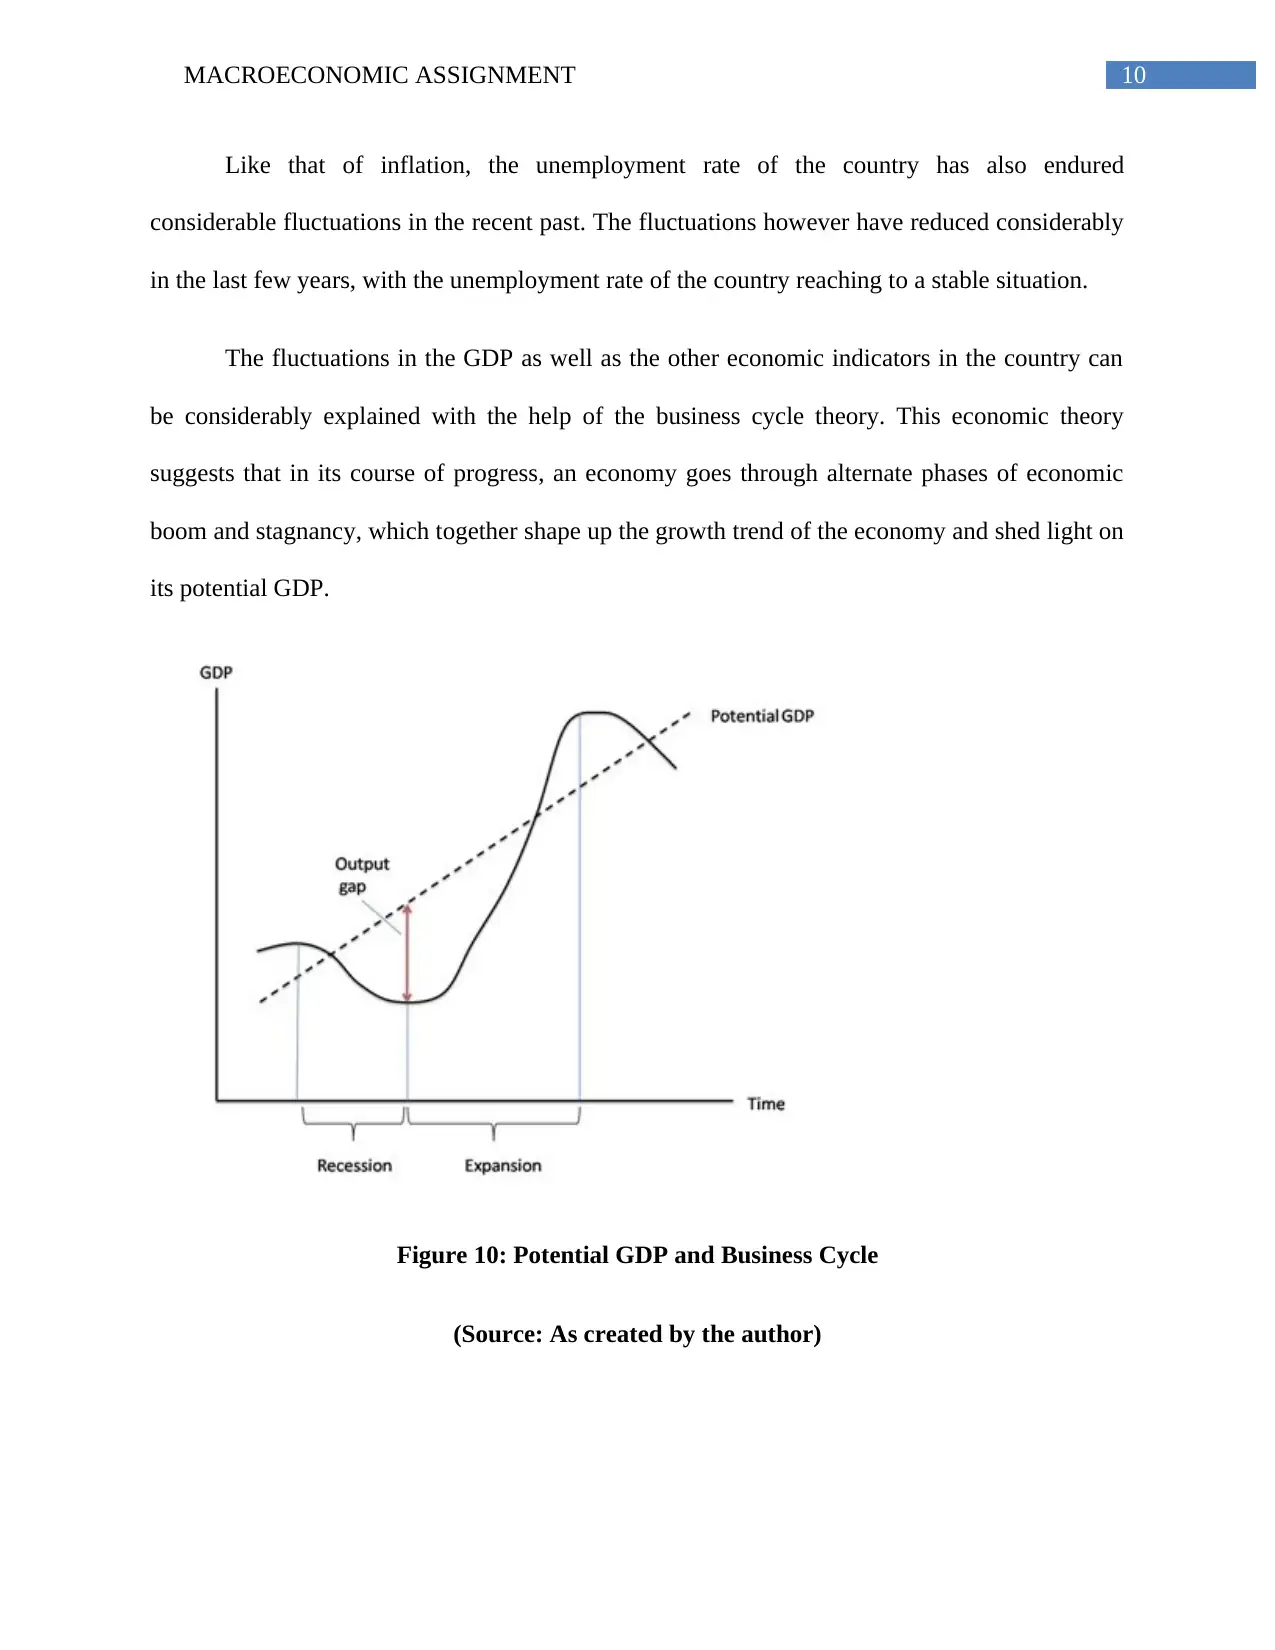
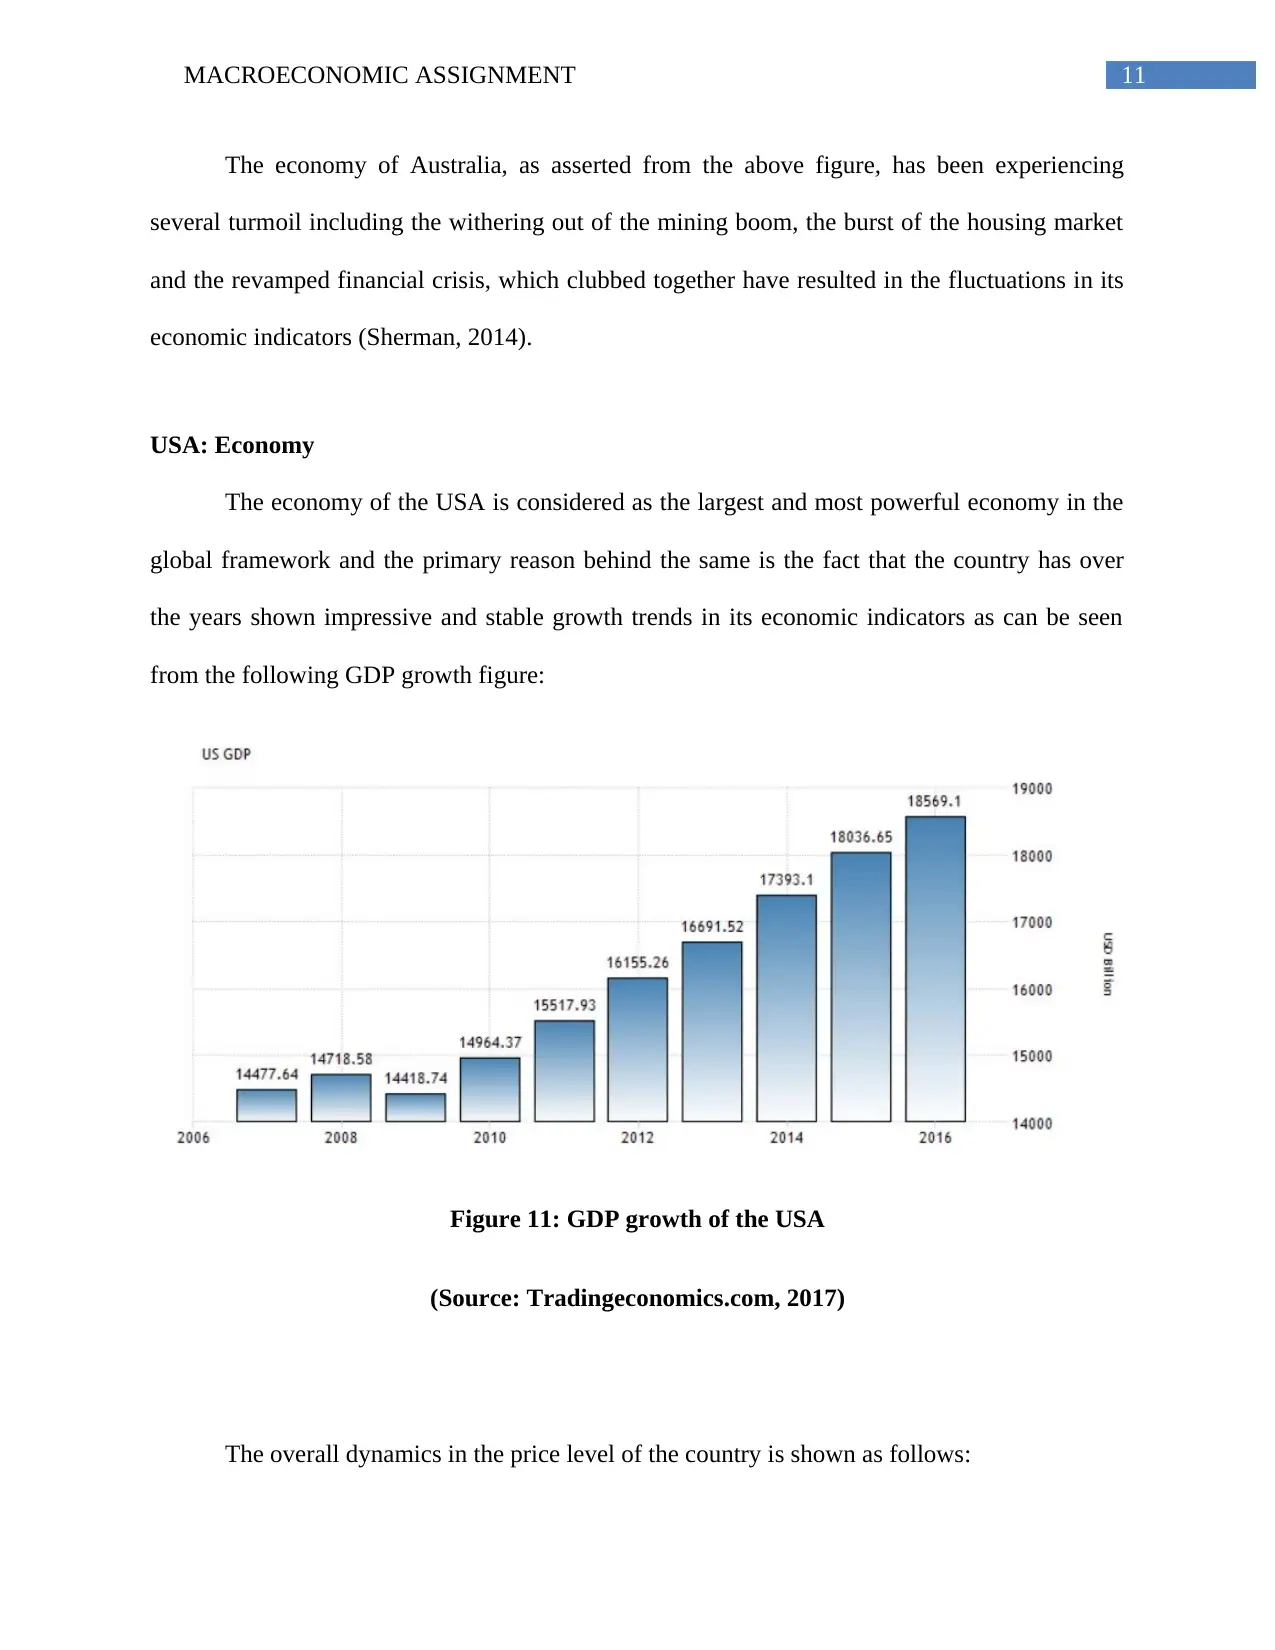
This macroeconomic assignment analyzes the concept of stable equilibrium in economics, examining how economies return to equilibrium after disruptions. The report focuses on the current economic situations of China, Australia, and the USA. It explores key economic indicators such as GDP, inflation rates, and unemployment figures for each country, using data from Tradingeconomics.com to illustrate trends and fluctuations. The analysis includes graphical representations to support the findings and discusses the stability of each economy, considering short-run and long-run perspectives. The report references economic theories like the business cycle to explain the observed patterns in Australia. Ultimately, the assignment assesses whether these three major economies are approaching or maintaining a state of stable equilibrium, providing insights into their respective economic performances and future prospects. This assignment is available on Desklib, a platform offering study resources for students.

Running head: MACROECONOMIC ASSIGNMENT
Macroeconomic Assignment
Name of the Student
Name of the University
Author Note
Macroeconomic Assignment
Name of the Student
Name of the University
Author Note
Paraphrase This Document
Need a fresh take? Get an instant paraphrase of this document with our AI Paraphraser

1MACROECONOMIC ASSIGNMENT
Table of Contents
Introduction......................................................................................................................................2
Stable Equilibrium in Economics....................................................................................................2
Stability in Macroeconomic perspective: Short run and Long run..................................................4
China: Economy..............................................................................................................................5
Australia: Economy.........................................................................................................................8
USA: Economy..............................................................................................................................11
References......................................................................................................................................14

2MACROECONOMIC ASSIGNMENT
Introduction
In economics, market is defined to be the forum for interaction of the demand and supply
side agents, for the purpose of buying and selling of various goods and services. The term
“Equilibrium”, thus, in the economic sense, represents the situation where the demand and the
supply side players reach to a mutually agreed position regarding the price and quantity of
product or service the concerned market is dealing with, such that none of the players from either
side has any incentive to deviate (Baumol & Blinder, 2015). Equilibrium is said to be stable if
even after deviation from the same due to any exogenous force, the economy again comes back
to the equilibrium situation with the help of its own dynamics. Taking this into consideration the
assignment tries to discuss the economic concept of stable equilibrium, thereby taking reference
of the current economies of Australia, China and the USA, analyzing the status of the
equilibrium (if any) prevailing in these economies.
Stable Equilibrium in Economics
As discussed above, the concept of equilibrium can be explained with the help of the
following figure, where the demand, the supply-side dynamics, and their mutual adjustments are
shown:
⊘ This is a preview!⊘
Do you want full access?
Subscribe today to unlock all pages.

Trusted by 1+ million students worldwide

3MACROECONOMIC ASSIGNMENT
Figure 1: Equilibrium in the economy
(Source: As created by the author)
From the above figure, it can be seen that the demand and the supply curves interact with
each other and reach to a mutually agreed situation at point E, where the curves intersect each
other. E therefore is known as the equilibrium point, with the equilibrium price being P0 and the
quantity being Q. However, if there is any deviation in the price level, upward or downward,
there arises excess supply or excess demand in the market respectively. This in turn either
compels the producers to decrease their price (as in case of excess supply) or increase the same
(in case of excess demand), thereby bringing back the economy to E in both the cases. This
implies that E is a stable equilibrium point.
Paraphrase This Document
Need a fresh take? Get an instant paraphrase of this document with our AI Paraphraser

4MACROECONOMIC ASSIGNMENT
The same, which is shown in a microeconomic sense, is also applicable for the
macroeconomic situations, which is explained in the following section.
Stability in Macroeconomic perspective: Short run and Long run
In the macroeconomic scenario, the demand side is represented by the aggregate demand curve
and the supply side is determined by the aggregate supply as macroeconomics deals with the
economy as a whole and not any discrete individual. The process of attaining equilibrium,
however, remains the same, that is through the process of mutual interactions of the demand and
the supply side dynamics (Nicholson & Snyder, 2014).
Figure 2: Stable Equilibrium in Macroeconomic perspective
(Source: As created by the author)

5MACROECONOMIC ASSIGNMENT
The above figure shows the short run adjustments of the demand and the supply curve.
However, as the economy progresses, the aggregate demand for goods and services keep on
increasing, which in turn results in the increase of the aggregate supply, such that the long run
aggregate supply curve in the concerned economy becomes vertical:
Figure 3: Derivation of the Long Run Supply Curve
(Source: As created by the author)
Keeping this into consideration, the following section of the assignment tries to analyze
the stability of the equilibriums of the countries in consideration.
China: Economy
The economy of China has been showing highly impressive traits in the overall aspects of
economic growth and is currently the second largest economy in the world in terms of the growth
of its GDP, which can be seen from the following figure:
⊘ This is a preview!⊘
Do you want full access?
Subscribe today to unlock all pages.

Trusted by 1+ million students worldwide

6MACROECONOMIC ASSIGNMENT
Figure 4: GDP of China over the last decade
(Source: Tradingeconomics.com, 2017)
Along with the consistently increasing GDP statistics, which can be seen from the above
figure, the country has also shown a significant fall in the unemployment scenario in the last few
years, which is also an indicator of increasing economic welfare:
Figure 5: China’s rate of Unemployment over the years
(Source: Tradingeconomics.com, 2017)
Paraphrase This Document
Need a fresh take? Get an instant paraphrase of this document with our AI Paraphraser

7MACROECONOMIC ASSIGNMENT
From the above figure, it is evident that after experiencing considerable fluctuations in its
rate of unemployment the country, in the last few years has been experiencing a stability in the
same.
Figure 6: Inflation Rate of China over the years
(Source: Tradingeconomics.com, 2017)
Like that of the unemployment rate, the inflation (which is measured by the Consumer
Price Index) of the country, is also observed to attain a stability with less fluctuations in the
recent period.
Therefore, from the above figures, it can be asserted that the country, in the last few
years, have been reaching to a stable state in terms of the major economic indicators, which in
turn, indicates that in the present situation, the economy of China is reaching a state of stable
equilibrium (Shambaugh, 2013).

8MACROECONOMIC ASSIGNMENT
Australia: Economy
Australia has remained one of the leading economies in the global scenario, over the last
few decades, much of which can be attributed to its impressive and stable economic growth
patterns. However, in the recent periods, the biggest market economy has been experiencing
fluctuations and mixed performances in its economic growth indicators, which are shown as
follows:
Figure 7: GDP of Australia over the years
(Source: Tradingeconomics.com, 2017)
As can be seen from the above figure, the GDP of the country, which had been stability
increasing till 2013, has started experiencing gradual fall in the recent period. Like that of GDP,
the average price levels of the country are also enduring visible fluctuation as shown below:
⊘ This is a preview!⊘
Do you want full access?
Subscribe today to unlock all pages.

Trusted by 1+ million students worldwide

9MACROECONOMIC ASSIGNMENT
Figure 8: Inflation rate in Australia
(Source: Tradingeconomics.com, 2017)
The rate of inflation with all the fluctuations however, indicates towards a roughly
downward trend, with the magnitude of the oscillations slowing down.
Figure 9: Change in unemployment rate in Australia
(Source: Tradingeconomics.com, 2017)
Paraphrase This Document
Need a fresh take? Get an instant paraphrase of this document with our AI Paraphraser

10MACROECONOMIC ASSIGNMENT
Like that of inflation, the unemployment rate of the country has also endured
considerable fluctuations in the recent past. The fluctuations however have reduced considerably
in the last few years, with the unemployment rate of the country reaching to a stable situation.
The fluctuations in the GDP as well as the other economic indicators in the country can
be considerably explained with the help of the business cycle theory. This economic theory
suggests that in its course of progress, an economy goes through alternate phases of economic
boom and stagnancy, which together shape up the growth trend of the economy and shed light on
its potential GDP.
Figure 10: Potential GDP and Business Cycle
(Source: As created by the author)

11MACROECONOMIC ASSIGNMENT
The economy of Australia, as asserted from the above figure, has been experiencing
several turmoil including the withering out of the mining boom, the burst of the housing market
and the revamped financial crisis, which clubbed together have resulted in the fluctuations in its
economic indicators (Sherman, 2014).
USA: Economy
The economy of the USA is considered as the largest and most powerful economy in the
global framework and the primary reason behind the same is the fact that the country has over
the years shown impressive and stable growth trends in its economic indicators as can be seen
from the following GDP growth figure:
Figure 11: GDP growth of the USA
(Source: Tradingeconomics.com, 2017)
The overall dynamics in the price level of the country is shown as follows:
⊘ This is a preview!⊘
Do you want full access?
Subscribe today to unlock all pages.

Trusted by 1+ million students worldwide
1 out of 16
Related Documents

Your All-in-One AI-Powered Toolkit for Academic Success.
+13062052269
info@desklib.com
Available 24*7 on WhatsApp / Email
Unlock your academic potential
© 2024 | Zucol Services PVT LTD | All rights reserved.