Macroeconomic Indicators and Performance Analysis: Australia
VerifiedAdded on 2020/05/16
|17
|3641
|103
Report
AI Summary
This report provides a comprehensive macroeconomic analysis of Australia's economy from 1990 to 2015. It examines the relationships between real GDP and various economic indicators, including unemployment rate, inflation rate, cash rate, exchange rate, and net exports. The study uses statistical data and correlation analysis to interpret the trends and inter-relationships of these variables. The report explores the impact of these factors on the Australian economy, discussing the implications of economic policies. The analysis includes an overview of the Australian economy, a detailed evaluation of its macroeconomic performance, discussions on inflation, unemployment, monetary policy, and future economic outlook. The report concludes with a summary of the key findings and their significance in understanding Australia's economic dynamics.
Running head: MACROECONOMIC PERFORMANCE: AUSTRALIA
Macroeconomic Performance: Australia
Name of the Student
Name of the University
Author Note
Macroeconomic Performance: Australia
Name of the Student
Name of the University
Author Note
Paraphrase This Document
Need a fresh take? Get an instant paraphrase of this document with our AI Paraphraser
1MACROECONOMIC INDICATORS: AUSTRALIA
Executive Summary
One of the dominating economies in the global framework is the economy of Australia,
which with its impressive economic growth patterns and stable performances of almost all the
economic indicators, over the years, has prospered hugely and attained economic sustainability
and productive efficiency in many sectors, including its booming industrial and commercial
sector. However, over the years, the economy has had its share of fluctuations and turmoil,
which has shaped up the economy as it is today. The report tries to analyze these fluctuations and
the relation between the different economic variables and their causal factors, by collecting the
relevant economic data and interpreting the same with the help of the economic theories.
2MACROECONOMIC INDICATORS: AUSTRALIA
Table of Contents
Introduction......................................................................................................................................3
A) Economy of Australia: Macroeconomic Evaluation..................................................................3
1. Real GDP and Unemployment Rate........................................................................................4
2. Real GDP growth rate and inflation rate.................................................................................6
3. Real GDP and the cash rate.....................................................................................................8
4. Growth rate of Real GDP and exchange rate...........................................................................9
5. Real GDP growth rate and net exports..................................................................................10
B) Inflation and Unemployment....................................................................................................12
C) Contractionary Monetary Policy Framework...........................................................................13
D) Future Outlook of the economy................................................................................................14
Conclusion.....................................................................................................................................14
References......................................................................................................................................15
⊘ This is a preview!⊘
Do you want full access?
Subscribe today to unlock all pages.
Trusted by 1+ million students worldwide
3MACROECONOMIC INDICATORS: AUSTRALIA
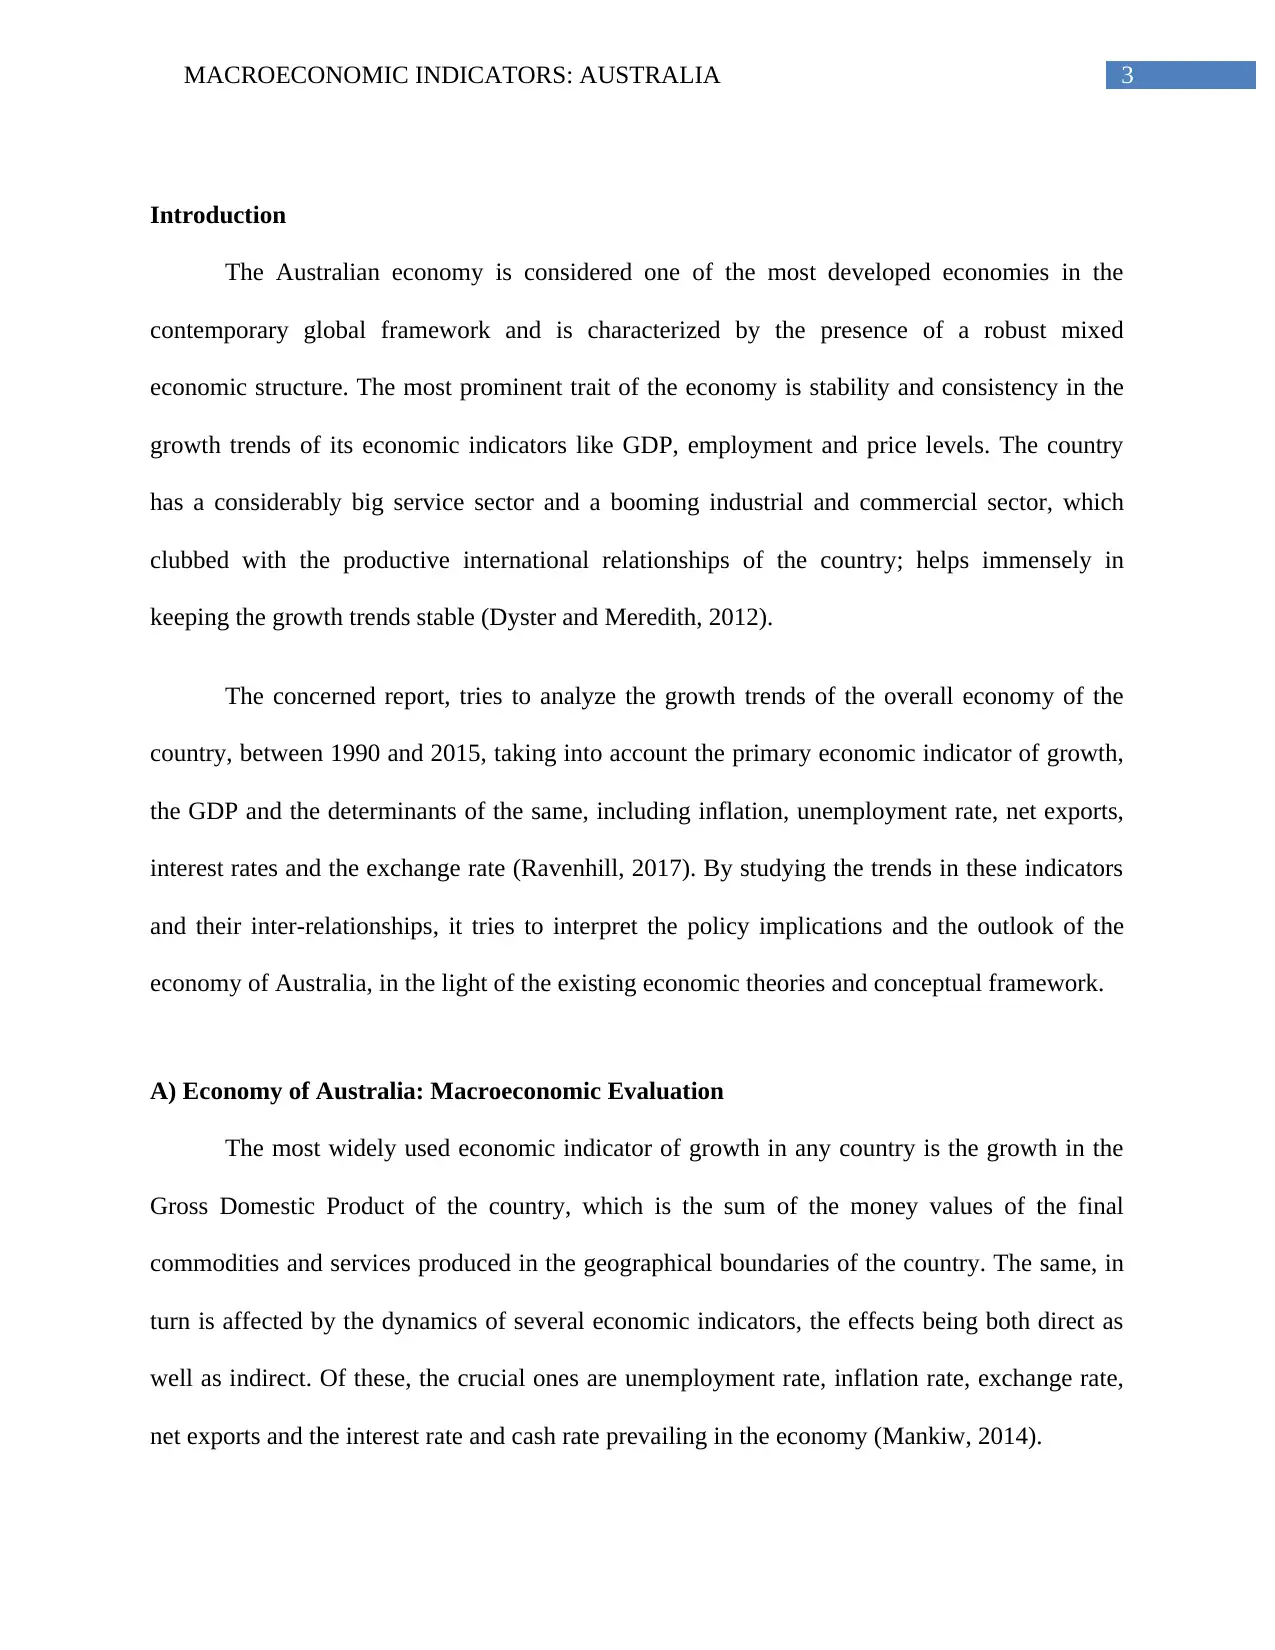
Introduction
The Australian economy is considered one of the most developed economies in the
contemporary global framework and is characterized by the presence of a robust mixed
economic structure. The most prominent trait of the economy is stability and consistency in the
growth trends of its economic indicators like GDP, employment and price levels. The country
has a considerably big service sector and a booming industrial and commercial sector, which
clubbed with the productive international relationships of the country; helps immensely in
keeping the growth trends stable (Dyster and Meredith, 2012).
The concerned report, tries to analyze the growth trends of the overall economy of the
country, between 1990 and 2015, taking into account the primary economic indicator of growth,
the GDP and the determinants of the same, including inflation, unemployment rate, net exports,
interest rates and the exchange rate (Ravenhill, 2017). By studying the trends in these indicators
and their inter-relationships, it tries to interpret the policy implications and the outlook of the
economy of Australia, in the light of the existing economic theories and conceptual framework.
A) Economy of Australia: Macroeconomic Evaluation
The most widely used economic indicator of growth in any country is the growth in the
Gross Domestic Product of the country, which is the sum of the money values of the final
commodities and services produced in the geographical boundaries of the country. The same, in
turn is affected by the dynamics of several economic indicators, the effects being both direct as
well as indirect. Of these, the crucial ones are unemployment rate, inflation rate, exchange rate,
net exports and the interest rate and cash rate prevailing in the economy (Mankiw, 2014).
Paraphrase This Document
Need a fresh take? Get an instant paraphrase of this document with our AI Paraphraser
4MACROECONOMIC INDICATORS: AUSTRALIA
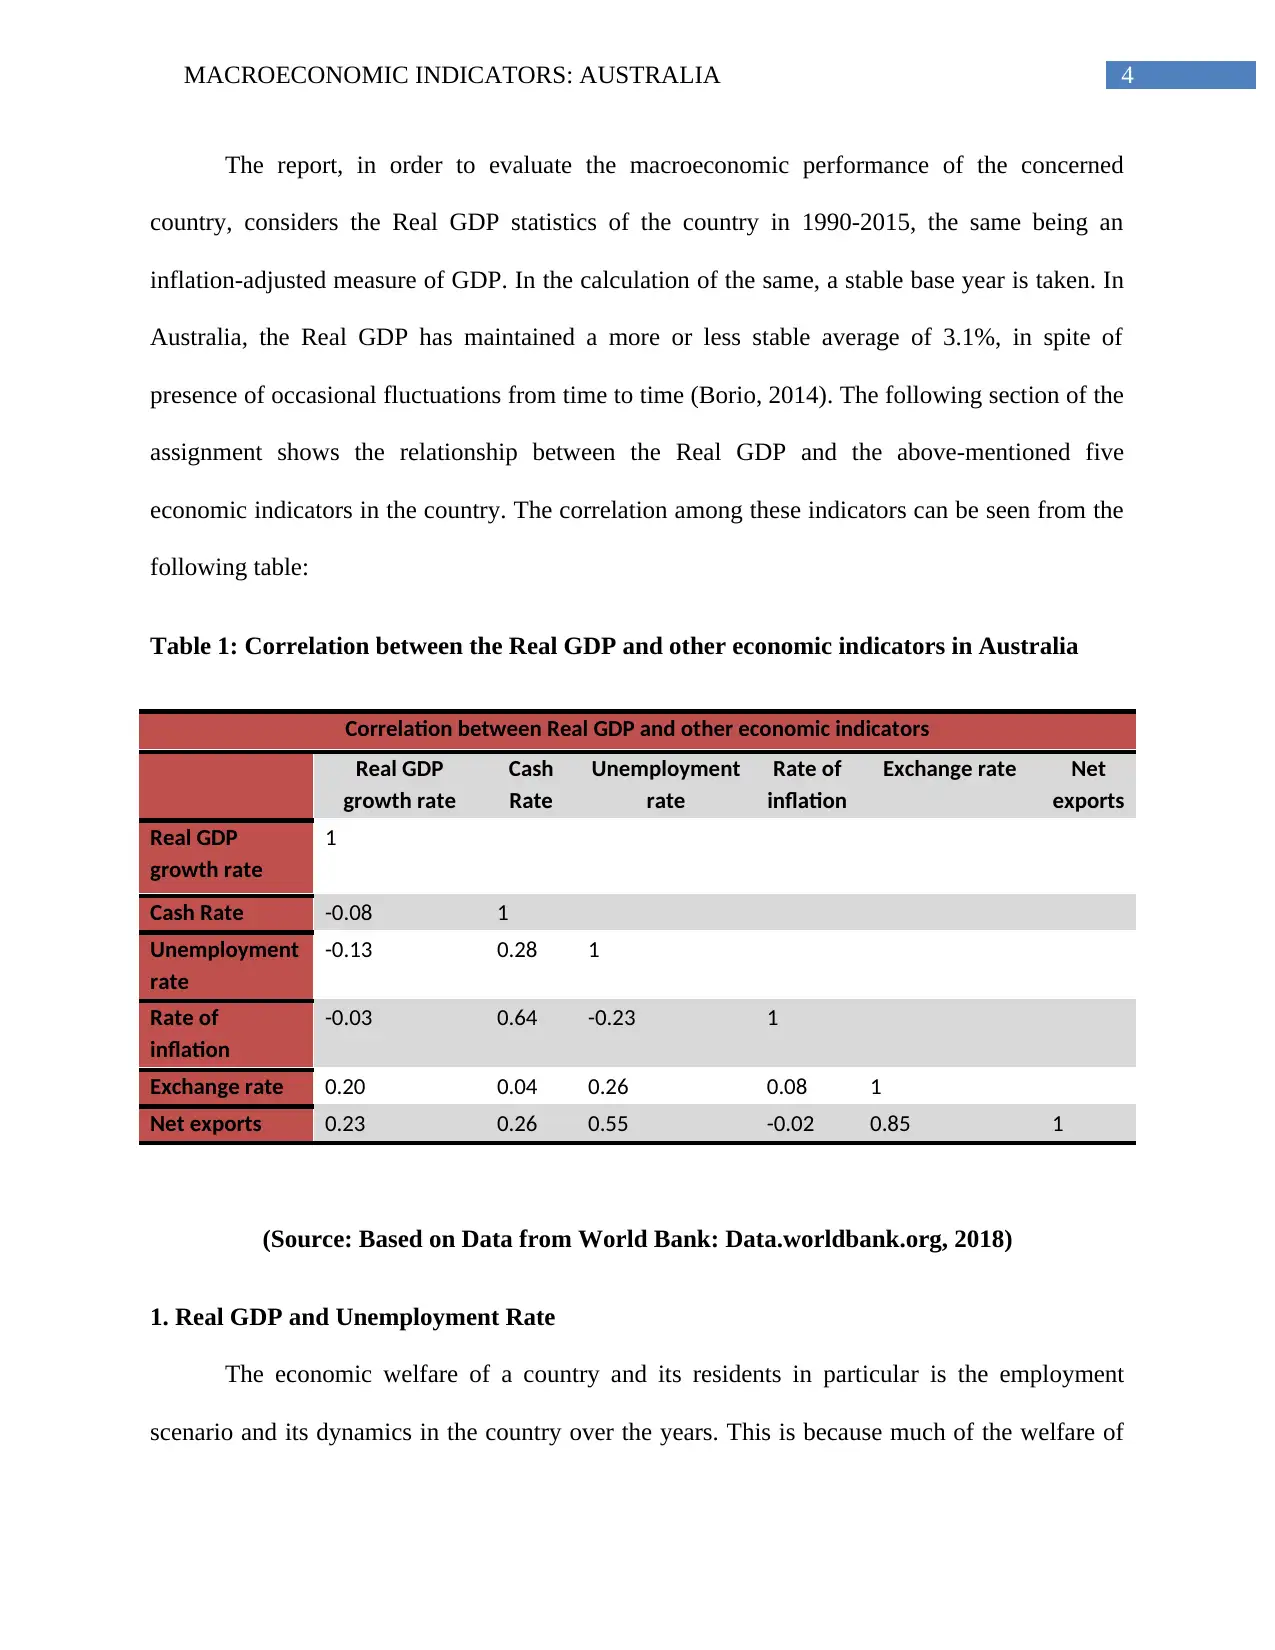
The report, in order to evaluate the macroeconomic performance of the concerned
country, considers the Real GDP statistics of the country in 1990-2015, the same being an
inflation-adjusted measure of GDP. In the calculation of the same, a stable base year is taken. In
Australia, the Real GDP has maintained a more or less stable average of 3.1%, in spite of
presence of occasional fluctuations from time to time (Borio, 2014). The following section of the
assignment shows the relationship between the Real GDP and the above-mentioned five
economic indicators in the country. The correlation among these indicators can be seen from the
following table:
Table 1: Correlation between the Real GDP and other economic indicators in Australia
Correlation between Real GDP and other economic indicators
Real GDP
growth rate
Cash
Rate
Unemployment
rate
Rate of
inflation
Exchange rate Net
exports
Real GDP
growth rate
1
Cash Rate -0.08 1
Unemployment
rate
-0.13 0.28 1
Rate of
inflation
-0.03 0.64 -0.23 1
Exchange rate 0.20 0.04 0.26 0.08 1
Net exports 0.23 0.26 0.55 -0.02 0.85 1
(Source: Based on Data from World Bank: Data.worldbank.org, 2018)
1. Real GDP and Unemployment Rate
The economic welfare of a country and its residents in particular is the employment
scenario and its dynamics in the country over the years. This is because much of the welfare of
5MACROECONOMIC INDICATORS: AUSTRALIA
people and prosperity of the economy depends on the income in hand and purchasing powers of
the residents. In this context, the rate of unemployment in the concerned country has been
moderately stable over the concerned period, with the average rate hovering around 6.8%.
However, there has been occasional fluctuations in the same, the highest being 11% (1994) and
the lowest 4.4% (2008). In general, with an increase in GDP, productivity and job creations in a
country are expected to increase, which indicates towards the negative relationship between the
GDP and the rate of unemployment in any country (Mavromaras, Sloane and Wei, 2015).
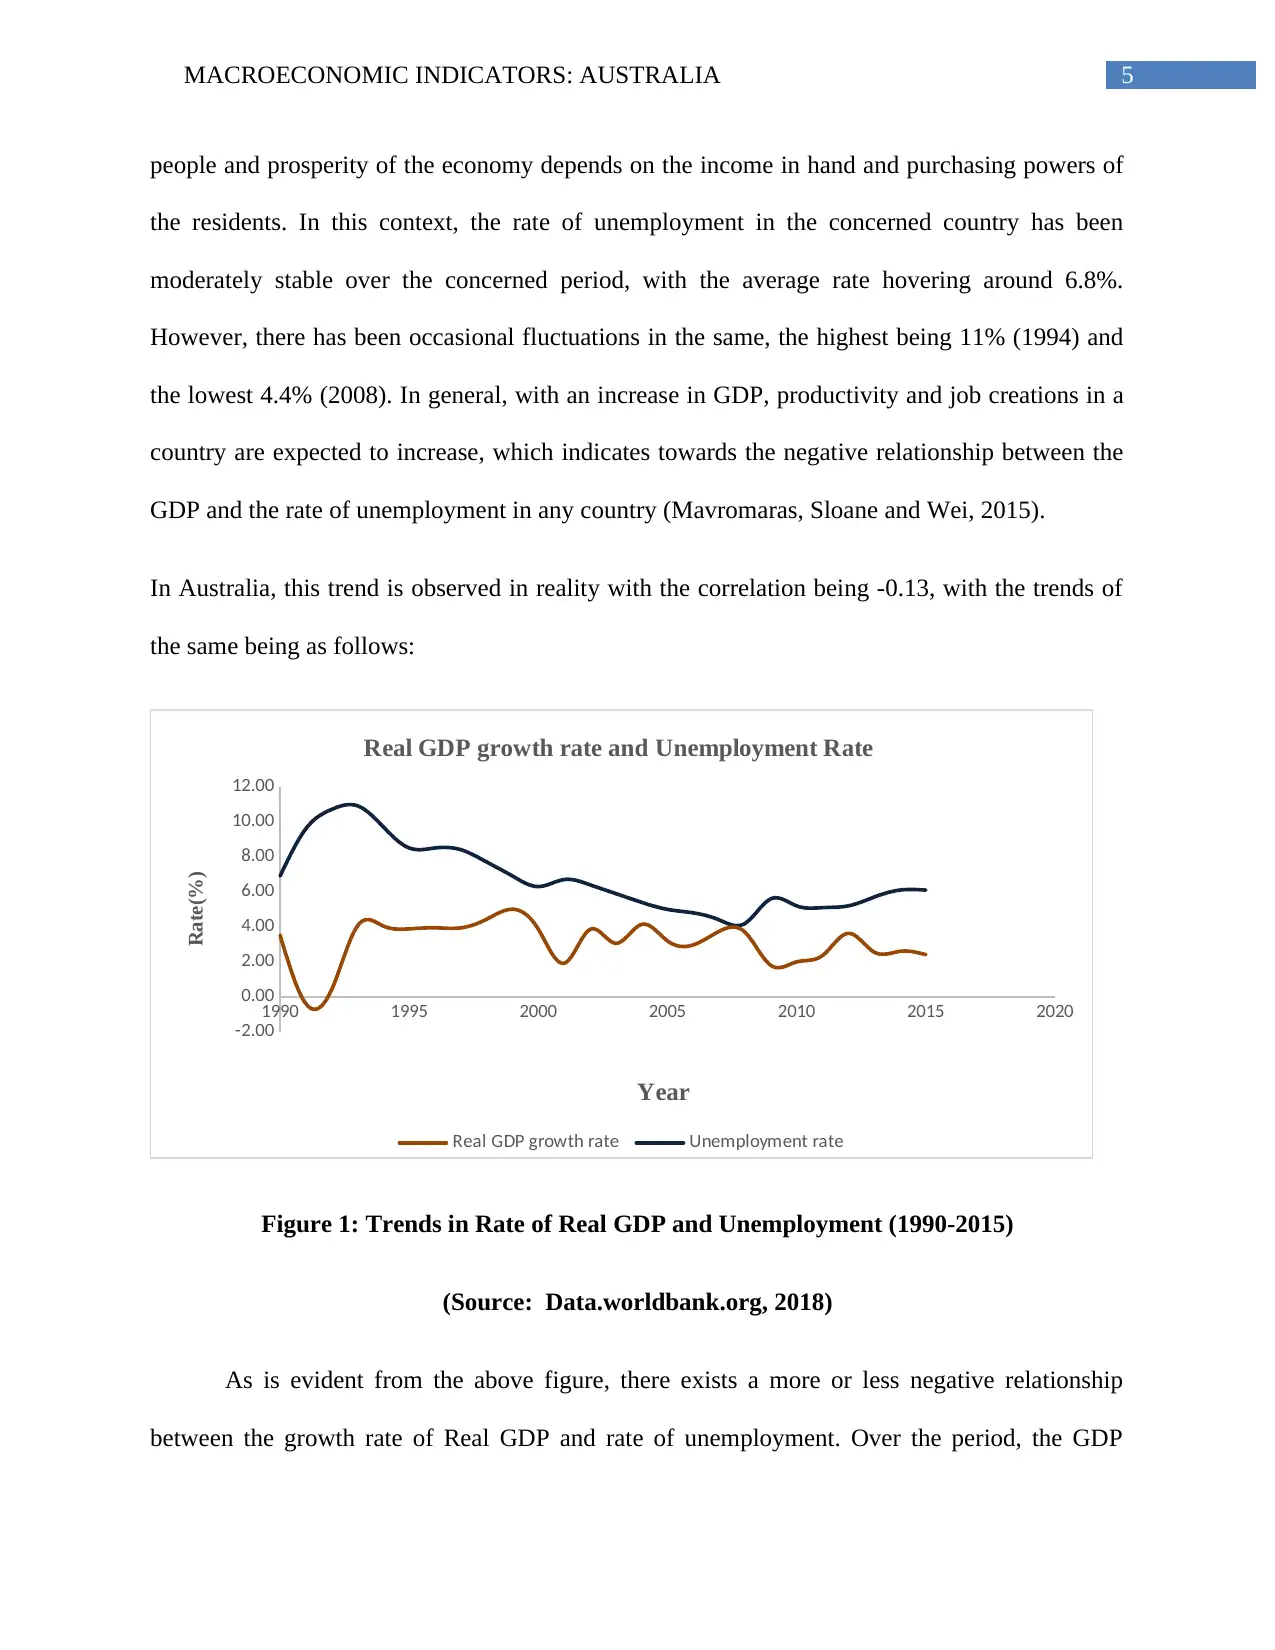
In Australia, this trend is observed in reality with the correlation being -0.13, with the trends of
the same being as follows:
1990 1995 2000 2005 2010 2015 2020
-2.00
0.00
2.00
4.00
6.00
8.00
10.00
12.00
Real GDP growth rate and Unemployment Rate
Real GDP growth rate Unemployment rate
Year
Rate(%)
Figure 1: Trends in Rate of Real GDP and Unemployment (1990-2015)
(Source: Data.worldbank.org, 2018)
As is evident from the above figure, there exists a more or less negative relationship
between the growth rate of Real GDP and rate of unemployment. Over the period, the GDP
people and prosperity of the economy depends on the income in hand and purchasing powers of
the residents. In this context, the rate of unemployment in the concerned country has been
moderately stable over the concerned period, with the average rate hovering around 6.8%.
However, there has been occasional fluctuations in the same, the highest being 11% (1994) and
the lowest 4.4% (2008). In general, with an increase in GDP, productivity and job creations in a
country are expected to increase, which indicates towards the negative relationship between the
GDP and the rate of unemployment in any country (Mavromaras, Sloane and Wei, 2015).
In Australia, this trend is observed in reality with the correlation being -0.13, with the trends of
the same being as follows:
1990 1995 2000 2005 2010 2015 2020
-2.00
0.00
2.00
4.00
6.00
8.00
10.00
12.00
Real GDP growth rate and Unemployment Rate
Real GDP growth rate Unemployment rate
Year
Rate(%)
Figure 1: Trends in Rate of Real GDP and Unemployment (1990-2015)
(Source: Data.worldbank.org, 2018)
As is evident from the above figure, there exists a more or less negative relationship
between the growth rate of Real GDP and rate of unemployment. Over the period, the GDP
⊘ This is a preview!⊘
Do you want full access?
Subscribe today to unlock all pages.
Trusted by 1+ million students worldwide
6MACROECONOMIC INDICATORS: AUSTRALIA
growth rate has been seen to maintain a stable positive trend, with occasional fluctuations and the
rate of unemployment is seen to decline substantially. This indicates towards the impressive
increase in the employments in the country, the same rising to as high as 12.5 million in the
contemporary period. This can be related to the more than expected increase in the rate of labor
force participation in the country.
2. Real GDP growth rate and inflation rate
The overall level of price existing in an economy, at a point of time, is another important
determinant of the economic welfare and situations of the residents as well as the country. This is
primarily because much of the demand and supply dynamics in the economy are dependent on
the price levels existing in the economy, the dynamics of which is measured by the rate of
inflation in the country. Very high and very low inflation rates can both adversely affect the
economy of the country and its residents. In general, high productivity increases the income in
hand of the residents of the country, thereby increasing their demand and driving up the average
price levels of the country, thereby indicating towards a positive linkage between the inflation
and the Real GDP growth rate (Agénor and Montiel, 2015).
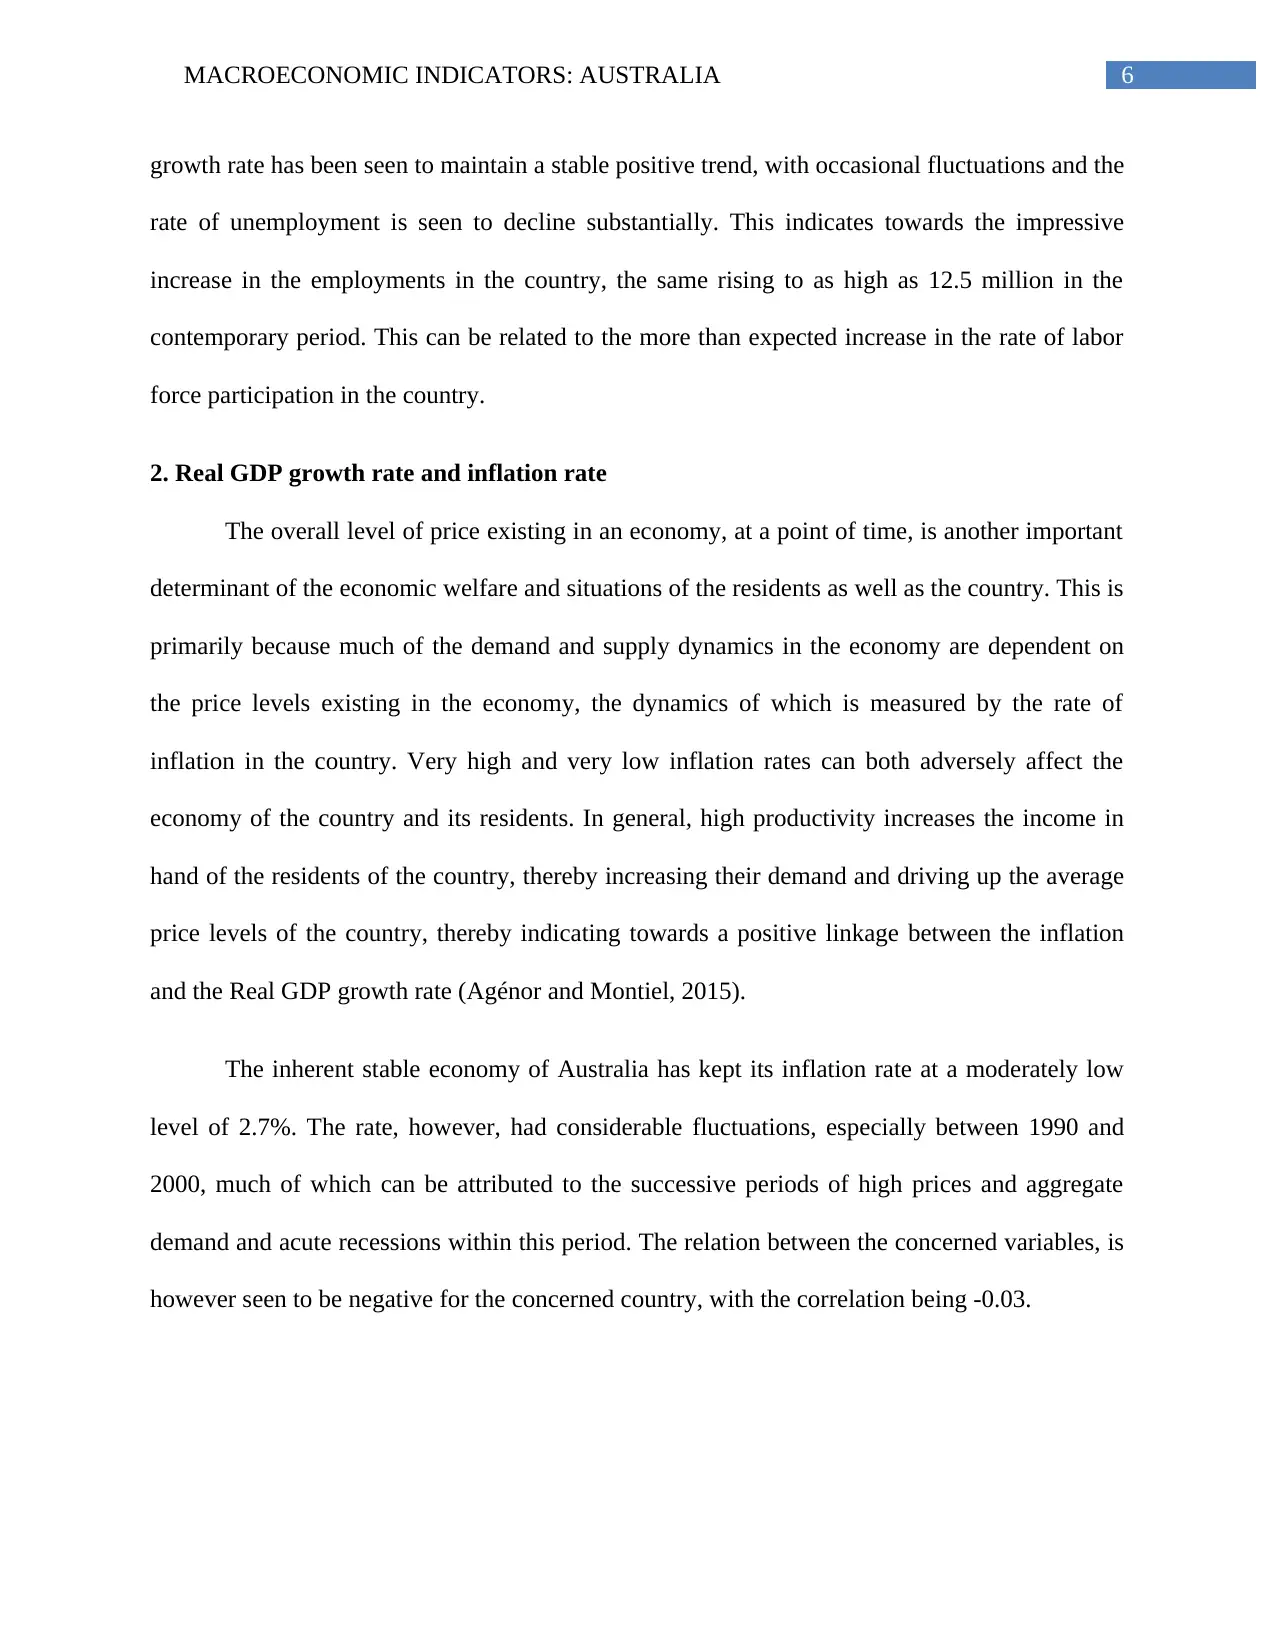
The inherent stable economy of Australia has kept its inflation rate at a moderately low
level of 2.7%. The rate, however, had considerable fluctuations, especially between 1990 and
2000, much of which can be attributed to the successive periods of high prices and aggregate
demand and acute recessions within this period. The relation between the concerned variables, is
however seen to be negative for the concerned country, with the correlation being -0.03.
growth rate has been seen to maintain a stable positive trend, with occasional fluctuations and the
rate of unemployment is seen to decline substantially. This indicates towards the impressive
increase in the employments in the country, the same rising to as high as 12.5 million in the
contemporary period. This can be related to the more than expected increase in the rate of labor
force participation in the country.
2. Real GDP growth rate and inflation rate
The overall level of price existing in an economy, at a point of time, is another important
determinant of the economic welfare and situations of the residents as well as the country. This is
primarily because much of the demand and supply dynamics in the economy are dependent on
the price levels existing in the economy, the dynamics of which is measured by the rate of
inflation in the country. Very high and very low inflation rates can both adversely affect the
economy of the country and its residents. In general, high productivity increases the income in
hand of the residents of the country, thereby increasing their demand and driving up the average
price levels of the country, thereby indicating towards a positive linkage between the inflation
and the Real GDP growth rate (Agénor and Montiel, 2015).
The inherent stable economy of Australia has kept its inflation rate at a moderately low
level of 2.7%. The rate, however, had considerable fluctuations, especially between 1990 and
2000, much of which can be attributed to the successive periods of high prices and aggregate
demand and acute recessions within this period. The relation between the concerned variables, is
however seen to be negative for the concerned country, with the correlation being -0.03.
Paraphrase This Document
Need a fresh take? Get an instant paraphrase of this document with our AI Paraphraser
7MACROECONOMIC INDICATORS: AUSTRALIA
Figure 2: Rate of growth of Real GDP and Inflation (1990-2015)
(Source: Data.worldbank.org, 2018)
The above figure shows that there has been considerable fluctuations in both the
indicators in the govern period of time, however, the overall trend of relationship between the
two indicators in found to be negative, which is opposite to the assertions of the existing
economic theory. The negative relation between the growth rate of the Real GDP of Australia
and the inflation rate of the same can to some extent be explained by the presence of high debt
burden in the country in the period taken into consideration (Kumar, Webber and Perry, 2012).
This is because, the presence of a high debt with a high rate of inflation have negative
implications on the GDP statistics of the country, which can be seen from the above figure.
3. Real GDP and the cash rate
Cash rate in a country, is usually the rate of interest, which is charged by the Central
Monetary Authority of the country from the commercial banks on the loans taken by the latter
1985 1990 1995 2000 2005 2010 2015 2020
-1.00
0.00
1.00
2.00
3.00
4.00
5.00
6.00
7.00
8.00
Real GDP growth rate and Inflation rate
Real GDP growth rate Inflation rate
Year
Rate (%)
8MACROECONOMIC INDICATORS: AUSTRALIA
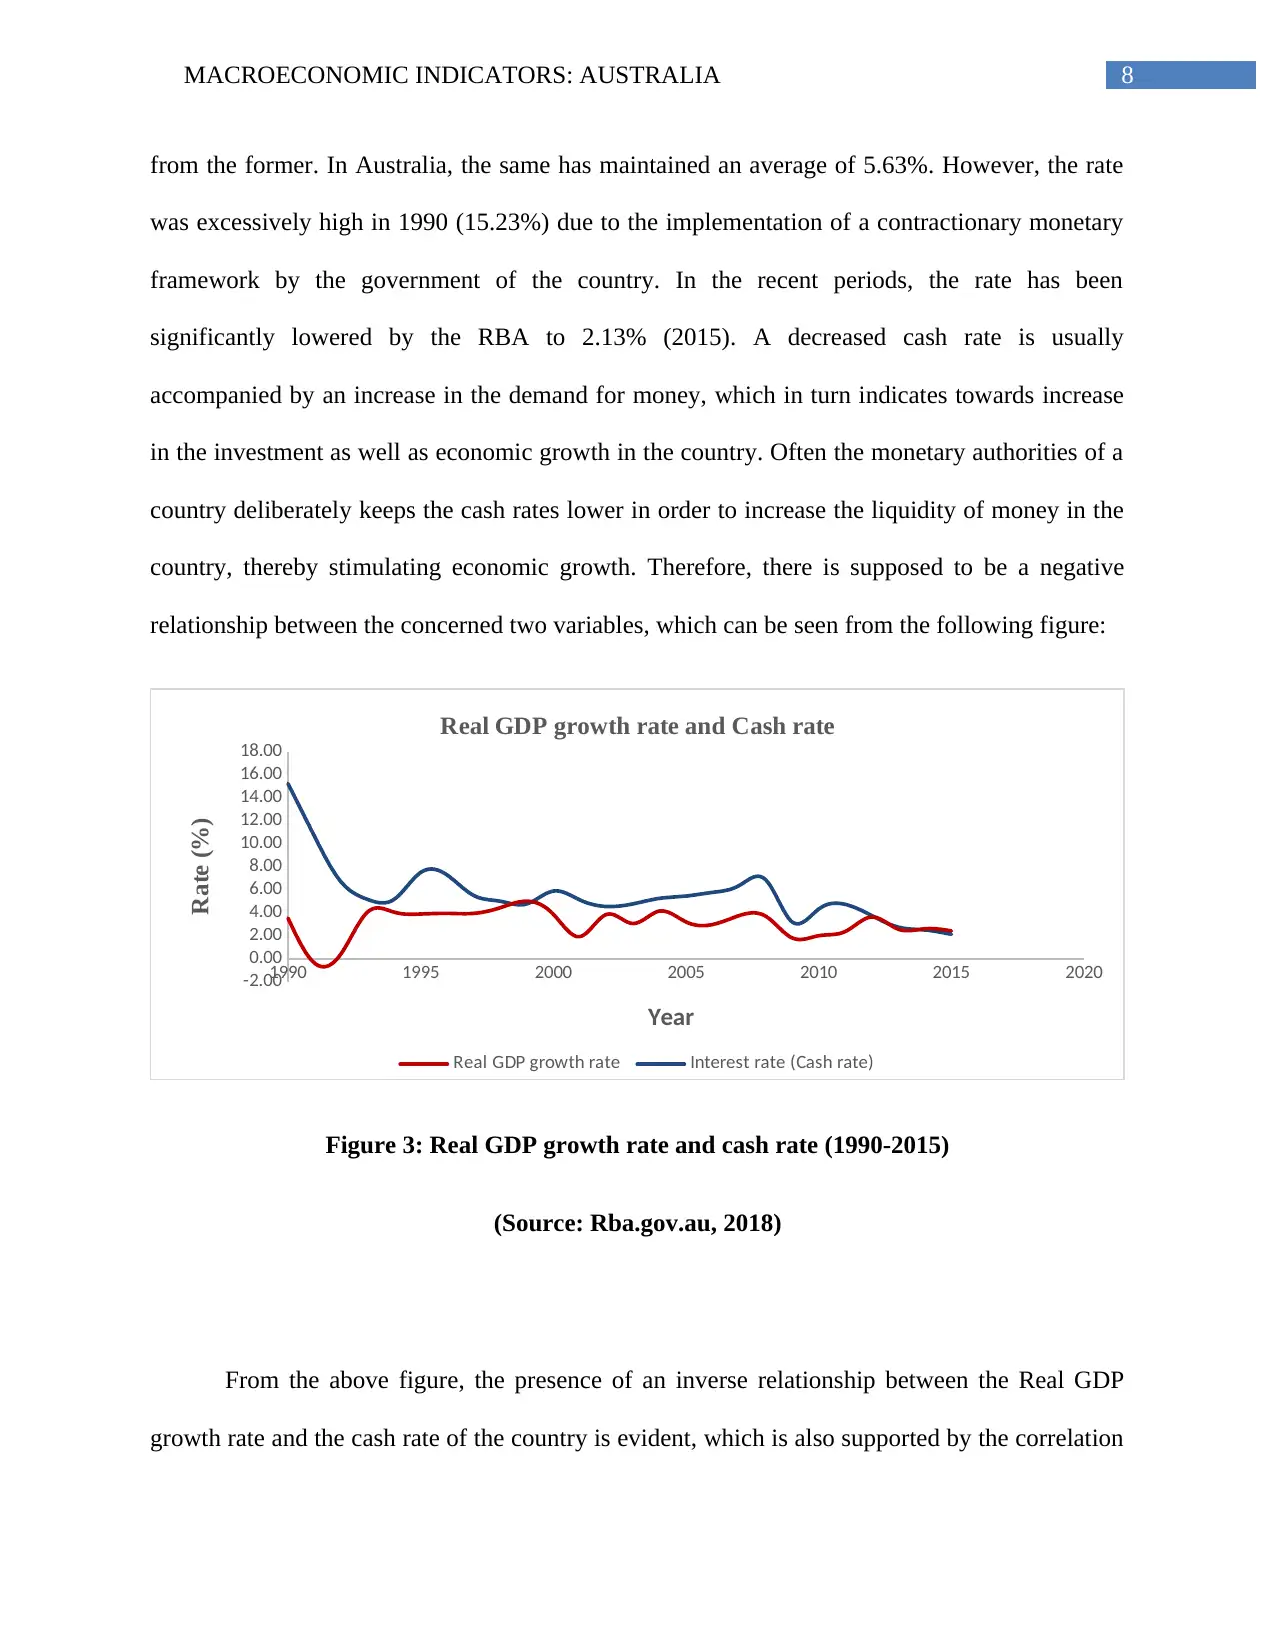
from the former. In Australia, the same has maintained an average of 5.63%. However, the rate
was excessively high in 1990 (15.23%) due to the implementation of a contractionary monetary
framework by the government of the country. In the recent periods, the rate has been
significantly lowered by the RBA to 2.13% (2015). A decreased cash rate is usually
accompanied by an increase in the demand for money, which in turn indicates towards increase
in the investment as well as economic growth in the country. Often the monetary authorities of a
country deliberately keeps the cash rates lower in order to increase the liquidity of money in the
country, thereby stimulating economic growth. Therefore, there is supposed to be a negative
relationship between the concerned two variables, which can be seen from the following figure:
1990 1995 2000 2005 2010 2015 2020-2.00
0.00
2.00
4.00
6.00
8.00
10.00
12.00
14.00
16.00
18.00
Real GDP growth rate and Cash rate
Real GDP growth rate Interest rate (Cash rate)
Year
Rate (%)
Figure 3: Real GDP growth rate and cash rate (1990-2015)
(Source: Rba.gov.au, 2018)
From the above figure, the presence of an inverse relationship between the Real GDP
growth rate and the cash rate of the country is evident, which is also supported by the correlation
⊘ This is a preview!⊘
Do you want full access?
Subscribe today to unlock all pages.
Trusted by 1+ million students worldwide
9MACROECONOMIC INDICATORS: AUSTRALIA
estimate between the two variables, which is observed to be -0.08. Over the last few years, the
cash rate in the country has significantly decreased, the same being deliberately done by the
RBA to facilitate investments in the economy. This is seen to be accompanied by the stable
increase in the growth rate of the Real GDP, which is primarily attributed to the increase in the
residential and asset investments as well as an increase in the overall demand in the country. This
thereby justifies the decision of the RBA to keep the cash rate at a lower level than normal
(Škovránek, Podlubny and Petráš, 2012).
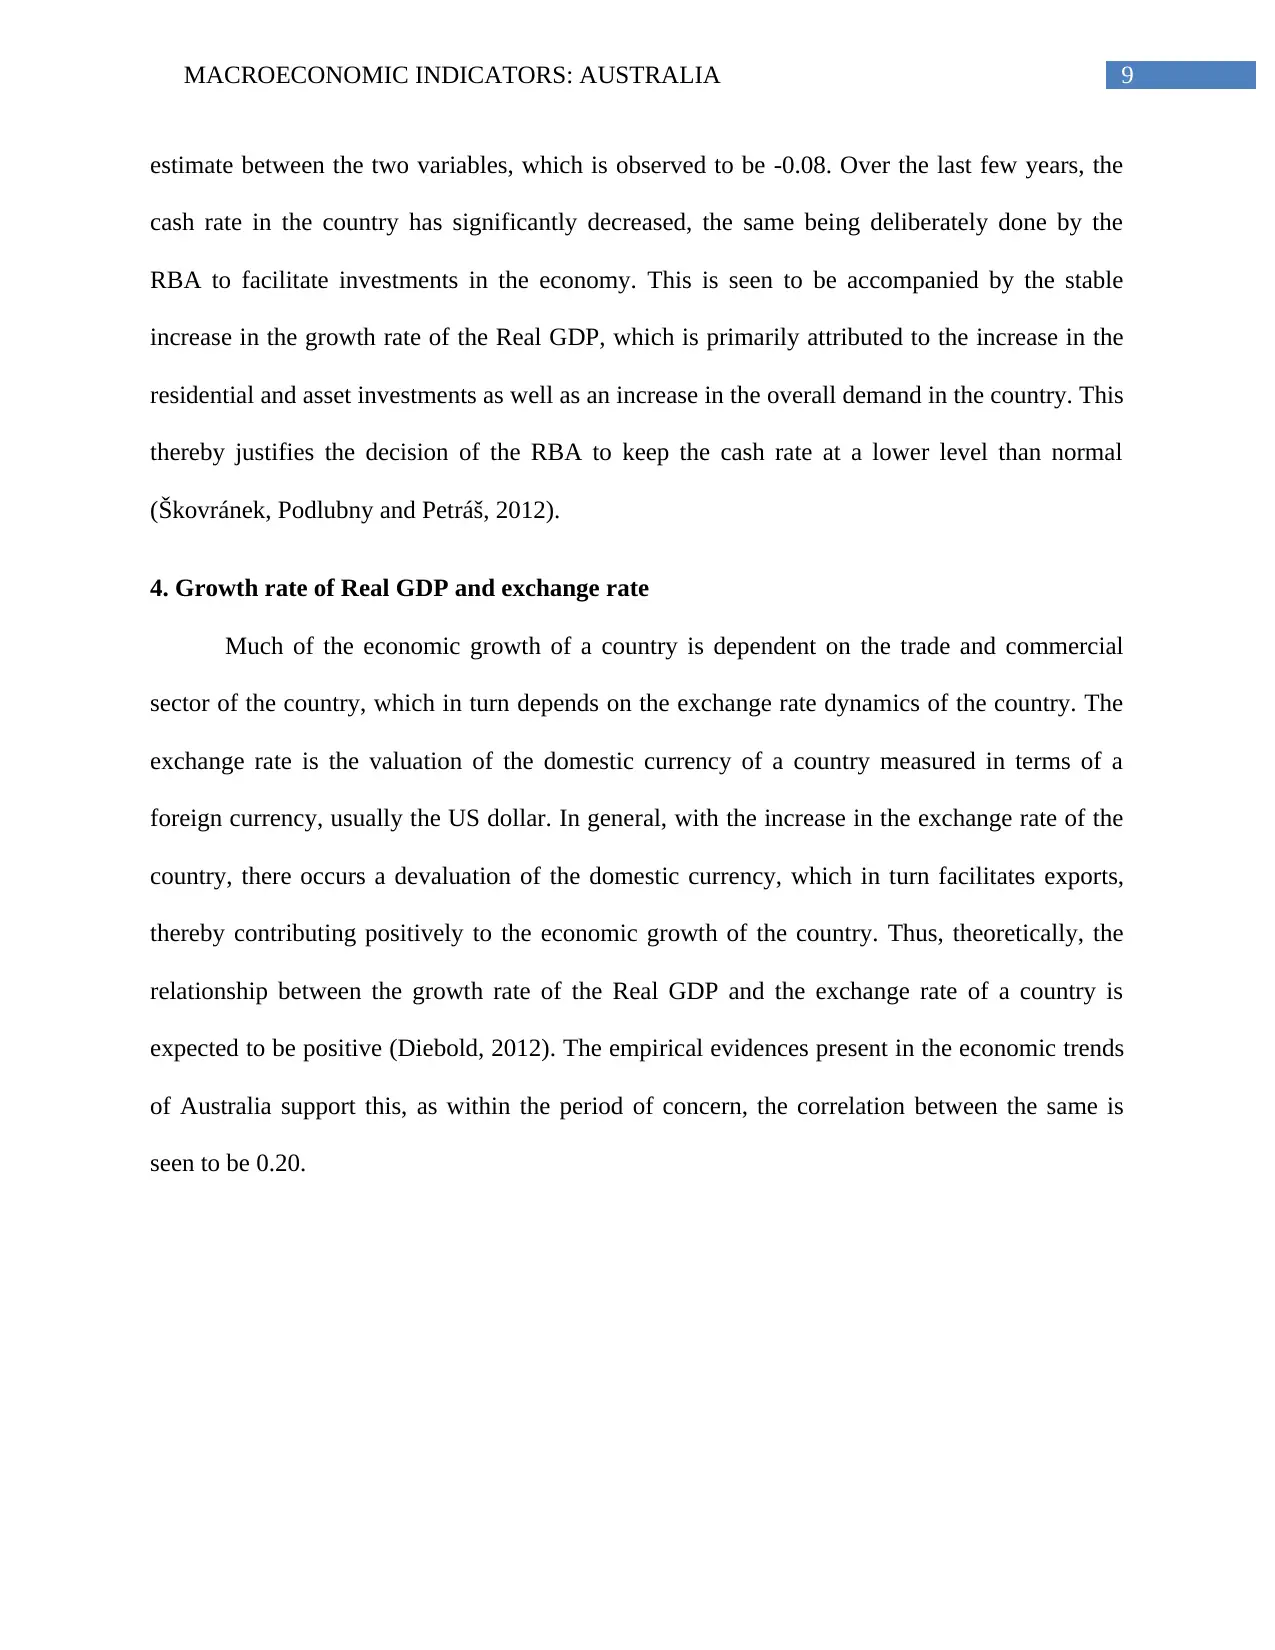
4. Growth rate of Real GDP and exchange rate
Much of the economic growth of a country is dependent on the trade and commercial
sector of the country, which in turn depends on the exchange rate dynamics of the country. The
exchange rate is the valuation of the domestic currency of a country measured in terms of a
foreign currency, usually the US dollar. In general, with the increase in the exchange rate of the
country, there occurs a devaluation of the domestic currency, which in turn facilitates exports,
thereby contributing positively to the economic growth of the country. Thus, theoretically, the
relationship between the growth rate of the Real GDP and the exchange rate of a country is
expected to be positive (Diebold, 2012). The empirical evidences present in the economic trends
of Australia support this, as within the period of concern, the correlation between the same is
seen to be 0.20.
estimate between the two variables, which is observed to be -0.08. Over the last few years, the
cash rate in the country has significantly decreased, the same being deliberately done by the
RBA to facilitate investments in the economy. This is seen to be accompanied by the stable
increase in the growth rate of the Real GDP, which is primarily attributed to the increase in the
residential and asset investments as well as an increase in the overall demand in the country. This
thereby justifies the decision of the RBA to keep the cash rate at a lower level than normal
(Škovránek, Podlubny and Petráš, 2012).
4. Growth rate of Real GDP and exchange rate
Much of the economic growth of a country is dependent on the trade and commercial
sector of the country, which in turn depends on the exchange rate dynamics of the country. The
exchange rate is the valuation of the domestic currency of a country measured in terms of a
foreign currency, usually the US dollar. In general, with the increase in the exchange rate of the
country, there occurs a devaluation of the domestic currency, which in turn facilitates exports,
thereby contributing positively to the economic growth of the country. Thus, theoretically, the
relationship between the growth rate of the Real GDP and the exchange rate of a country is
expected to be positive (Diebold, 2012). The empirical evidences present in the economic trends
of Australia support this, as within the period of concern, the correlation between the same is
seen to be 0.20.
Paraphrase This Document
Need a fresh take? Get an instant paraphrase of this document with our AI Paraphraser
10MACROECONOMIC INDICATORS: AUSTRALIA
1985 1990 1995 2000 2005 2010 2015 2020
-1.00
0.00
1.00
2.00
3.00
4.00
5.00
6.00
Growth rate of Real GDP and exchange rate
Real GDP growth rate Exchange rate (AUD/US)
Year
Figure 4: Real GDP growth rate and exchange rate (1990-2015)
(Source: Rba.gov.au, 2018)
The exchange rate of the country has moderately remained between USD 1 and USD 2.
This is seen to be clubbed with a stable growth rate in the Real GDP in Australia in spite of its
fluctuations in the same. The exchange rate has however favored the country to expand its export
sector considerably, as with time the economy has set up productive and bilateral trade relations
with almost all the major economies of the world (Manalo, Perera and Rees, 2015).
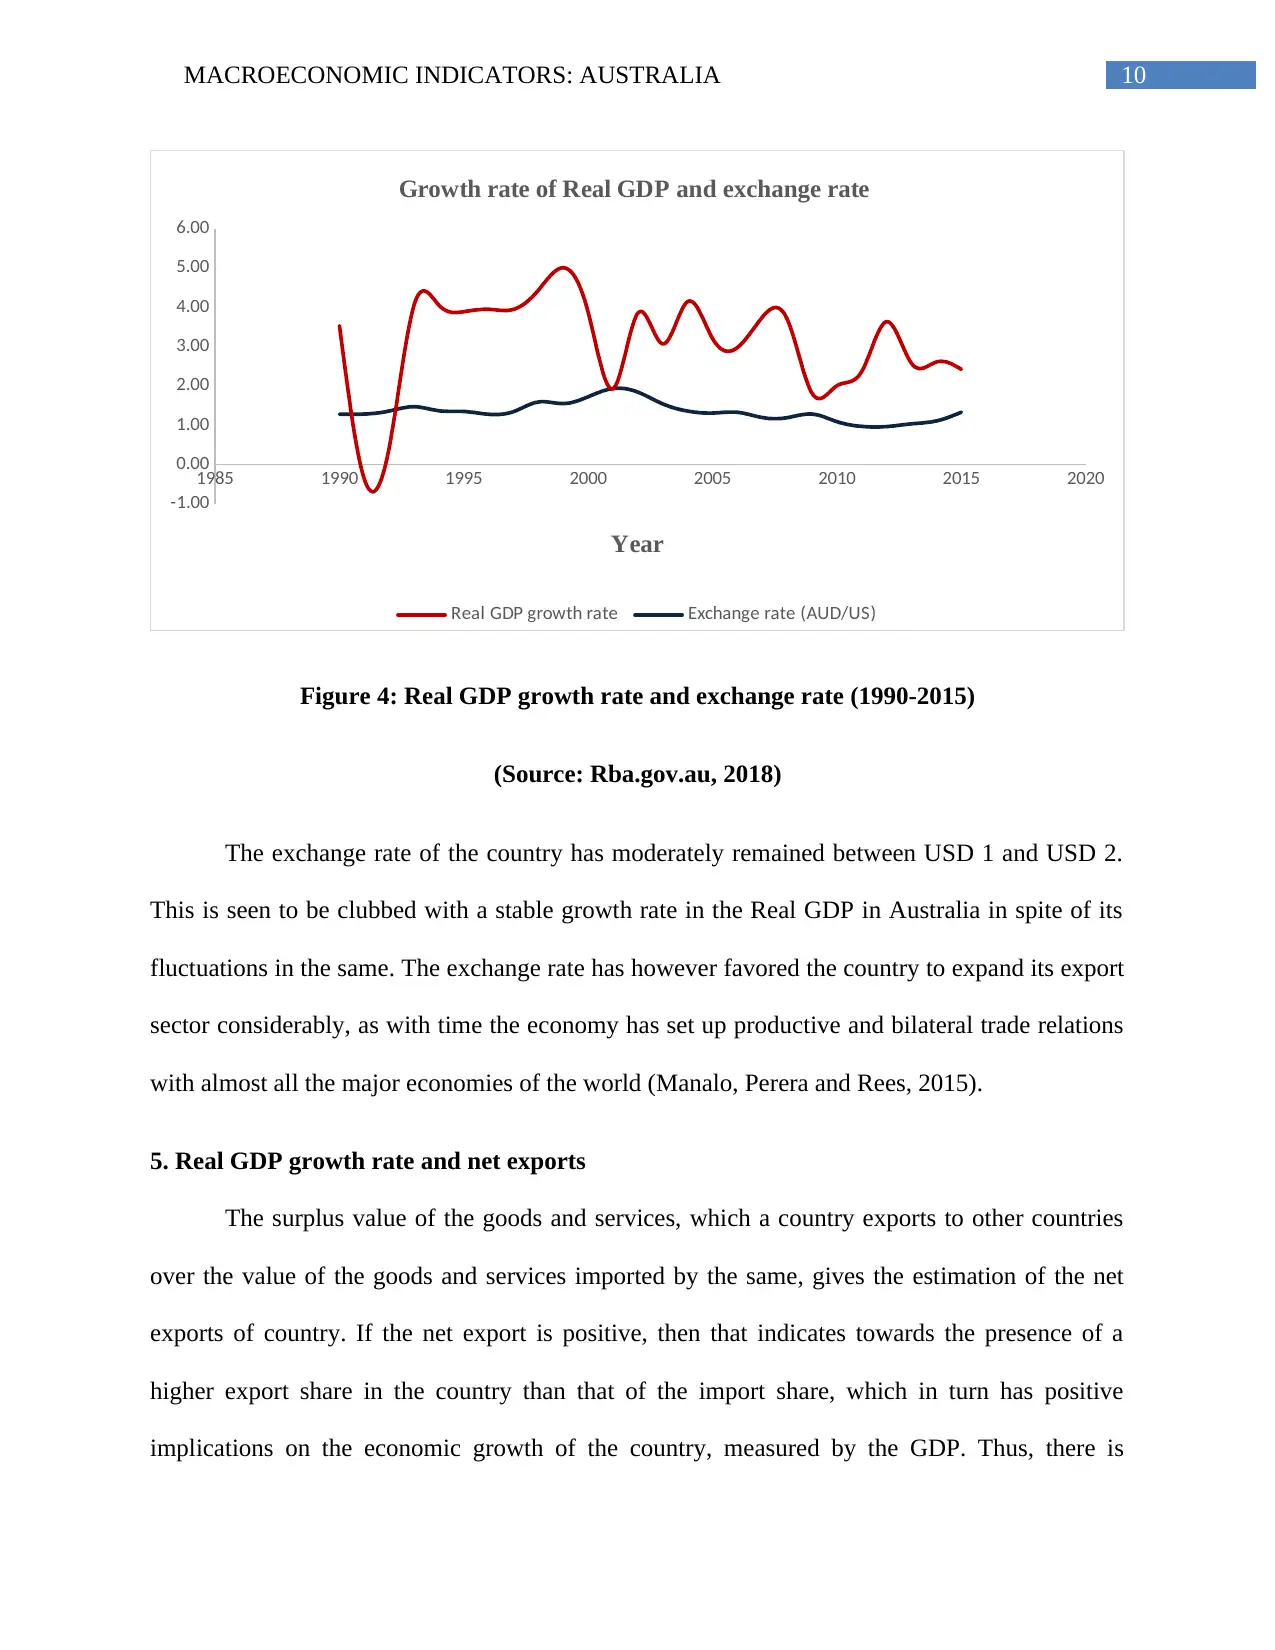
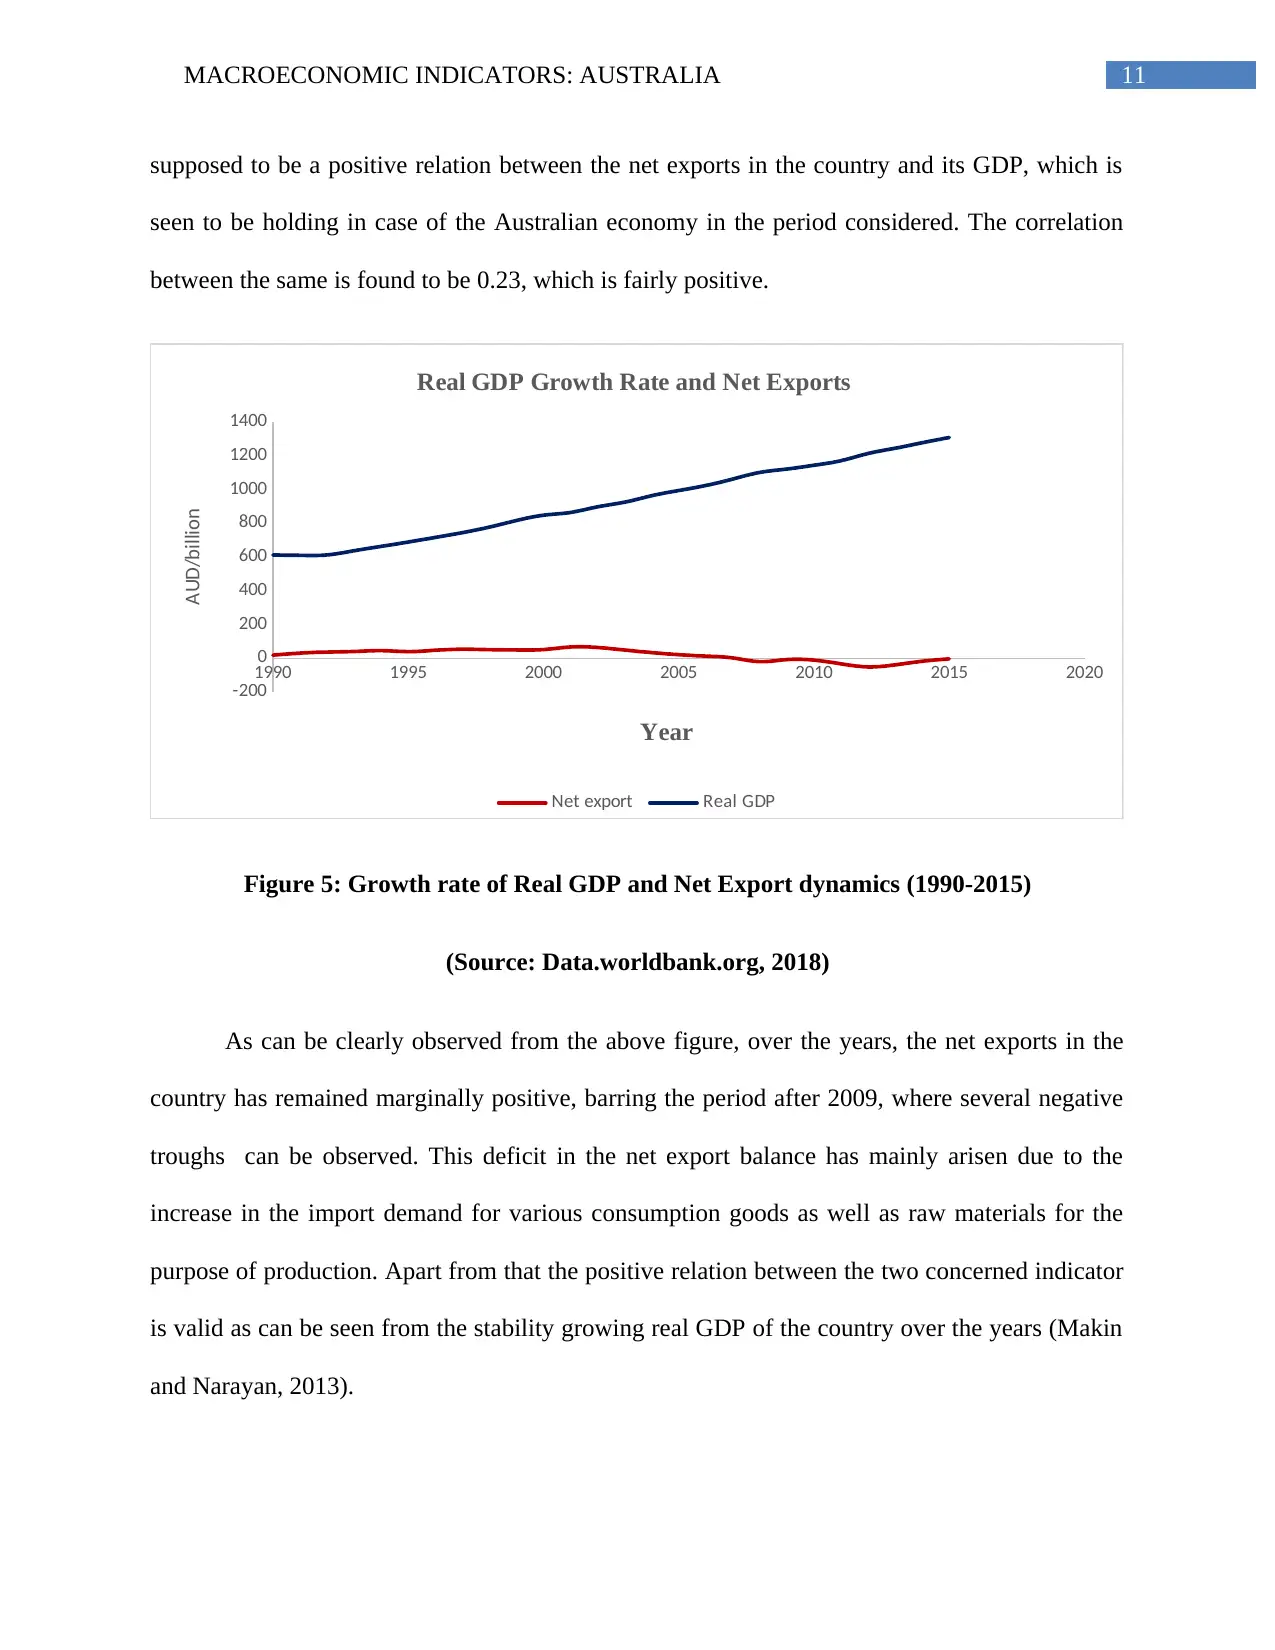
5. Real GDP growth rate and net exports
The surplus value of the goods and services, which a country exports to other countries
over the value of the goods and services imported by the same, gives the estimation of the net
exports of country. If the net export is positive, then that indicates towards the presence of a
higher export share in the country than that of the import share, which in turn has positive
implications on the economic growth of the country, measured by the GDP. Thus, there is
1985 1990 1995 2000 2005 2010 2015 2020
-1.00
0.00
1.00
2.00
3.00
4.00
5.00
6.00
Growth rate of Real GDP and exchange rate
Real GDP growth rate Exchange rate (AUD/US)
Year
Figure 4: Real GDP growth rate and exchange rate (1990-2015)
(Source: Rba.gov.au, 2018)
The exchange rate of the country has moderately remained between USD 1 and USD 2.
This is seen to be clubbed with a stable growth rate in the Real GDP in Australia in spite of its
fluctuations in the same. The exchange rate has however favored the country to expand its export
sector considerably, as with time the economy has set up productive and bilateral trade relations
with almost all the major economies of the world (Manalo, Perera and Rees, 2015).
5. Real GDP growth rate and net exports
The surplus value of the goods and services, which a country exports to other countries
over the value of the goods and services imported by the same, gives the estimation of the net
exports of country. If the net export is positive, then that indicates towards the presence of a
higher export share in the country than that of the import share, which in turn has positive
implications on the economic growth of the country, measured by the GDP. Thus, there is
11MACROECONOMIC INDICATORS: AUSTRALIA
supposed to be a positive relation between the net exports in the country and its GDP, which is
seen to be holding in case of the Australian economy in the period considered. The correlation
between the same is found to be 0.23, which is fairly positive.
1990 1995 2000 2005 2010 2015 2020
-200
0
200
400
600
800
1000
1200
1400
Real GDP Growth Rate and Net Exports
Net export Real GDP
Year
AUD/billion
Figure 5: Growth rate of Real GDP and Net Export dynamics (1990-2015)
(Source: Data.worldbank.org, 2018)
As can be clearly observed from the above figure, over the years, the net exports in the
country has remained marginally positive, barring the period after 2009, where several negative
troughs can be observed. This deficit in the net export balance has mainly arisen due to the
increase in the import demand for various consumption goods as well as raw materials for the
purpose of production. Apart from that the positive relation between the two concerned indicator
is valid as can be seen from the stability growing real GDP of the country over the years (Makin
and Narayan, 2013).
⊘ This is a preview!⊘
Do you want full access?
Subscribe today to unlock all pages.
Trusted by 1+ million students worldwide
1 out of 17
Related Documents


Your All-in-One AI-Powered Toolkit for Academic Success.
+13062052269
info@desklib.com
Available 24*7 on WhatsApp / Email
![[object Object]](/_next/static/media/star-bottom.7253800d.svg)
Unlock your academic potential
Copyright © 2020–2026 A2Z Services. All Rights Reserved. Developed and managed by ZUCOL.