Analyzing Key Macroeconomic Indicators: Australia & New Zealand
VerifiedAdded on 2023/06/07
|22
|4182
|360
Report
AI Summary
This report provides a comparative analysis of the macroeconomic indicators of Australia and New Zealand, focusing on real GDP growth rate, cash rates and official cash rates (OCR), unemployment rates, and inflation rates. The analysis includes statistical data and graphical representations to illustrate the relationships between these indicators in both countries. Australia's GDP growth has shown a recent increase, driven by domestic demand and foreign trade, while New Zealand experienced a slight advancement. Australia's cash rate remains at a low percentage, while New Zealand's OCR is steady, with expectations of remaining consistent. Unemployment rates in Australia have slightly decreased, whereas New Zealand's unemployment rates have edged up. Inflation rates in Australia have risen, primarily due to transport costs, while New Zealand's inflation is influenced by housing and household utilities. Based on these observations, the report offers a prediction of the macroeconomic outlook for both countries, considering potential risks and uncertainties. Desklib provides a platform for students to access this and similar solved assignments.
MACROECONOMIC INDICATORS: AUSTRALIA VS NEW ZEALAND 1
MACROECONOMICS INDICATORS: AUSTRALIA VS NEW ZEALAND
Student Name
Institution Affiliation
Facilitator
Course
Date
MACROECONOMICS INDICATORS: AUSTRALIA VS NEW ZEALAND
Student Name
Institution Affiliation
Facilitator
Course
Date
Paraphrase This Document
Need a fresh take? Get an instant paraphrase of this document with our AI Paraphraser
MACROECONOMIC INDICATORS: AUSTRALIA VS NEW ZEALAND 2
Executive Summary
To determine the economic progress of a country, the key macroeconomic indicators play a very
crucial role. For instance, when the inflation rates of a country are high it’s an indication that the
economy is on a wrong direction. Again, when the unemployment rates are high, the economic
progress is on the wrong direction. To adjust economic progress of a country, different measures
are used. Some of the measures include but not limited to cash rates and official cash rates
(OCR). This paper used the five macroeconomic indicators to compare the two economies of
Australia and New Zealand.
Contents
MACROECONOMIC INDICATORS: AUSTRALIA VS NEW ZEALAND 3
Introduction......................................................................................................................................4
Data on key macroeconomic indicators: Australia vs New Zealand...............................................4
Real GDP Growth Rate................................................................................................................4
Australia...................................................................................................................................4
New Zealand.............................................................................................................................5
Cash Rates & Official Cash Rate (OCR).........................................................................................6
Australia.......................................................................................................................................6
New Zealand................................................................................................................................7
Unemployment Rate........................................................................................................................9
Australia.......................................................................................................................................9
New Zealand..............................................................................................................................10
Inflation Rates................................................................................................................................11
Australia.....................................................................................................................................11
New Zealand..............................................................................................................................12
New Zealand GDP growth rate vs Australia GDP growth rate.....................................................13
New Zealand inflation rate vs Australia inflation rate...................................................................14
New Zealand unemployment rate vs Australia unemployment rate..............................................15
Cash rate vs official cash rate (OCR)............................................................................................16
Prediction of macroeconomic outlook...........................................................................................17
Australia.....................................................................................................................................17
New Zealand..............................................................................................................................18
Conclusions....................................................................................................................................19
Recommendations..........................................................................................................................19
References......................................................................................................................................20
Introduction
Macroeconomic indicators are useful factors when comparing the trends in economic
growth either in one country or different countries. It’s through the consideration of
⊘ This is a preview!⊘
Do you want full access?
Subscribe today to unlock all pages.
Trusted by 1+ million students worldwide
MACROECONOMIC INDICATORS: AUSTRALIA VS NEW ZEALAND 4
macroeconomic indicators that economists determine whether an economy is advancing,
stagnating or declining. So, these indicators are basically strong tools in the evaluation process of
economy. To be able to compare the economy of Australia and New Zealand, four
macroeconomic indicators were used in this paper, these are: real GDP growth rate of the two
countries, cash rates and official cash rates, unemployment rates and inflation rates.
Data on key macroeconomic indicators: Australia vs New Zealand
Real GDP Growth Rate
Australia
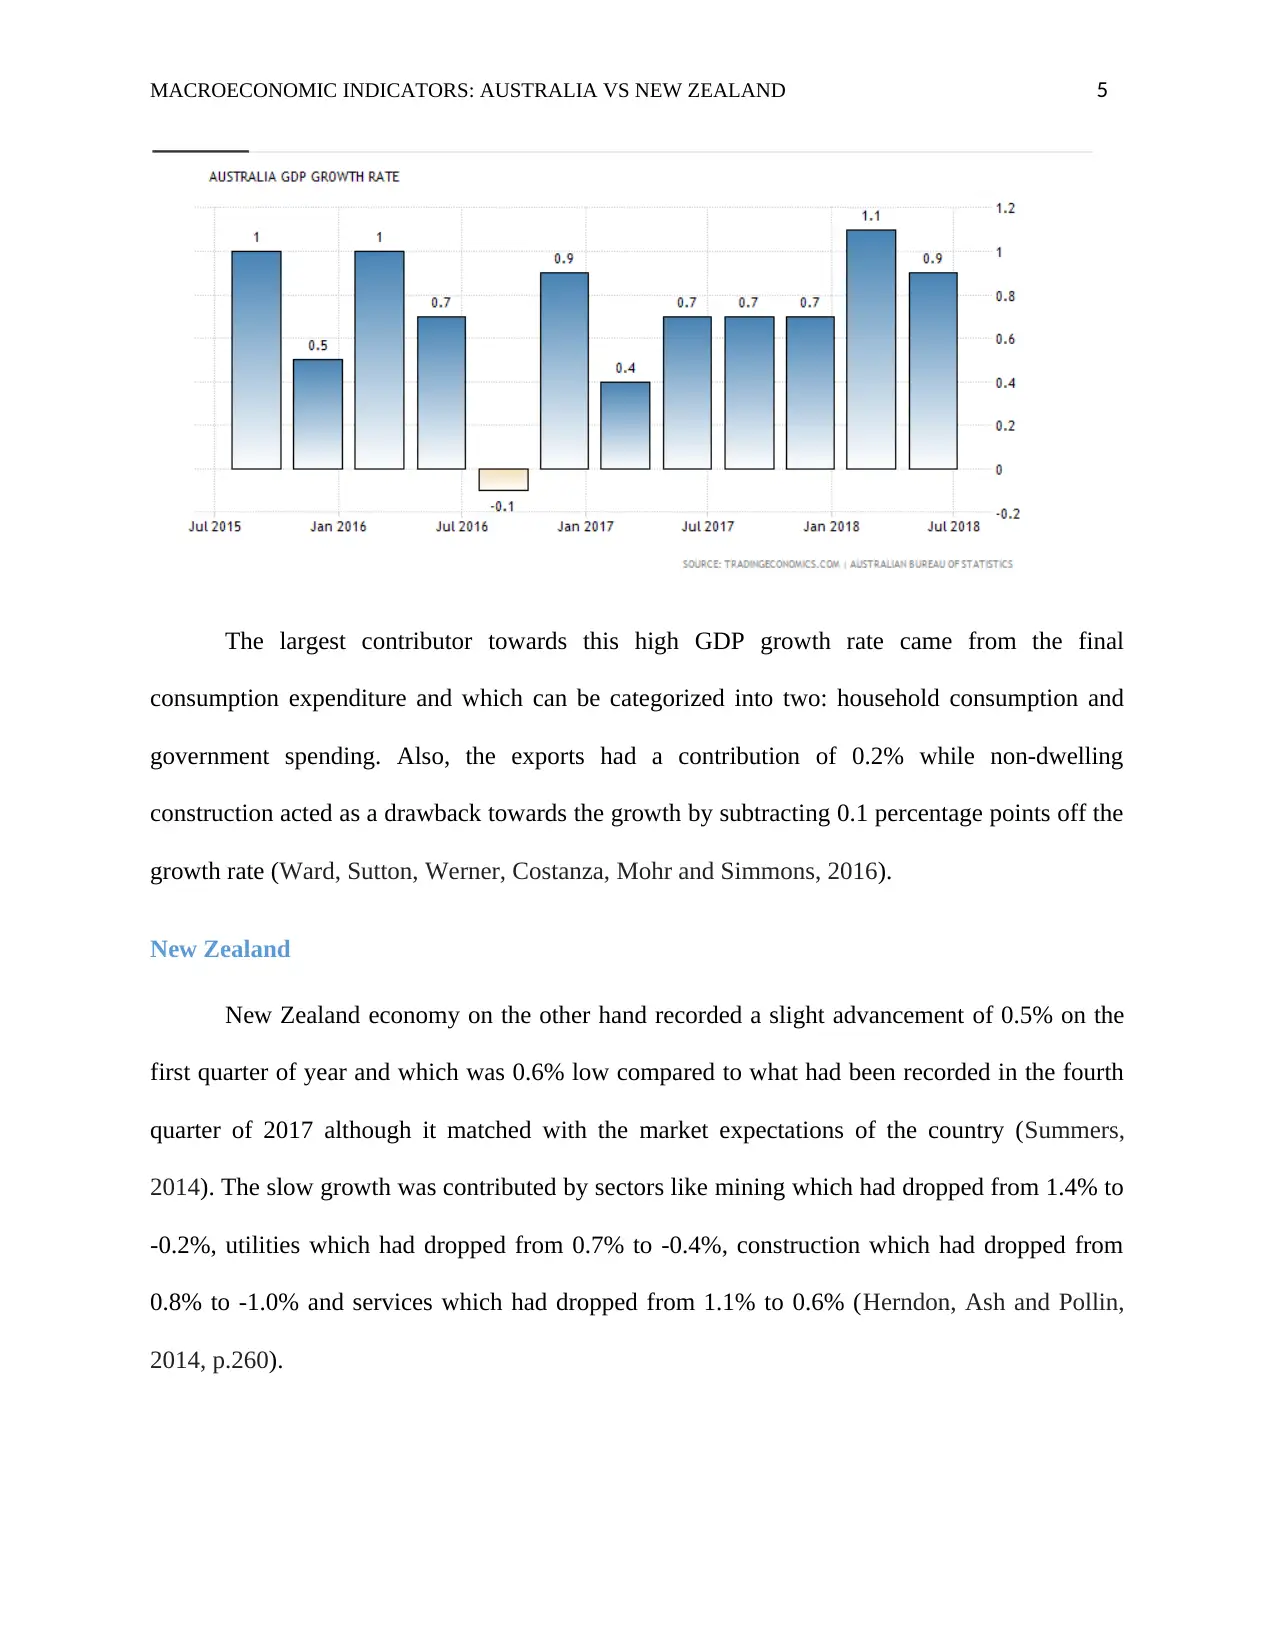
According to the recent statistics in June quarter, the economy of Australia has recorded
an advancement of 0.9% above the market consensus of 0.7% expansion and after an upward
revised growth of 1.1% which had been realized in the previous quarter. Mainly, domestic
demand and the foreign trade were ranked as the top supporters of this growth because fixed
investments had remained flat (Cecchetti and Kharroubi, 2015). An economic growth rate of
3.4% had been recorded through the second quarter following the 3.2% expansion which had
been realized in the prior quarter and exceeding the 2.8% growth expectations. This has become
the fastest annual expansion rate since the third quarter of 2012. Generally, the average GDP
Growth Rate in Australia is 0.86% from 1959 until 2018, with its highest level at 4.40% in the
first quarter of 1976 and a lowest level of -2 percent which has been realized in the second
quarter of 1974 (Bhattacharya, Paramati, Ozturk and Bhattacharya, 2016, p.740).
macroeconomic indicators that economists determine whether an economy is advancing,
stagnating or declining. So, these indicators are basically strong tools in the evaluation process of
economy. To be able to compare the economy of Australia and New Zealand, four
macroeconomic indicators were used in this paper, these are: real GDP growth rate of the two
countries, cash rates and official cash rates, unemployment rates and inflation rates.
Data on key macroeconomic indicators: Australia vs New Zealand
Real GDP Growth Rate
Australia
According to the recent statistics in June quarter, the economy of Australia has recorded
an advancement of 0.9% above the market consensus of 0.7% expansion and after an upward
revised growth of 1.1% which had been realized in the previous quarter. Mainly, domestic
demand and the foreign trade were ranked as the top supporters of this growth because fixed
investments had remained flat (Cecchetti and Kharroubi, 2015). An economic growth rate of
3.4% had been recorded through the second quarter following the 3.2% expansion which had
been realized in the prior quarter and exceeding the 2.8% growth expectations. This has become
the fastest annual expansion rate since the third quarter of 2012. Generally, the average GDP
Growth Rate in Australia is 0.86% from 1959 until 2018, with its highest level at 4.40% in the
first quarter of 1976 and a lowest level of -2 percent which has been realized in the second
quarter of 1974 (Bhattacharya, Paramati, Ozturk and Bhattacharya, 2016, p.740).
Paraphrase This Document
Need a fresh take? Get an instant paraphrase of this document with our AI Paraphraser
MACROECONOMIC INDICATORS: AUSTRALIA VS NEW ZEALAND 5
The largest contributor towards this high GDP growth rate came from the final
consumption expenditure and which can be categorized into two: household consumption and
government spending. Also, the exports had a contribution of 0.2% while non-dwelling
construction acted as a drawback towards the growth by subtracting 0.1 percentage points off the
growth rate (Ward, Sutton, Werner, Costanza, Mohr and Simmons, 2016).
New Zealand
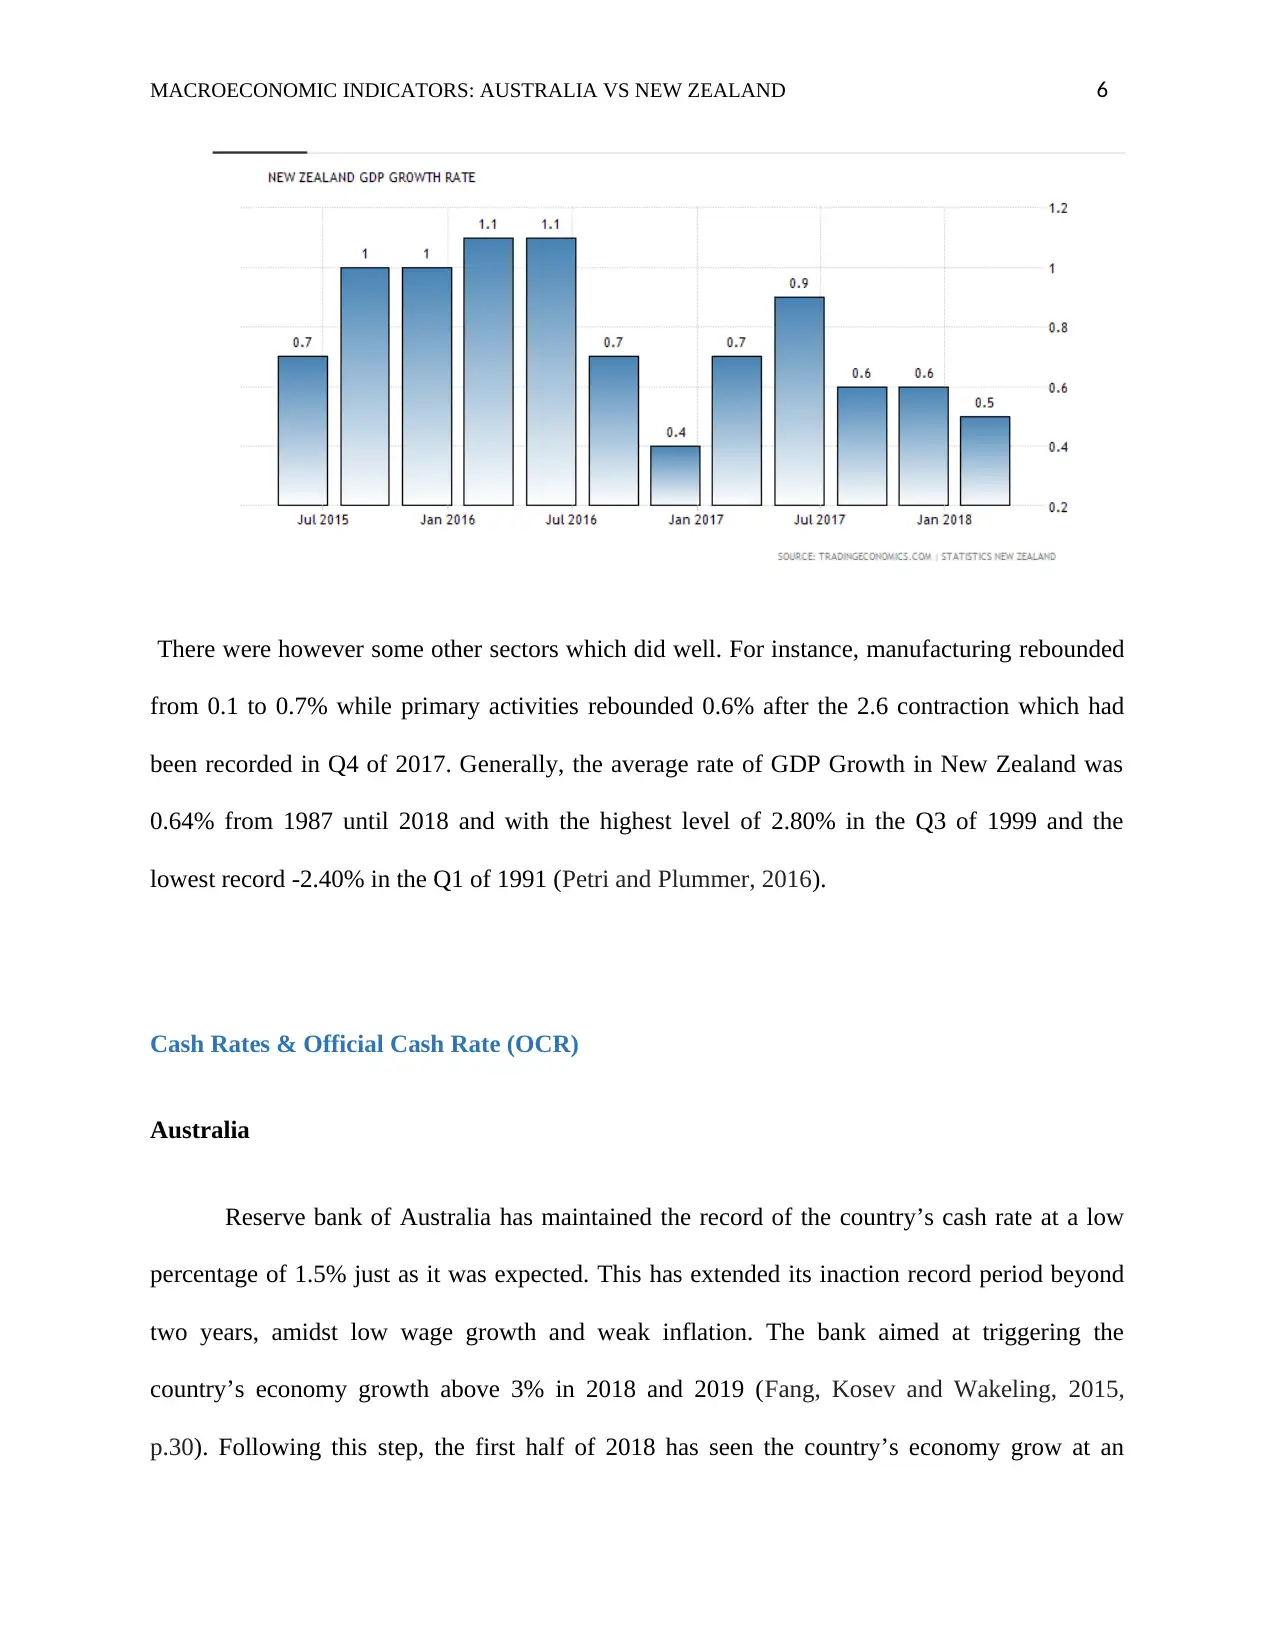
New Zealand economy on the other hand recorded a slight advancement of 0.5% on the
first quarter of year and which was 0.6% low compared to what had been recorded in the fourth
quarter of 2017 although it matched with the market expectations of the country (Summers,
2014). The slow growth was contributed by sectors like mining which had dropped from 1.4% to
-0.2%, utilities which had dropped from 0.7% to -0.4%, construction which had dropped from
0.8% to -1.0% and services which had dropped from 1.1% to 0.6% (Herndon, Ash and Pollin,
2014, p.260).
The largest contributor towards this high GDP growth rate came from the final
consumption expenditure and which can be categorized into two: household consumption and
government spending. Also, the exports had a contribution of 0.2% while non-dwelling
construction acted as a drawback towards the growth by subtracting 0.1 percentage points off the
growth rate (Ward, Sutton, Werner, Costanza, Mohr and Simmons, 2016).
New Zealand
New Zealand economy on the other hand recorded a slight advancement of 0.5% on the
first quarter of year and which was 0.6% low compared to what had been recorded in the fourth
quarter of 2017 although it matched with the market expectations of the country (Summers,
2014). The slow growth was contributed by sectors like mining which had dropped from 1.4% to
-0.2%, utilities which had dropped from 0.7% to -0.4%, construction which had dropped from
0.8% to -1.0% and services which had dropped from 1.1% to 0.6% (Herndon, Ash and Pollin,
2014, p.260).
MACROECONOMIC INDICATORS: AUSTRALIA VS NEW ZEALAND 6
There were however some other sectors which did well. For instance, manufacturing rebounded
from 0.1 to 0.7% while primary activities rebounded 0.6% after the 2.6 contraction which had
been recorded in Q4 of 2017. Generally, the average rate of GDP Growth in New Zealand was
0.64% from 1987 until 2018 and with the highest level of 2.80% in the Q3 of 1999 and the
lowest record -2.40% in the Q1 of 1991 (Petri and Plummer, 2016).
Cash Rates & Official Cash Rate (OCR)
Australia
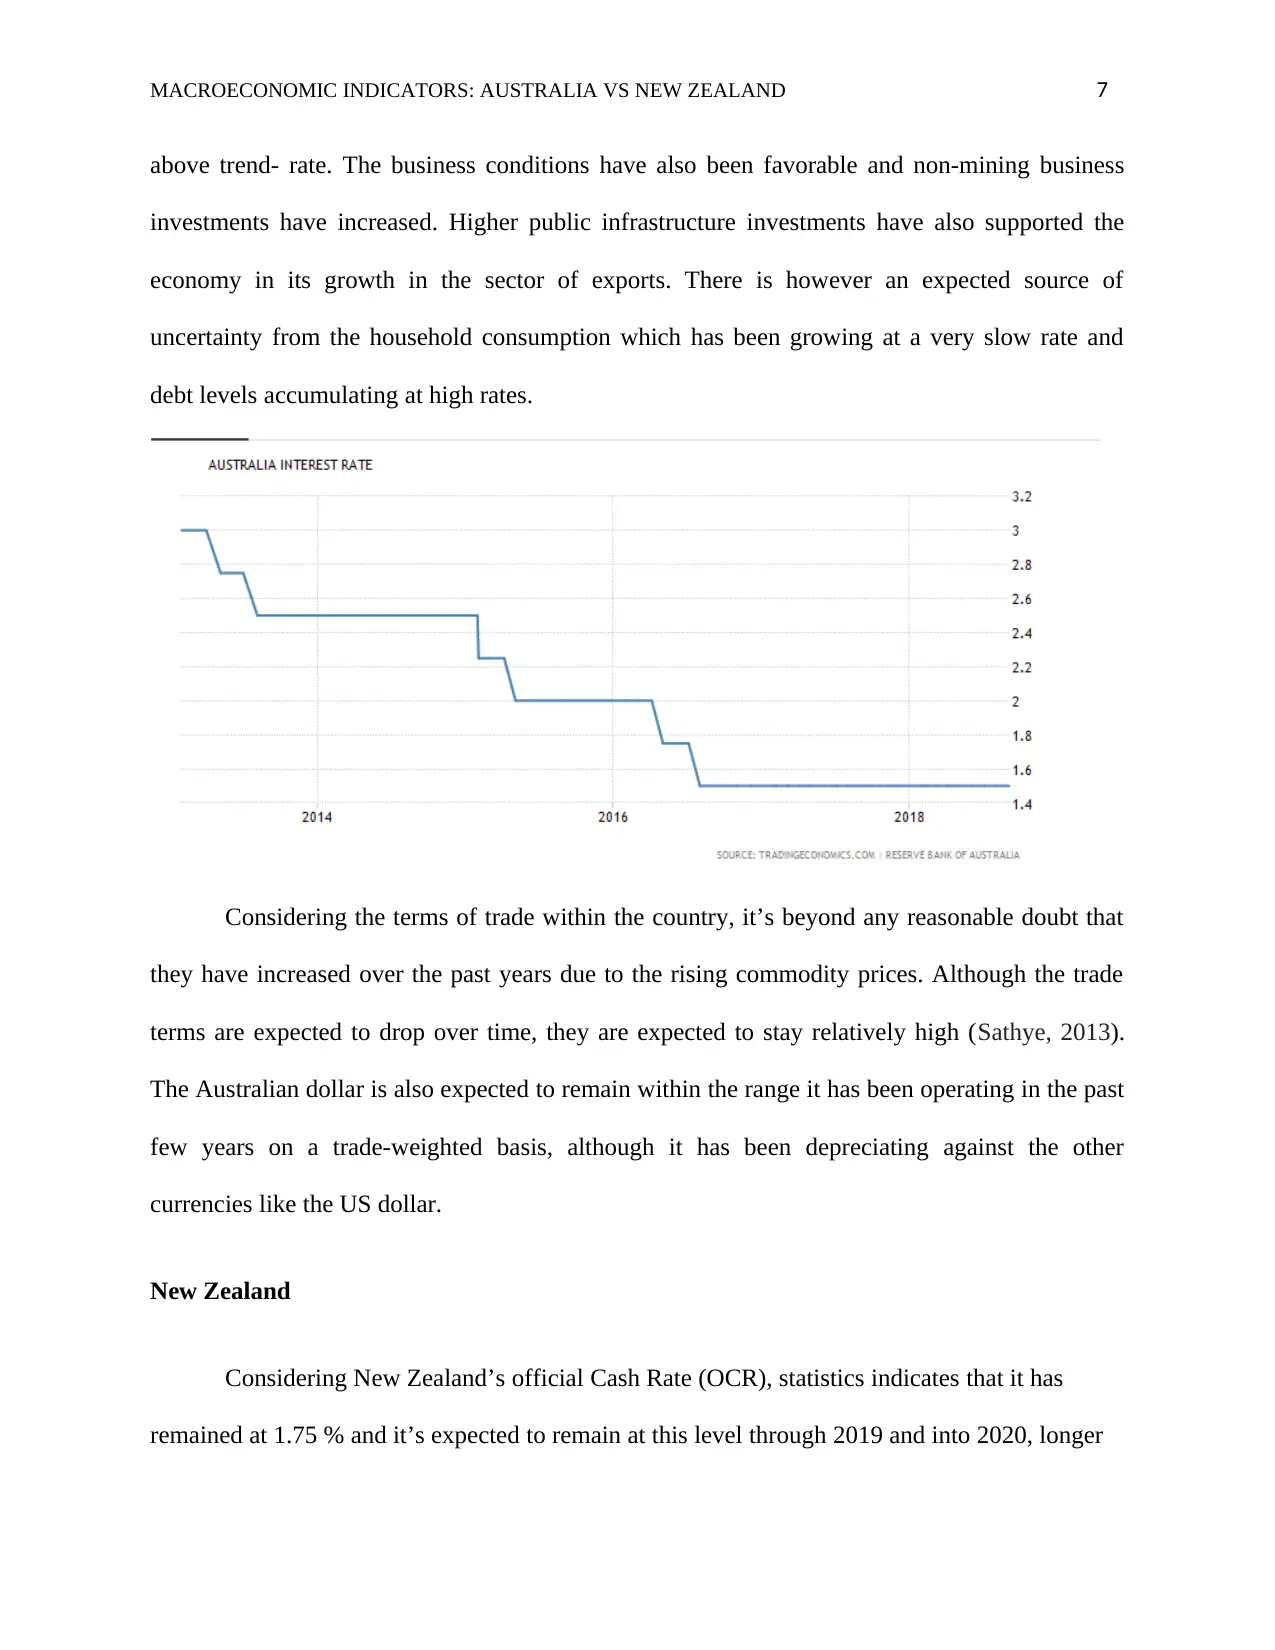
Reserve bank of Australia has maintained the record of the country’s cash rate at a low
percentage of 1.5% just as it was expected. This has extended its inaction record period beyond
two years, amidst low wage growth and weak inflation. The bank aimed at triggering the
country’s economy growth above 3% in 2018 and 2019 (Fang, Kosev and Wakeling, 2015,
p.30). Following this step, the first half of 2018 has seen the country’s economy grow at an
There were however some other sectors which did well. For instance, manufacturing rebounded
from 0.1 to 0.7% while primary activities rebounded 0.6% after the 2.6 contraction which had
been recorded in Q4 of 2017. Generally, the average rate of GDP Growth in New Zealand was
0.64% from 1987 until 2018 and with the highest level of 2.80% in the Q3 of 1999 and the
lowest record -2.40% in the Q1 of 1991 (Petri and Plummer, 2016).
Cash Rates & Official Cash Rate (OCR)
Australia
Reserve bank of Australia has maintained the record of the country’s cash rate at a low
percentage of 1.5% just as it was expected. This has extended its inaction record period beyond
two years, amidst low wage growth and weak inflation. The bank aimed at triggering the
country’s economy growth above 3% in 2018 and 2019 (Fang, Kosev and Wakeling, 2015,
p.30). Following this step, the first half of 2018 has seen the country’s economy grow at an
⊘ This is a preview!⊘
Do you want full access?
Subscribe today to unlock all pages.
Trusted by 1+ million students worldwide
MACROECONOMIC INDICATORS: AUSTRALIA VS NEW ZEALAND 7
above trend- rate. The business conditions have also been favorable and non-mining business
investments have increased. Higher public infrastructure investments have also supported the
economy in its growth in the sector of exports. There is however an expected source of
uncertainty from the household consumption which has been growing at a very slow rate and
debt levels accumulating at high rates.
Considering the terms of trade within the country, it’s beyond any reasonable doubt that
they have increased over the past years due to the rising commodity prices. Although the trade
terms are expected to drop over time, they are expected to stay relatively high (Sathye, 2013).
The Australian dollar is also expected to remain within the range it has been operating in the past
few years on a trade-weighted basis, although it has been depreciating against the other
currencies like the US dollar.
New Zealand
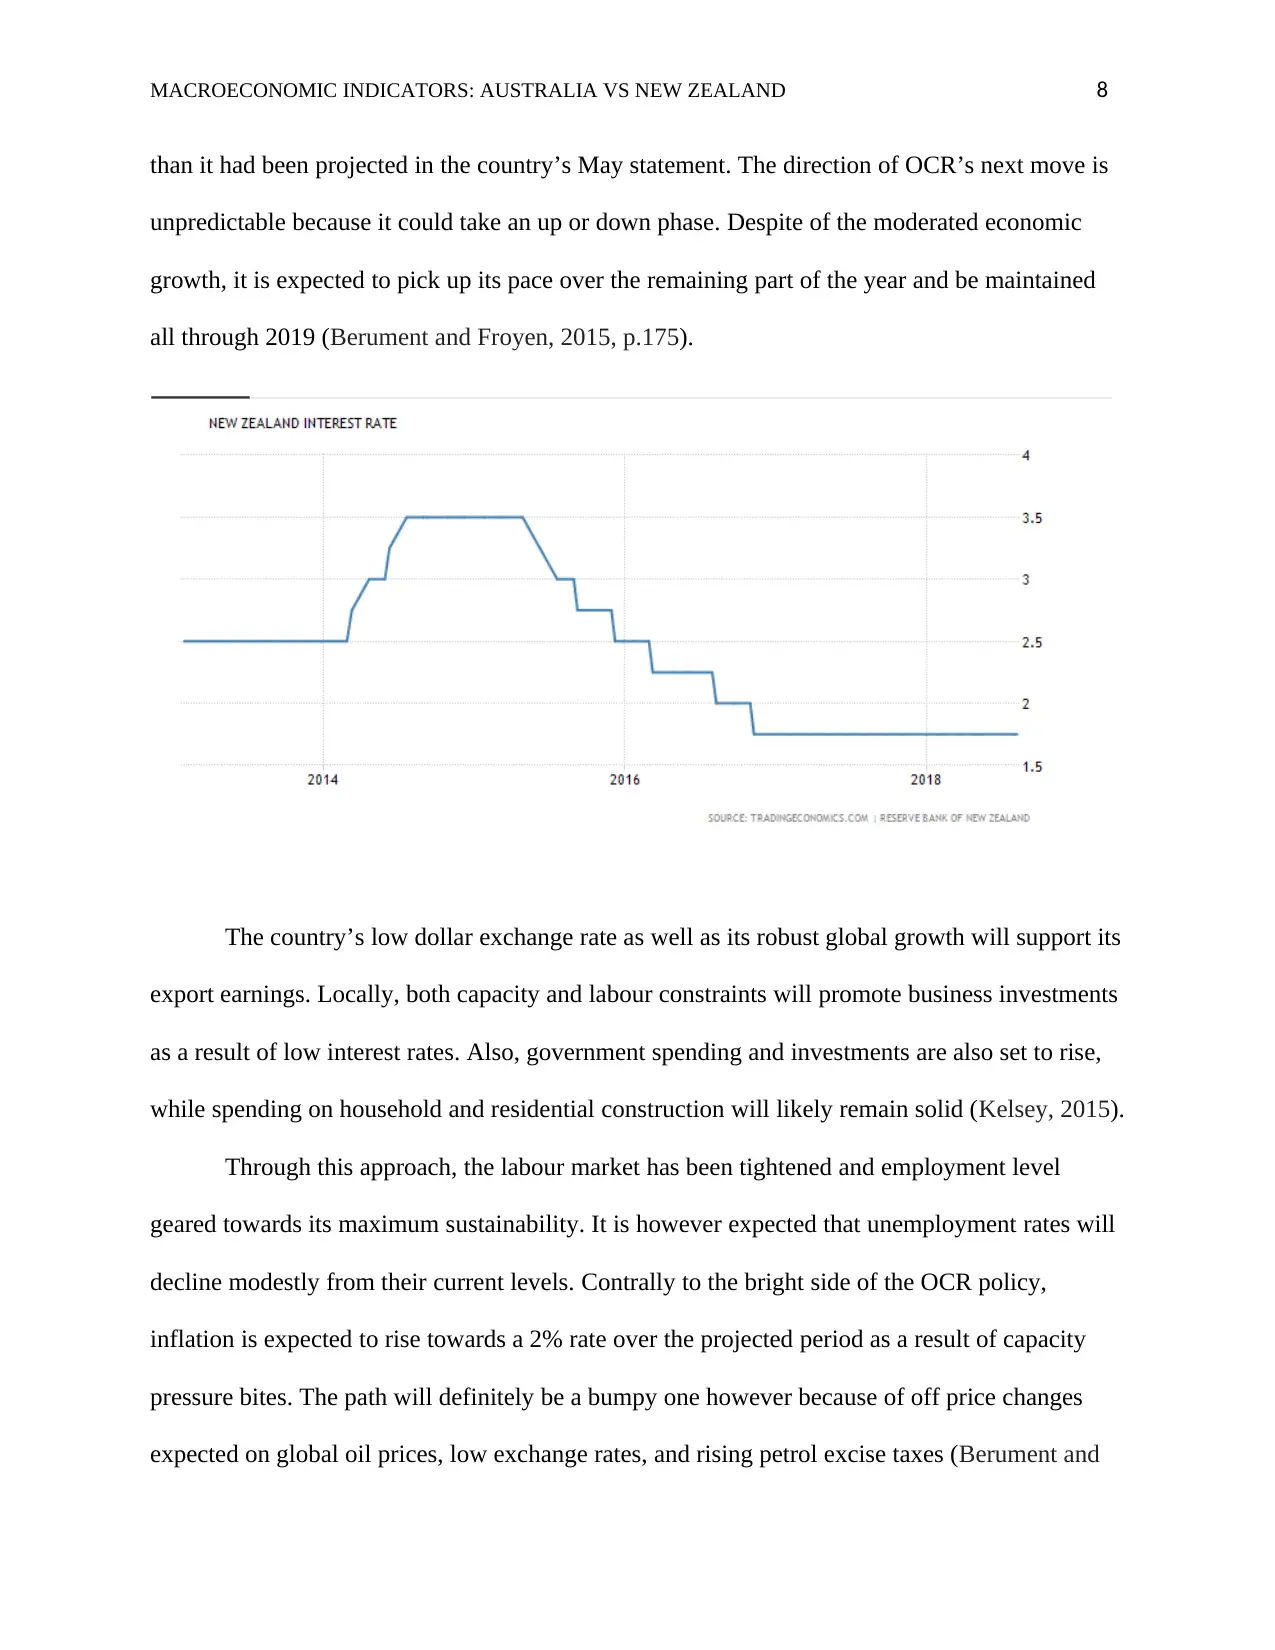
Considering New Zealand’s official Cash Rate (OCR), statistics indicates that it has
remained at 1.75 % and it’s expected to remain at this level through 2019 and into 2020, longer
above trend- rate. The business conditions have also been favorable and non-mining business
investments have increased. Higher public infrastructure investments have also supported the
economy in its growth in the sector of exports. There is however an expected source of
uncertainty from the household consumption which has been growing at a very slow rate and
debt levels accumulating at high rates.
Considering the terms of trade within the country, it’s beyond any reasonable doubt that
they have increased over the past years due to the rising commodity prices. Although the trade
terms are expected to drop over time, they are expected to stay relatively high (Sathye, 2013).
The Australian dollar is also expected to remain within the range it has been operating in the past
few years on a trade-weighted basis, although it has been depreciating against the other
currencies like the US dollar.
New Zealand
Considering New Zealand’s official Cash Rate (OCR), statistics indicates that it has
remained at 1.75 % and it’s expected to remain at this level through 2019 and into 2020, longer
Paraphrase This Document
Need a fresh take? Get an instant paraphrase of this document with our AI Paraphraser
MACROECONOMIC INDICATORS: AUSTRALIA VS NEW ZEALAND 8
than it had been projected in the country’s May statement. The direction of OCR’s next move is
unpredictable because it could take an up or down phase. Despite of the moderated economic
growth, it is expected to pick up its pace over the remaining part of the year and be maintained
all through 2019 (Berument and Froyen, 2015, p.175).
The country’s low dollar exchange rate as well as its robust global growth will support its
export earnings. Locally, both capacity and labour constraints will promote business investments
as a result of low interest rates. Also, government spending and investments are also set to rise,
while spending on household and residential construction will likely remain solid (Kelsey, 2015).
Through this approach, the labour market has been tightened and employment level
geared towards its maximum sustainability. It is however expected that unemployment rates will
decline modestly from their current levels. Contrally to the bright side of the OCR policy,
inflation is expected to rise towards a 2% rate over the projected period as a result of capacity
pressure bites. The path will definitely be a bumpy one however because of off price changes
expected on global oil prices, low exchange rates, and rising petrol excise taxes (Berument and
MACROECONOMIC INDICATORS: AUSTRALIA VS NEW ZEALAND 9
Froyen, 2015, p.175). There are also other risks to the central forecast of the country due to this
moderation. First, this will create low confidence in business that will in turn affect both
employment and investment decisions. Conversely, inflation rates are expected to rise faster due
to cost pressures.
Unemployment Rate
Australia
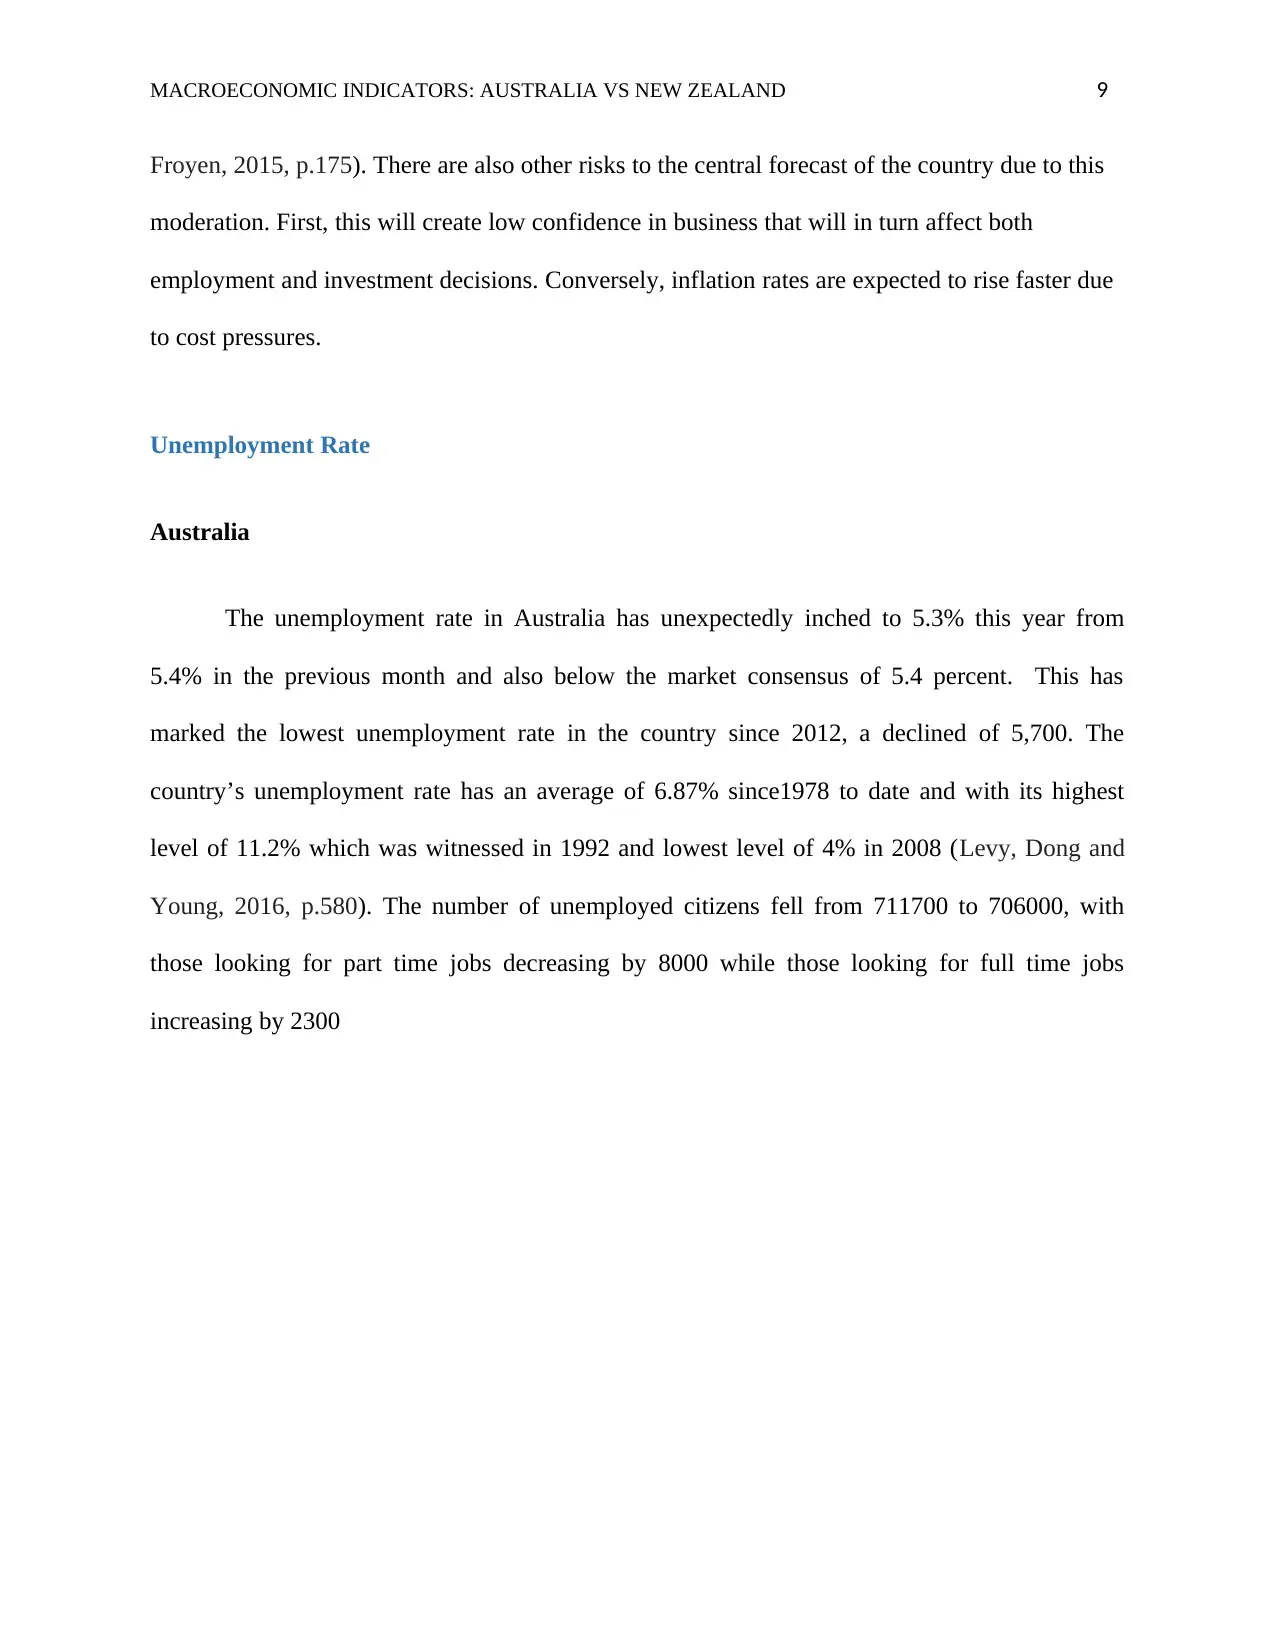
The unemployment rate in Australia has unexpectedly inched to 5.3% this year from
5.4% in the previous month and also below the market consensus of 5.4 percent. This has
marked the lowest unemployment rate in the country since 2012, a declined of 5,700. The
country’s unemployment rate has an average of 6.87% since1978 to date and with its highest
level of 11.2% which was witnessed in 1992 and lowest level of 4% in 2008 (Levy, Dong and
Young, 2016, p.580). The number of unemployed citizens fell from 711700 to 706000, with
those looking for part time jobs decreasing by 8000 while those looking for full time jobs
increasing by 2300
Froyen, 2015, p.175). There are also other risks to the central forecast of the country due to this
moderation. First, this will create low confidence in business that will in turn affect both
employment and investment decisions. Conversely, inflation rates are expected to rise faster due
to cost pressures.
Unemployment Rate
Australia
The unemployment rate in Australia has unexpectedly inched to 5.3% this year from
5.4% in the previous month and also below the market consensus of 5.4 percent. This has
marked the lowest unemployment rate in the country since 2012, a declined of 5,700. The
country’s unemployment rate has an average of 6.87% since1978 to date and with its highest
level of 11.2% which was witnessed in 1992 and lowest level of 4% in 2008 (Levy, Dong and
Young, 2016, p.580). The number of unemployed citizens fell from 711700 to 706000, with
those looking for part time jobs decreasing by 8000 while those looking for full time jobs
increasing by 2300
⊘ This is a preview!⊘
Do you want full access?
Subscribe today to unlock all pages.
Trusted by 1+ million students worldwide
MACROECONOMIC INDICATORS: AUSTRALIA VS NEW ZEALAND 10
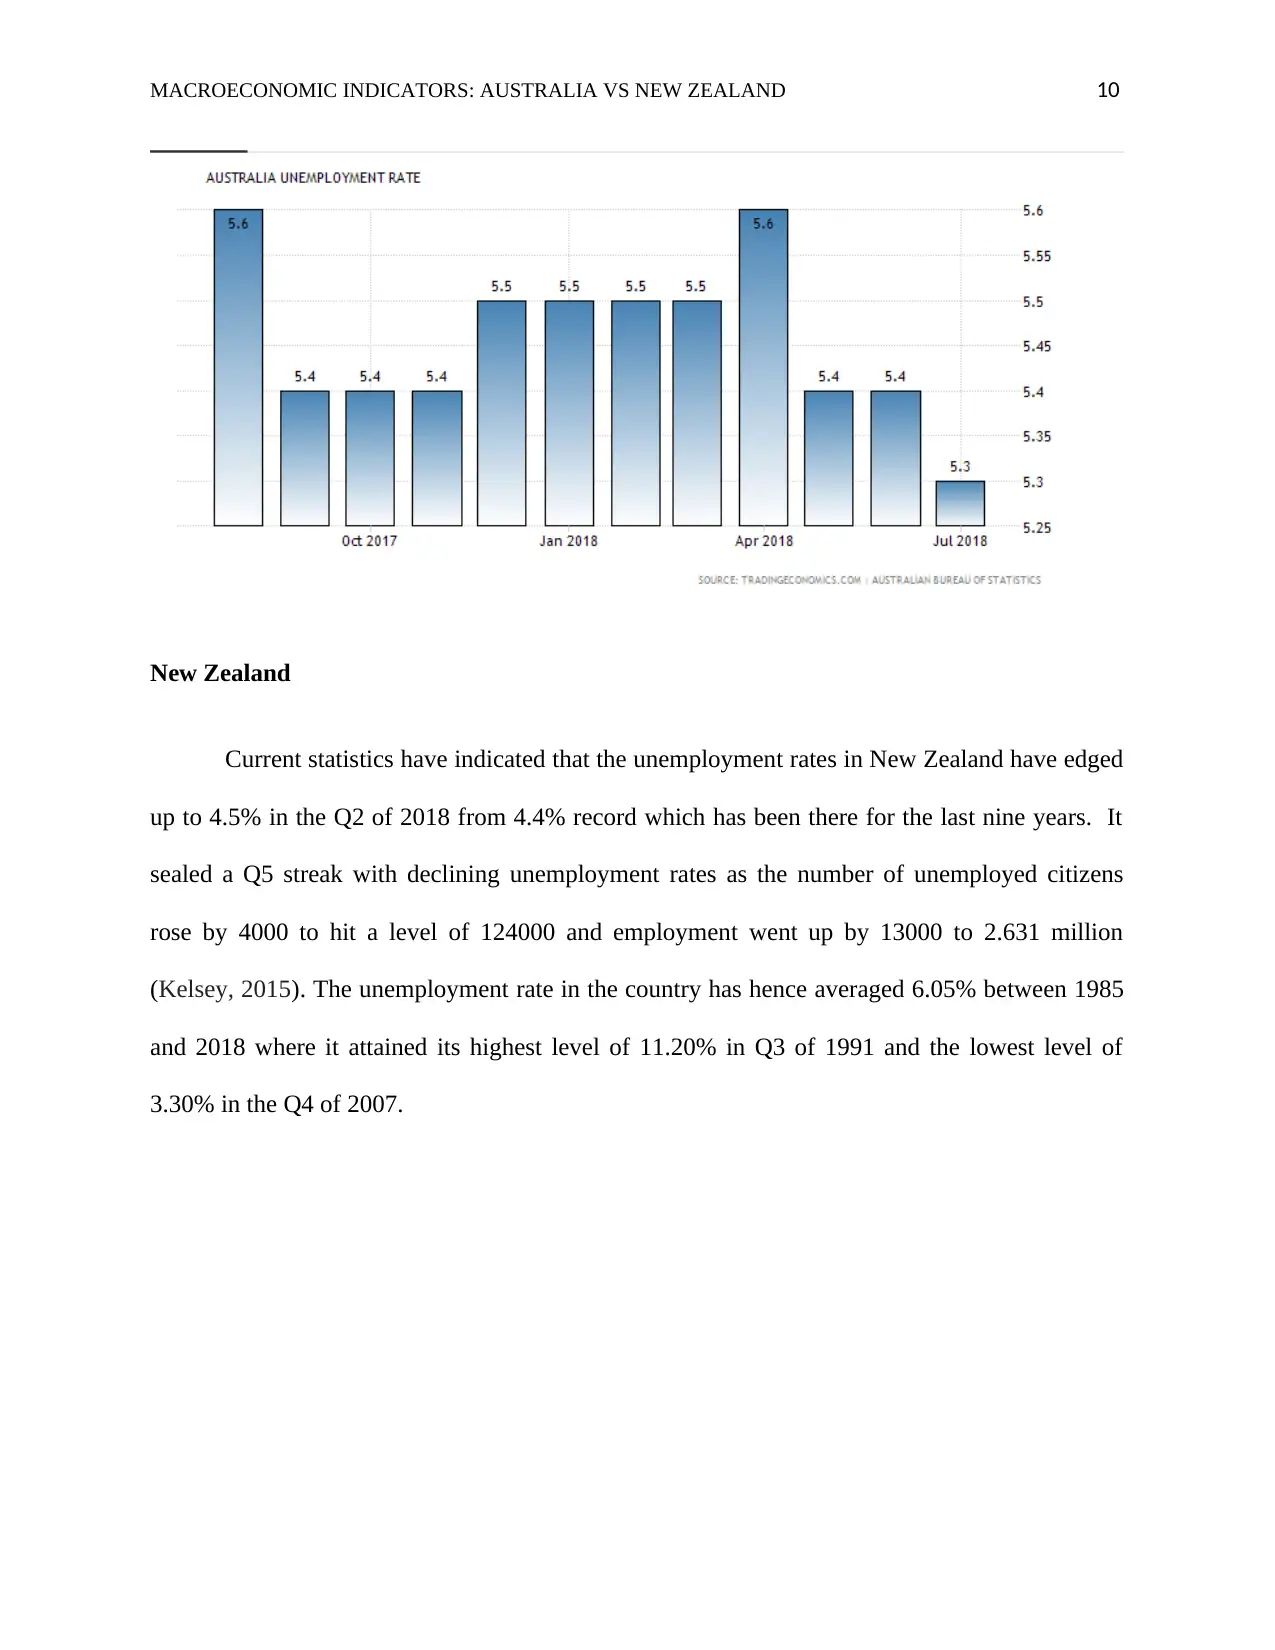
New Zealand
Current statistics have indicated that the unemployment rates in New Zealand have edged
up to 4.5% in the Q2 of 2018 from 4.4% record which has been there for the last nine years. It
sealed a Q5 streak with declining unemployment rates as the number of unemployed citizens
rose by 4000 to hit a level of 124000 and employment went up by 13000 to 2.631 million
(Kelsey, 2015). The unemployment rate in the country has hence averaged 6.05% between 1985
and 2018 where it attained its highest level of 11.20% in Q3 of 1991 and the lowest level of
3.30% in the Q4 of 2007.
Paraphrase This Document
Need a fresh take? Get an instant paraphrase of this document with our AI Paraphraser
MACROECONOMIC INDICATORS: AUSTRALIA VS NEW ZEALAND 11
Inflation Rates
Australia
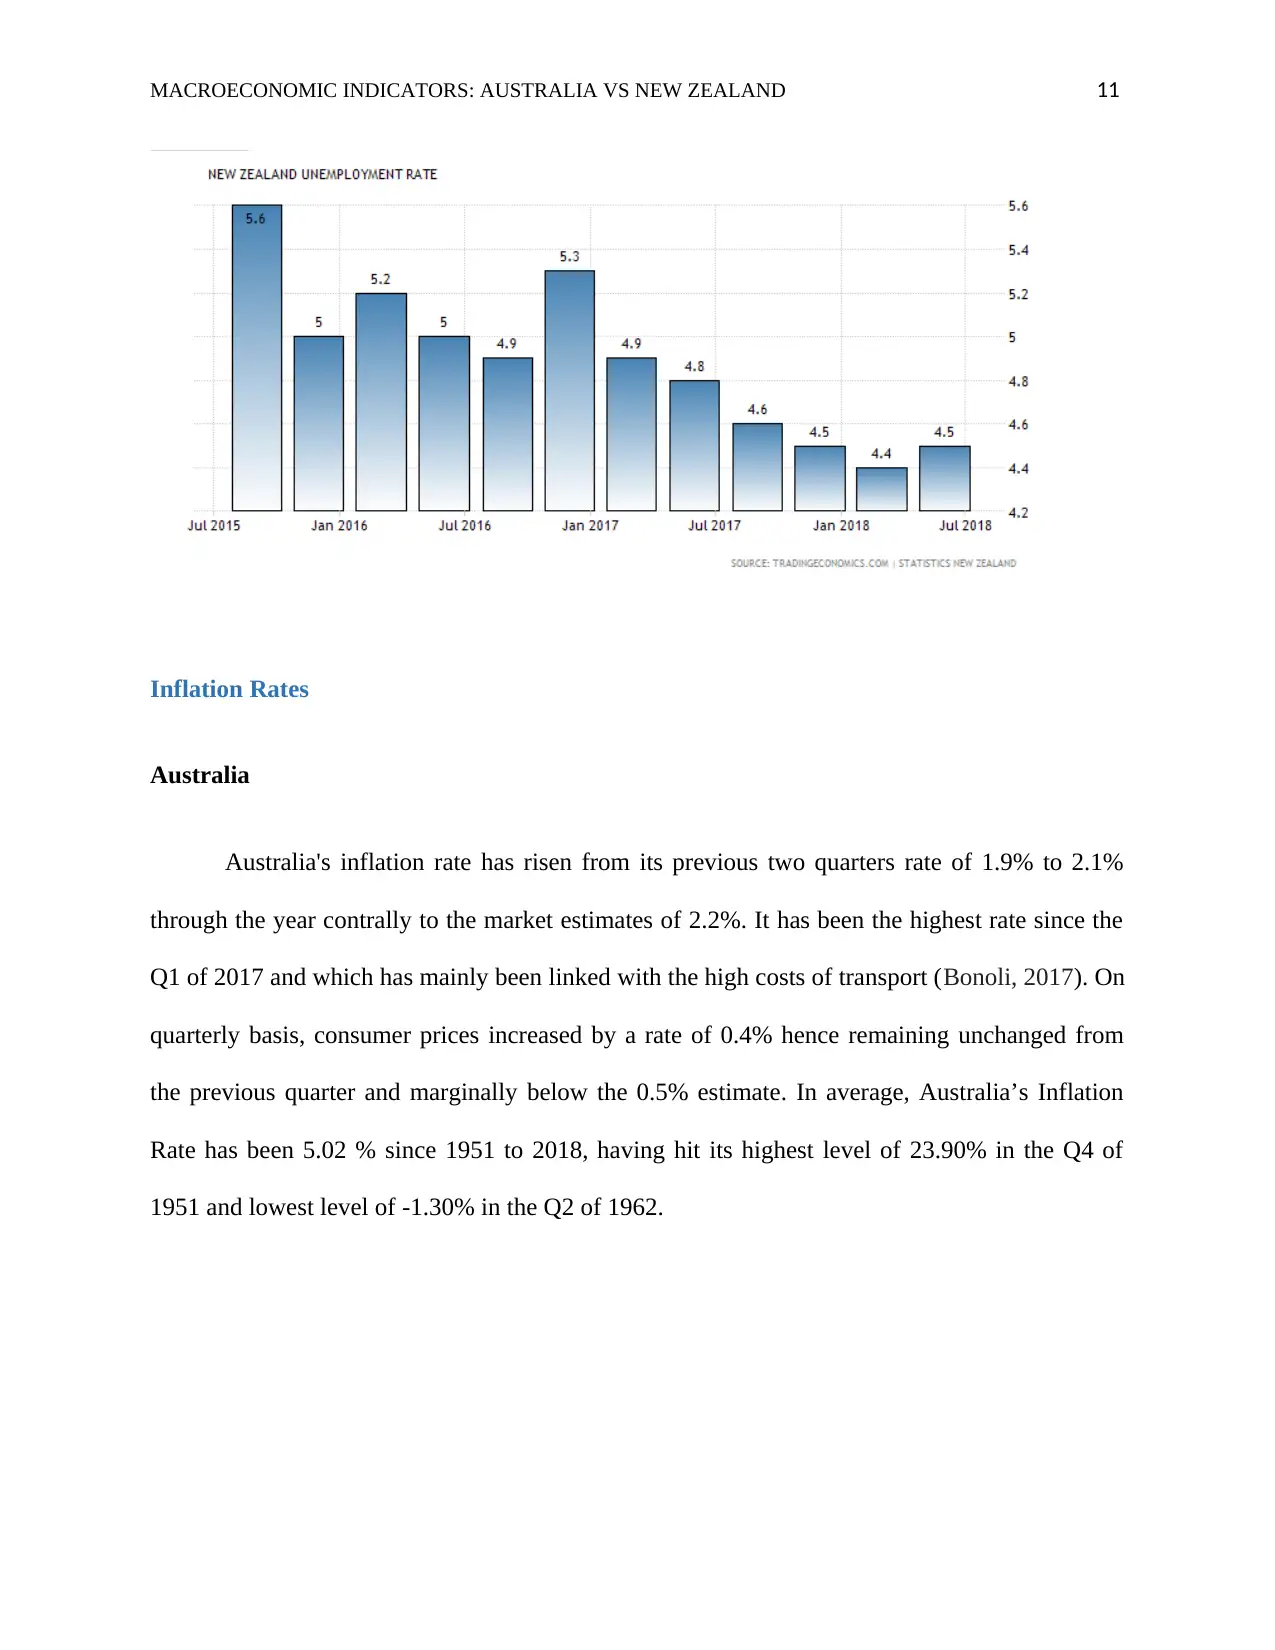
Australia's inflation rate has risen from its previous two quarters rate of 1.9% to 2.1%
through the year contrally to the market estimates of 2.2%. It has been the highest rate since the
Q1 of 2017 and which has mainly been linked with the high costs of transport (Bonoli, 2017). On
quarterly basis, consumer prices increased by a rate of 0.4% hence remaining unchanged from
the previous quarter and marginally below the 0.5% estimate. In average, Australia’s Inflation
Rate has been 5.02 % since 1951 to 2018, having hit its highest level of 23.90% in the Q4 of
1951 and lowest level of -1.30% in the Q2 of 1962.
Inflation Rates
Australia
Australia's inflation rate has risen from its previous two quarters rate of 1.9% to 2.1%
through the year contrally to the market estimates of 2.2%. It has been the highest rate since the
Q1 of 2017 and which has mainly been linked with the high costs of transport (Bonoli, 2017). On
quarterly basis, consumer prices increased by a rate of 0.4% hence remaining unchanged from
the previous quarter and marginally below the 0.5% estimate. In average, Australia’s Inflation
Rate has been 5.02 % since 1951 to 2018, having hit its highest level of 23.90% in the Q4 of
1951 and lowest level of -1.30% in the Q2 of 1962.
MACROECONOMIC INDICATORS: AUSTRALIA VS NEW ZEALAND 12
Transport costs have been increasing by 5.2% annually from the Q2 of the 2017 which
has been driven by the increased automotive fuel prices and which increased by a rate of 11%
(Bidargaddi et al, 2015, p.16). Also, this high rate of inflation was contributed by the increased
prices of alcohol and tobacco by a rate of 0.8%; recreation and culture by 0.2%; education by
0.1%; and insurance and financial services by 0.5%. On the other hand, some of the sectors
which tried to adjust these escalated rates include food and non-alcoholic beverages by 0.2%;
housing by 0.2%; and health by 0.8%.
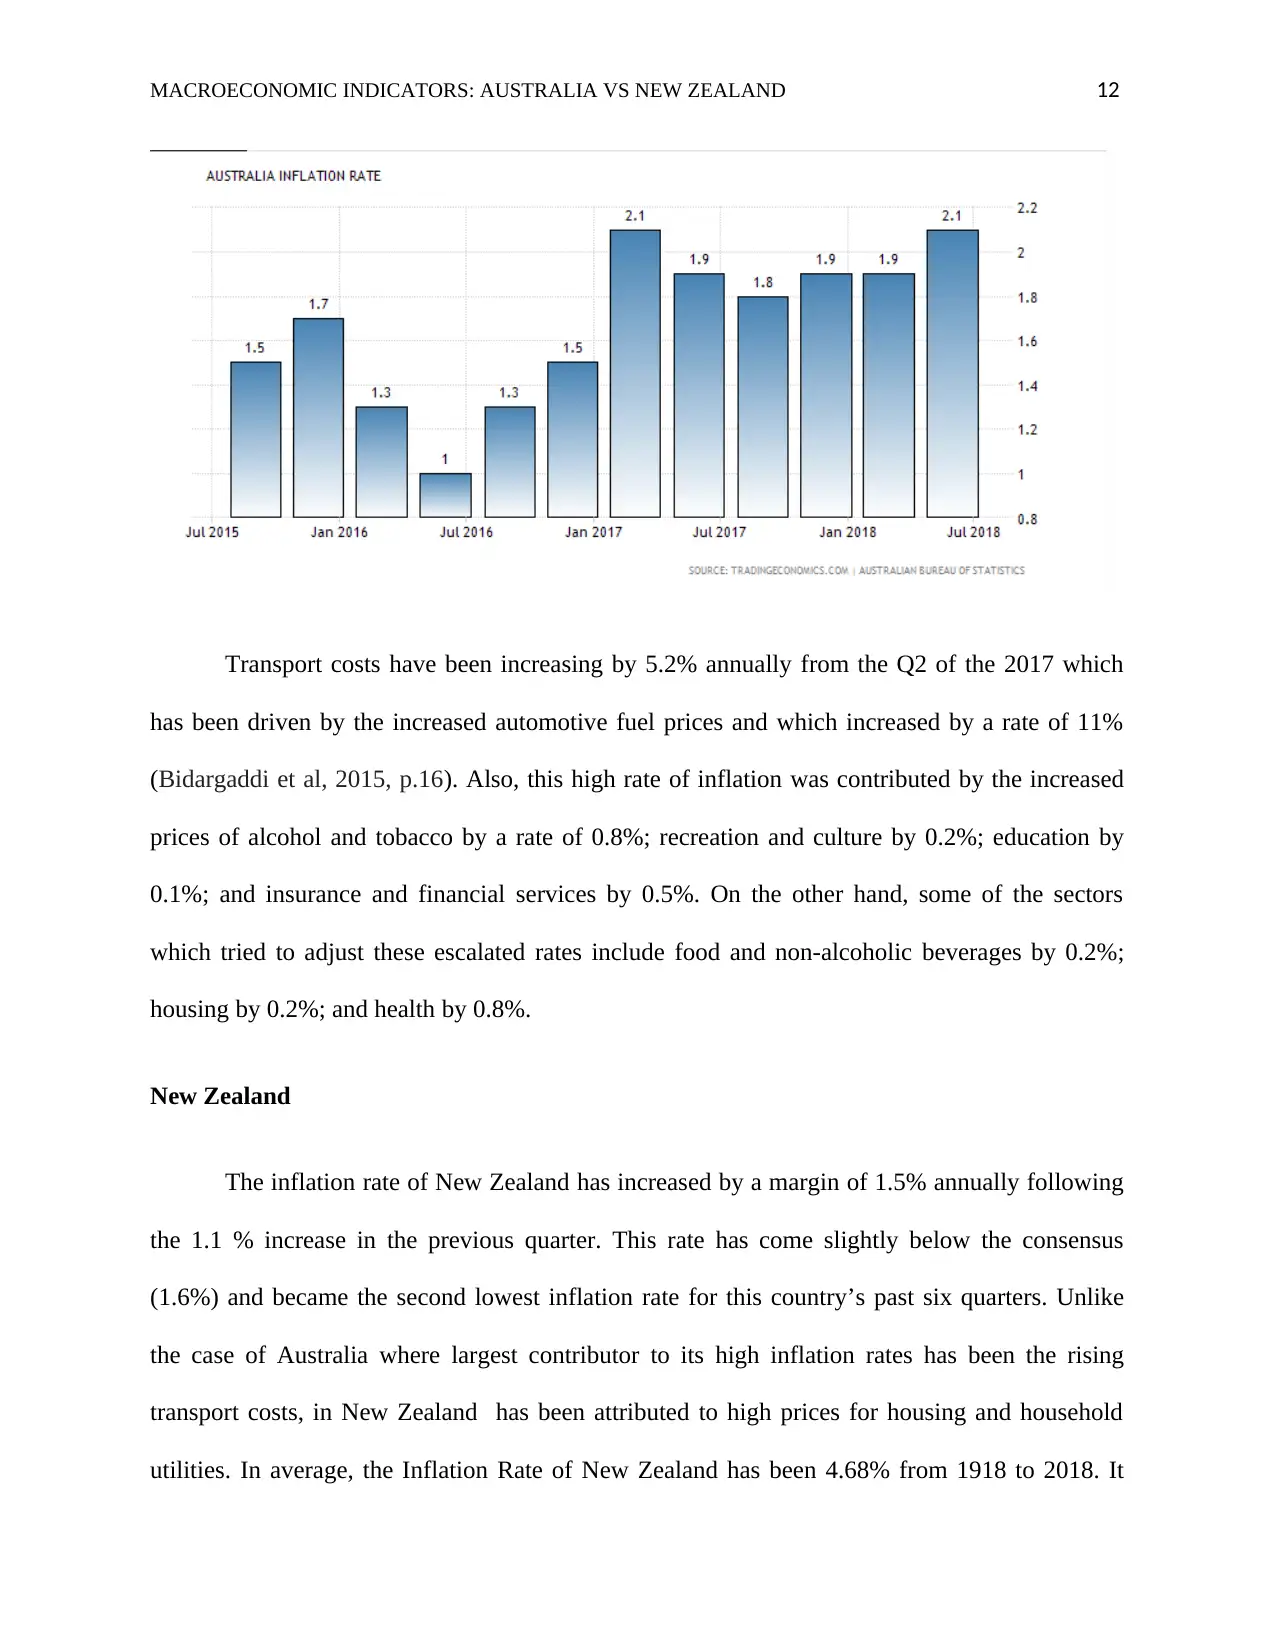
New Zealand
The inflation rate of New Zealand has increased by a margin of 1.5% annually following
the 1.1 % increase in the previous quarter. This rate has come slightly below the consensus
(1.6%) and became the second lowest inflation rate for this country’s past six quarters. Unlike
the case of Australia where largest contributor to its high inflation rates has been the rising
transport costs, in New Zealand has been attributed to high prices for housing and household
utilities. In average, the Inflation Rate of New Zealand has been 4.68% from 1918 to 2018. It
Transport costs have been increasing by 5.2% annually from the Q2 of the 2017 which
has been driven by the increased automotive fuel prices and which increased by a rate of 11%
(Bidargaddi et al, 2015, p.16). Also, this high rate of inflation was contributed by the increased
prices of alcohol and tobacco by a rate of 0.8%; recreation and culture by 0.2%; education by
0.1%; and insurance and financial services by 0.5%. On the other hand, some of the sectors
which tried to adjust these escalated rates include food and non-alcoholic beverages by 0.2%;
housing by 0.2%; and health by 0.8%.
New Zealand
The inflation rate of New Zealand has increased by a margin of 1.5% annually following
the 1.1 % increase in the previous quarter. This rate has come slightly below the consensus
(1.6%) and became the second lowest inflation rate for this country’s past six quarters. Unlike
the case of Australia where largest contributor to its high inflation rates has been the rising
transport costs, in New Zealand has been attributed to high prices for housing and household
utilities. In average, the Inflation Rate of New Zealand has been 4.68% from 1918 to 2018. It
⊘ This is a preview!⊘
Do you want full access?
Subscribe today to unlock all pages.
Trusted by 1+ million students worldwide
1 out of 22
Related Documents


Your All-in-One AI-Powered Toolkit for Academic Success.
+13062052269
info@desklib.com
Available 24*7 on WhatsApp / Email
![[object Object]](/_next/static/media/star-bottom.7253800d.svg)
Unlock your academic potential
Copyright © 2020–2026 A2Z Services. All Rights Reserved. Developed and managed by ZUCOL.