Economics Assignment: Macroeconomic Analysis of Northern Virginia
VerifiedAdded on 2022/10/01
|19
|3870
|29
Case Study
AI Summary
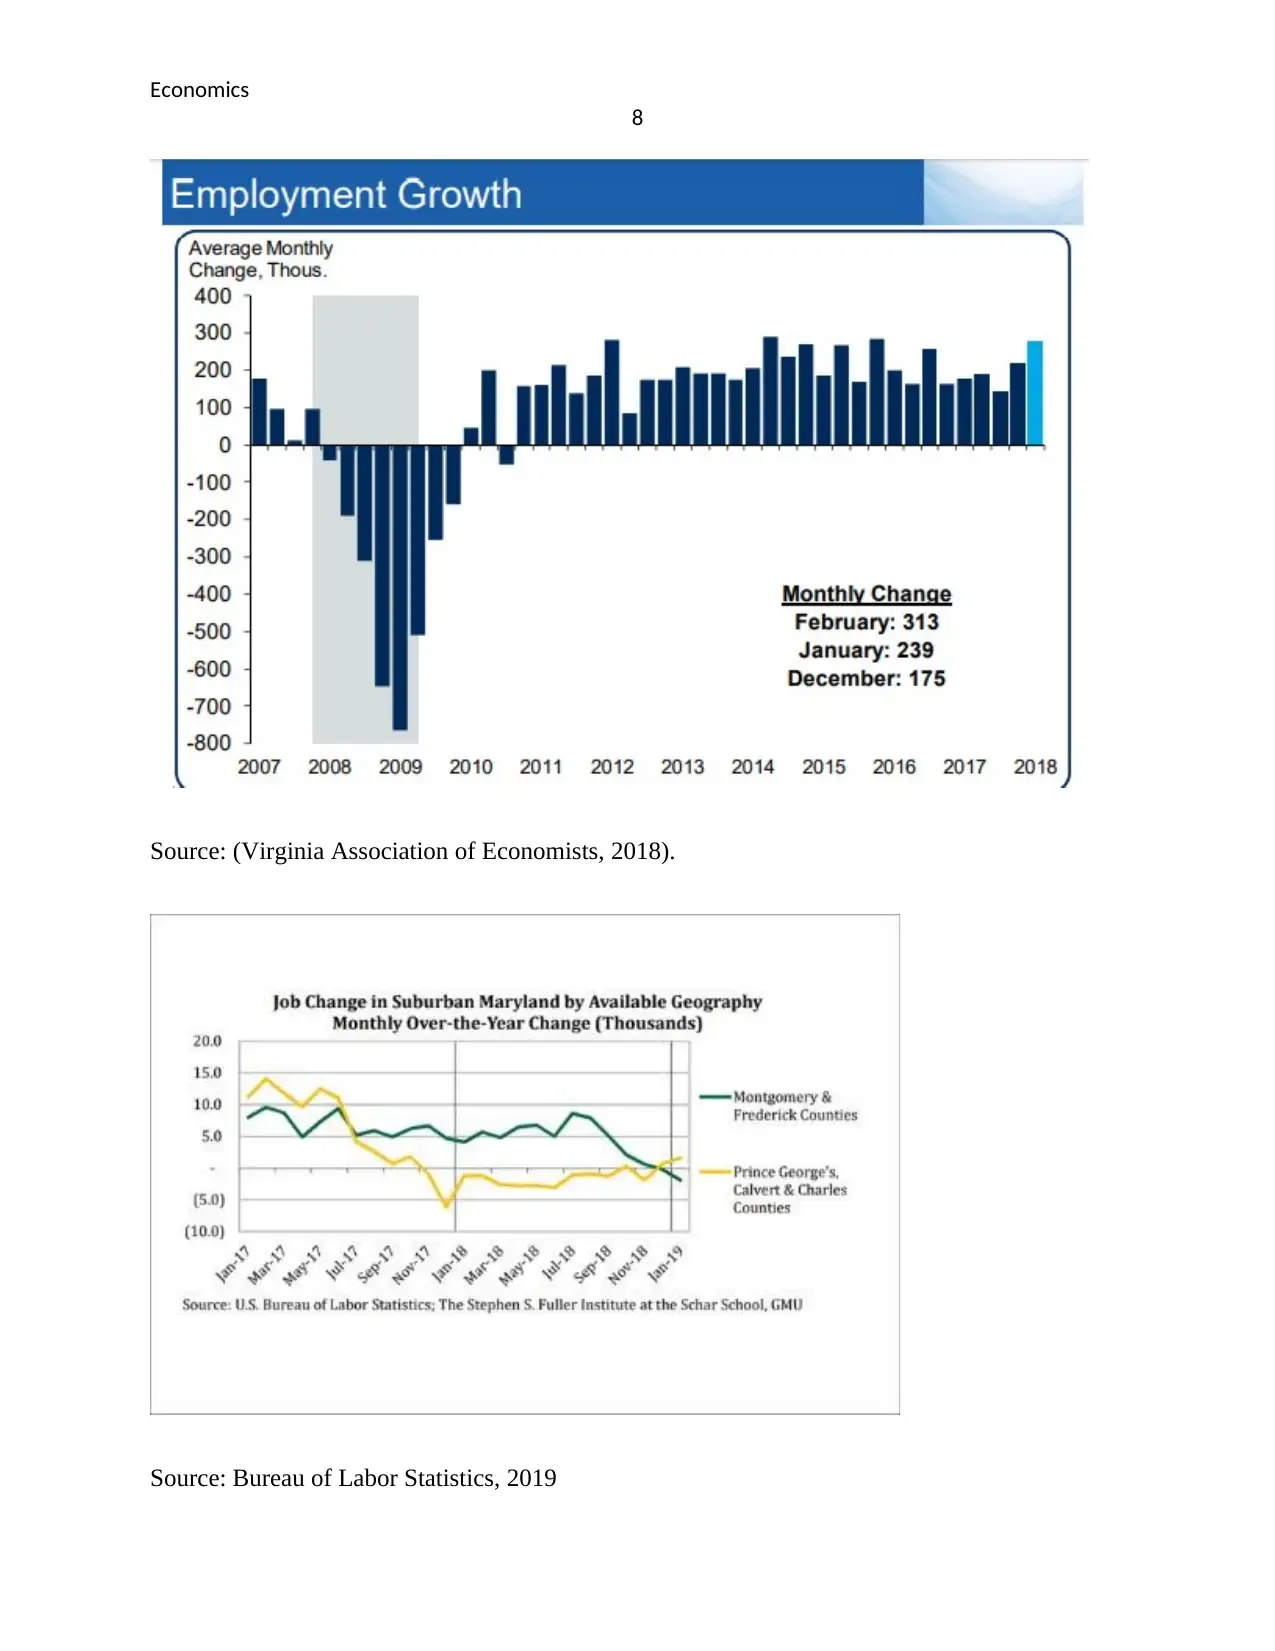
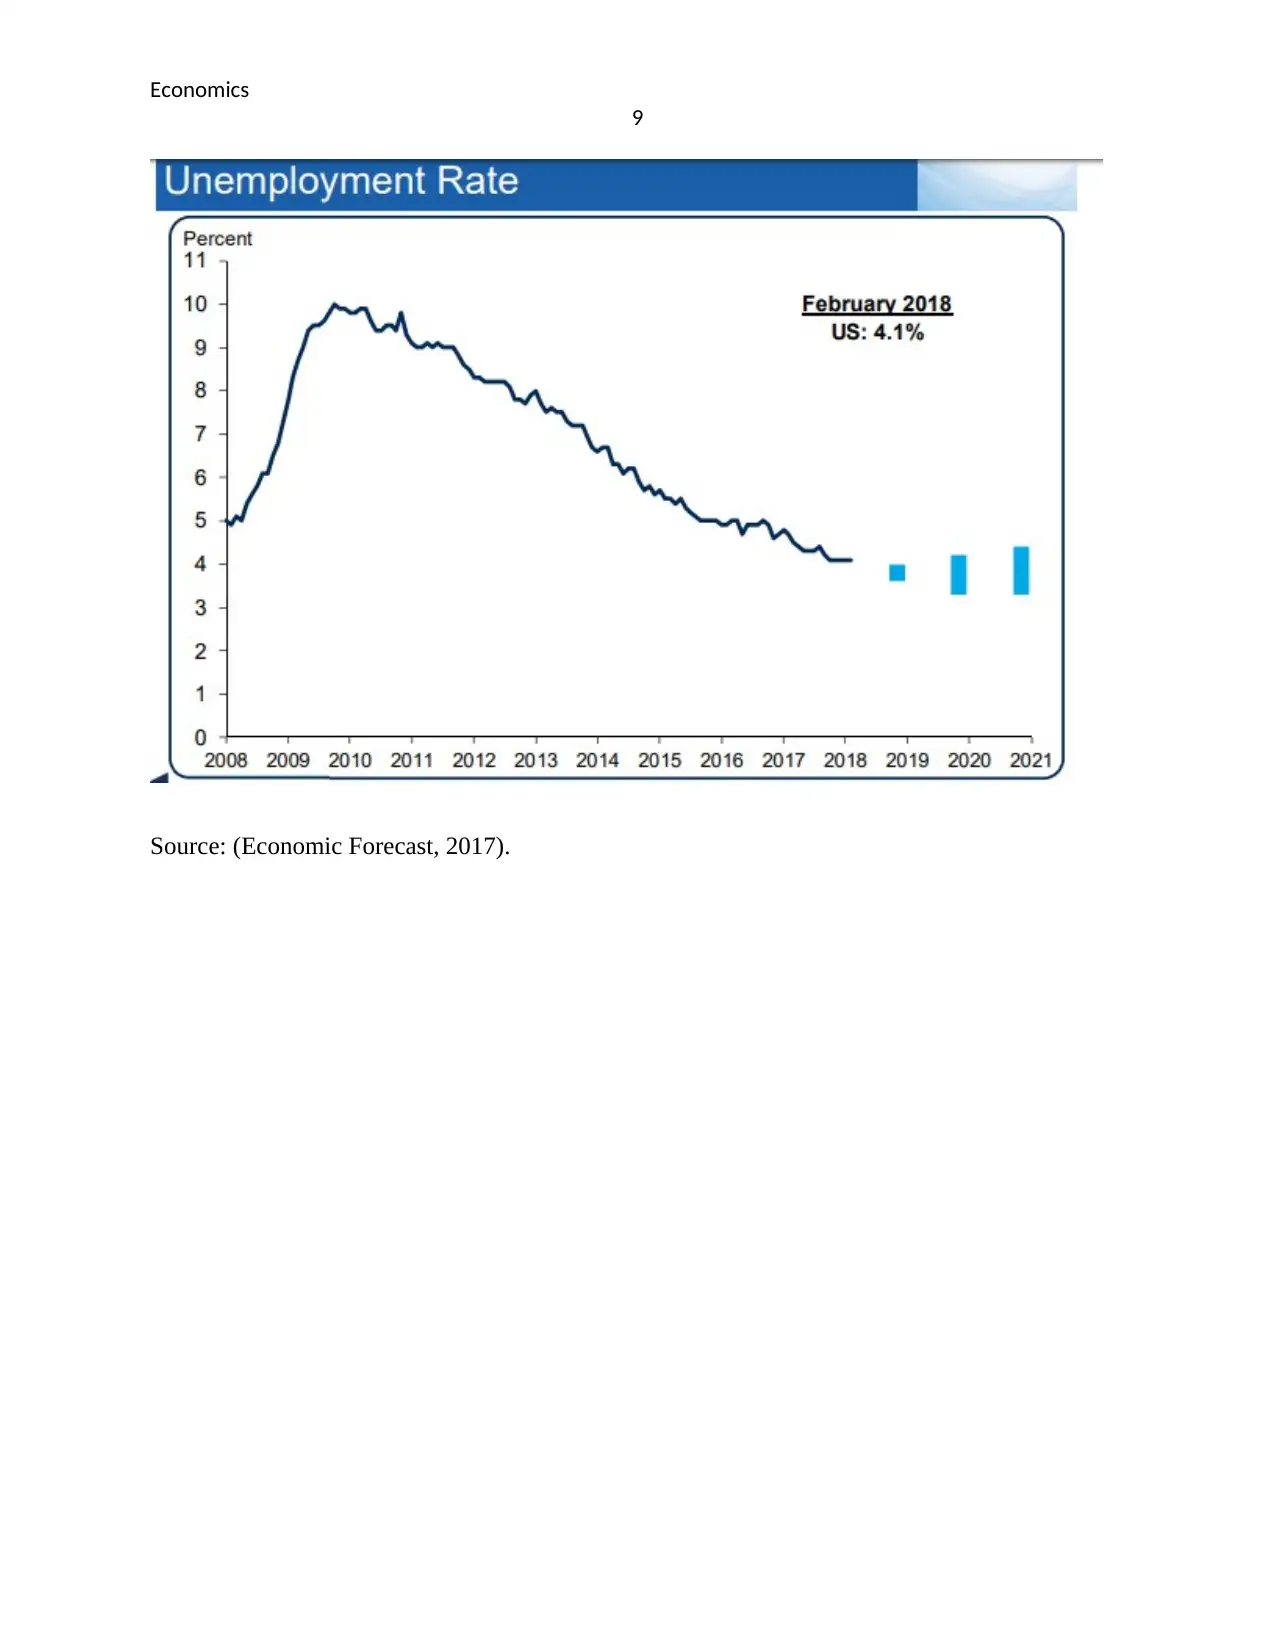
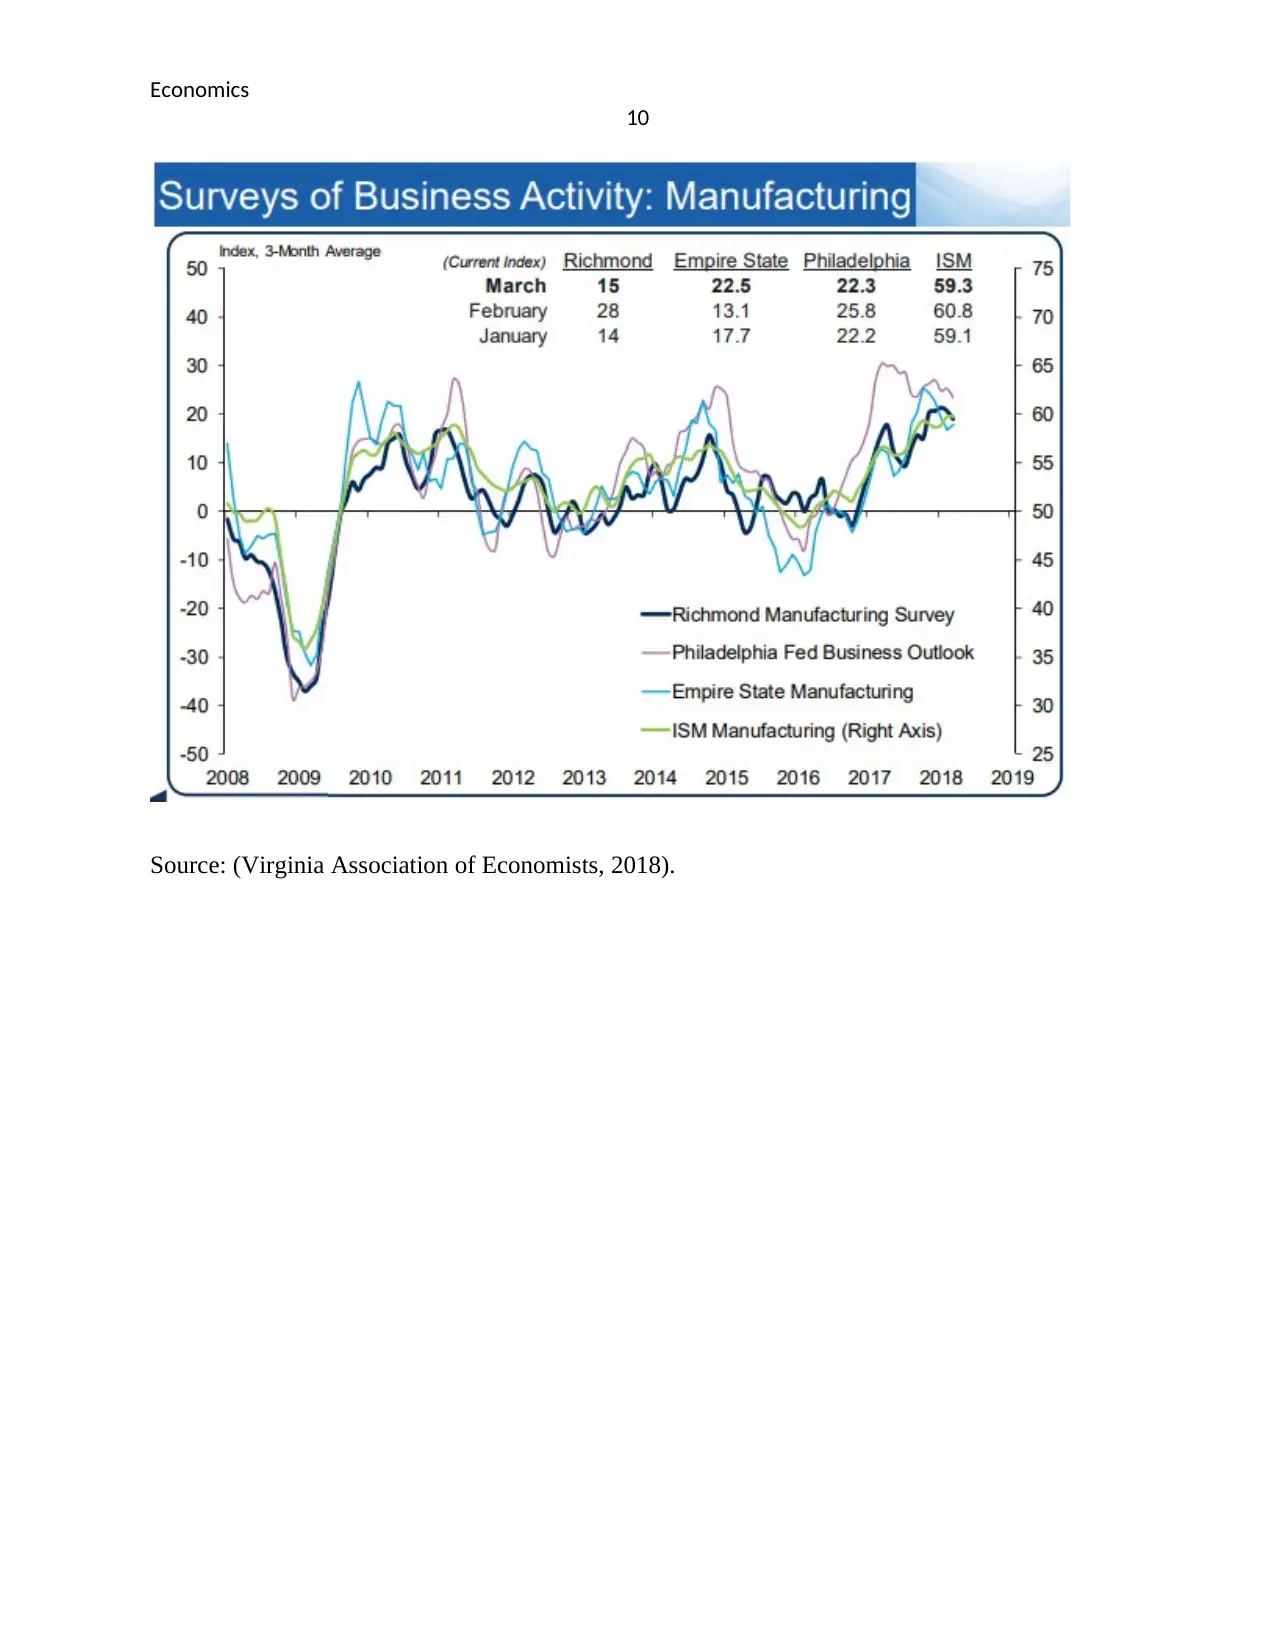
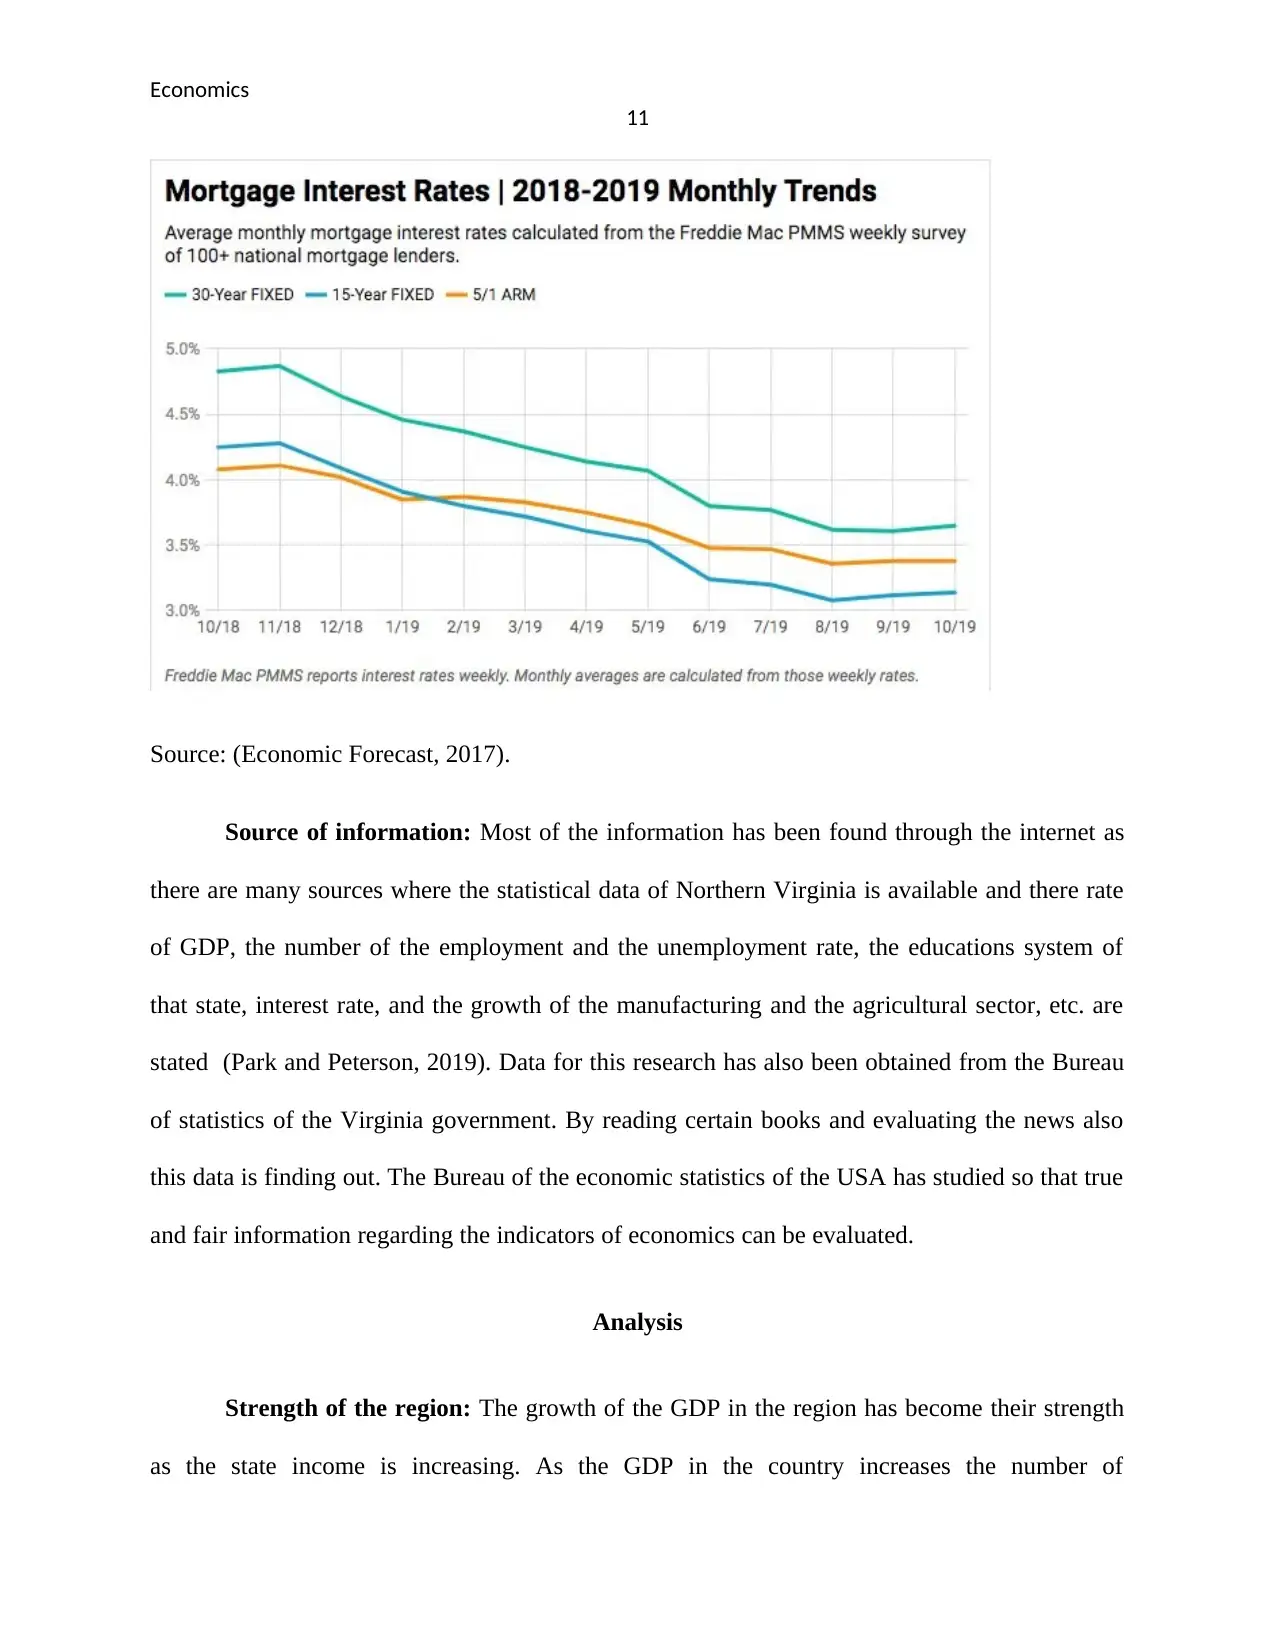
This economics case study provides a comprehensive macroeconomic analysis of Northern Virginia, USA. The study examines key indicators including GDP, employment rates, interest rates, manufacturing, and agriculture, offering insights into the region's economic strengths, challenges, and opportunities. The analysis includes data collection from both quantitative and qualitative sources, with statistical methods applied to evaluate trends in GDP, employment, education, interest rates, and sectoral growth. The report highlights the increasing GDP and diverse income sources as strengths, while identifying unemployment and higher interest rates as challenges. The study also identifies key driving industries such as manufacturing, construction, and financial services, and the role of agriculture. The case study concludes with an overview of the region's economic landscape, providing a valuable resource for understanding the dynamics of Northern Virginia's economy.

Running Head: Economics
0
Northern Virginia, USA
Economics Assignment
Name of the author
E-mail Address of the author
Class Name
Professor’s Name
10/18/2019
0
Northern Virginia, USA
Economics Assignment
Name of the author
E-mail Address of the author
Class Name
Professor’s Name
10/18/2019
Paraphrase This Document
Need a fresh take? Get an instant paraphrase of this document with our AI Paraphraser

Economics
1
Contents
Introduction......................................................................................................................................2
Macroeconomic indicators...............................................................................................................2
Data collection and Analysis...........................................................................................................4
Analysis.........................................................................................................................................10
Solution..........................................................................................................................................11
Conclusion.....................................................................................................................................12
References......................................................................................................................................13

Economics
2
Introduction
Northern Virginia is the state of the United States which is compromises of the several
countries in the USA. It is the most populated region of Virginia which has many residents and
the Washington metropolitan area. It is the highest-income region with a larger job base (Czech,
2013). This state is located on the Virginia side of the Washington- Baltimore-Arlington. The
population of the Northern Virginia is 31.5 lakhs in 2018 and GDP per capita of this region is
$54,244. The countries which are consisting of this region are the Fairfax, Arlington and Prince
William and some of the independent cities are the Manassas Park, Falls Church, Alexandria,
etc. The five indicators which will be analyzed in this report are GDP, Employment indicators,
interest rates, education indicators, manufacturing and agricultural indicators.
There are certain challenges which were faced by the country such as the rate of
unemployment in certain sectors of the region has caused the biggest challenge for Northern
Virginia. The actual and the potential output was declining due to the unemployment which
causes many problems in the societies so the study of the major macroeconomic indicators will
be done in this report so that the major industries of the region can be identified. The income
class of the region of Northern Virginia will increase which helps in increasing the prosperity of
the nation which is the strength of the nation (Sohrab, et al., 2019).
Macroeconomic indicators
The macroeconomic indicators of the state’s Northern Virginia, USA are stated below:
GDP: The GDP of the state has increased from 2.2%. The data of GDP per capita in the
years 2018 was $55258 and in the years 2019, it was forecasted that it will be around $55786.
⊘ This is a preview!⊘
Do you want full access?
Subscribe today to unlock all pages.

Trusted by 1+ million students worldwide

Economics
3
The GDP of this state will increase from the last years. The GDP of Virginia is the largest
economy in the nation and has ranked 12th as it represents 3% of US GDP (Wyner, 2019).
Northern Virginia is the richest state in the USA as it has the sixth-highest per capita income. In
the year 2003, the personal per capita income of this state is $33671. As per the financial news
Northern Virginia is the 10 richest states in USA. In the last five years many changes have been
seen in the state as the GDP of the state has been increased by 3.69% in the last five years. As
there is a diverse source of income in the state so the economy is well maintained. Northern
Virginia is the dairy capital of the state and there are many professional government sectors such
as defense, software, communication, etc. (Lingle, 2019).
Employment indicators: As per the latest economic indicator report it was found that
the unemployment rate in the Fairfax Country has been increased to 2.7%. Over the month the
number of unemployed residents has increased from 16438 to 17047. In northern Virginia, the
rate of the seasonally adjusted unemployment has decreased from 0.1% as in February of 2018 it
was 3.4%. The non-payroll employment has increased in the Northern Virginian in March by
103000 (Post, 2019). The bureau of labor statistics of the US has observed the growth in the job
rate with an annual rate of 1.8% in March. Prior to the recession, the rate of job growth was
2.9%. The major jobs in Northern Virginia have been seen in professional business services,
mining, logging and construction, education and health services. The financial activities have the
largest employment which has increased the number of employment by 5.8% in 2018.
Interest rates: The current interest rate in Northern Virginia is 3.72%. The mortgage rate
differs as per the long and short term years. The Mortgage rate has been increasing in the year
Paraphrase This Document
Need a fresh take? Get an instant paraphrase of this document with our AI Paraphraser

Economics
4
2018 as it was 4.8% which has increased in the first quarter of 2019 by 4.9%. In the year 2019,
the rate of mortgage has increased gain as in quarter two it was 5% and in quarter three it was
5.2% (Post, 2019). As per the monthly trends of the mortgage interest rate, the rate of 30 years
fixed interest, 15 years fixed interest and 5/1 ARM has been declined from the survey of the
Freddie Mac OMMS. As per the market statistics of the year 2019, the average interest rate has
been increased as it was 4.85% as per the NVAR region, 4.25% as per the Fairfax County and
0.38% increment as pre the Fairfax City (Mitchell, et al., 2016).
Manufacturing sector: There is no such manufacturing sector or companies in Northern
Virginia but the manufacturing of Tobacco is the most valuable product which is manufactured.
For the manufacturing of the chemicals like synthetic fibers and the pharmaceuticals, etc. the
Northern Virginia was ranked second most valuable group. In the economy of the USA, the
manufacturing sector of the state has put lots of contribution and it is one of the most important
components of the GDP (Wu and Xu, 2018). As per the Bureau of labor statistics, the major jobs
have been getting to the employees from the manufacturing sector only. In the state of northern
Virginia, the manufacturing doesn’t include commercial constructions and housing things. As
per the survey of the Richmond Manufacturing Survey, the growth in the manufacturing sector
has been increased in the state.
Agricultural sector: The basic products which are served in Northern Virginia were
milk, soybeans, grains, corn and the other nursery products. The state of northern Virginia is the
leader in the production of certain crops such as grapes to potatoes and tomatoes to apples. There
are also many other crops that were grown in Virginia such as wheat, hay, peanuts, cotton,

Economics
5
barley, etc. (Beer, et al., 2019). In fruits the major production has been seen in the apples and the
grapes. The harvested acres in Northern Virginia of apple is 9700 which production in tons is
$244. The values of the production in apples in dollars are 14433000 (Economics Group, 2019).
The major production has been seen of the tomato which is planted in acres of 2100. The
price per unit of the tomatoes in Northern Virginia was $67.9 whose value of production in
dollars is the 27774000 (Budget tax, 2018).
Education system: The population of Northern Virginia is increasing so the people over
there also prefer more high school diplomas which have increased from the last few years. The
percentage of the adults in northern Virginia who were studying the Bachelor’s degree or higher
level of degree of 2010-14 is 58%, Bachelor’s degree or higher level of degree 2000 is the 50%,
Higher school studies of 2010-14 are the highest which is around 92%. The education attainment
of the higher school 2000 is 85% in Northern Virginia. In the US departments Virginia is the ten
topmost states which are constantly ranking in the education system (Kuletz, 2016). There are
online sources that are also provided in Virginia state which has improved the department of the
education system.
Data collection and Analysis
The data collected for the above Economic indicators are from both quantitate sources
and the qualitative source.
Qualitative data: This data deals with the description of the characteristics of the
research which is made on the indicators of the economics (Nettels, 2017). This is the research
⊘ This is a preview!⊘
Do you want full access?
Subscribe today to unlock all pages.

Trusted by 1+ million students worldwide

Economics
6
that is done in evaluating the indicators of the economics of the state of Northern Virginia so that
their economy so their regional macroeconomic analysis can find out.
Quantitative data: The data which is served in this case study is all about numerical
things. So in this case study the statistical method is applicable and there are many numbers and
the values are identified to evaluate the In this data all the economic indicators which are
searched are dealt with the numbers which helps in measuring the actual data such as number if
GDP rates in the State of the Northern Virginia, the number of the employment and the
unemployment rate, the educations system of that state, interest rate, and the growth of the
manufacturing and the agricultural sector (Austin, et al., 2018).
Quantitative data helps in analyzing how much rate of certain economic indicators have
been increased from the last few years and how much changes have been occurred in the
economy of Northern Virginia. The rate of employment in the state with the average income can
be analyzed when the numerical data is presented so the research which is done for evaluating
the statistical economic indicators is quantitative research (Kolko, 2012). With the help of the
graph also the frequency data has been shown above.
Paraphrase This Document
Need a fresh take? Get an instant paraphrase of this document with our AI Paraphraser

Economics
7
Source: (Virginia Association of Economists, 2018).
7
Source: (Virginia Association of Economists, 2018).

Economics
8
Source: (Virginia Association of Economists, 2018).
Source: Bureau of Labor Statistics, 2019
8
Source: (Virginia Association of Economists, 2018).
Source: Bureau of Labor Statistics, 2019
⊘ This is a preview!⊘
Do you want full access?
Subscribe today to unlock all pages.

Trusted by 1+ million students worldwide

Economics
9
Source: (Economic Forecast, 2017).
9
Source: (Economic Forecast, 2017).
Paraphrase This Document
Need a fresh take? Get an instant paraphrase of this document with our AI Paraphraser

Economics
10
Source: (Virginia Association of Economists, 2018).
10
Source: (Virginia Association of Economists, 2018).

Economics
11
Source: (Economic Forecast, 2017).
Source of information: Most of the information has been found through the internet as
there are many sources where the statistical data of Northern Virginia is available and there rate
of GDP, the number of the employment and the unemployment rate, the educations system of
that state, interest rate, and the growth of the manufacturing and the agricultural sector, etc. are
stated (Park and Peterson, 2019). Data for this research has also been obtained from the Bureau
of statistics of the Virginia government. By reading certain books and evaluating the news also
this data is finding out. The Bureau of the economic statistics of the USA has studied so that true
and fair information regarding the indicators of economics can be evaluated.
Analysis
Strength of the region: The growth of the GDP in the region has become their strength
as the state income is increasing. As the GDP in the country increases the number of
⊘ This is a preview!⊘
Do you want full access?
Subscribe today to unlock all pages.

Trusted by 1+ million students worldwide
1 out of 19
Related Documents

Your All-in-One AI-Powered Toolkit for Academic Success.
+13062052269
info@desklib.com
Available 24*7 on WhatsApp / Email
Unlock your academic potential
Copyright © 2020–2025 A2Z Services. All Rights Reserved. Developed and managed by ZUCOL.