Comprehensive Analysis of Australia's Macroeconomic Performance Report
VerifiedAdded on 2023/01/04
|23
|4820
|68
Report
AI Summary
This report provides a comprehensive analysis of Australia's macroeconomic performance from 1995 to 2015. It examines key macroeconomic indicators, including real GDP growth rates, inflation rates, unemployment rates, exchange rates, and net exports. The report also analyzes the relationship between these indicators, such as the inverse relationship between real GDP growth and inflation. Furthermore, it includes data on Australian cash rates and the Federal Reserve Fund's rates, offering a comparative analysis of monetary policies. The analysis reveals insights into the Australian economy's resilience and its ability to maintain positive economic growth, even during global financial crises. The report concludes with a prediction of the Australian macroeconomic outlook based on the analyzed data and trends.
ANALYZING THE MACROECONOMIC PERFORMANCE OF AUSTRALIA i
ANALYZING THE MACROECONOMIC PERFORMANCE OF AUSTRALIA
Student Name
Institution Affiliation
Facilitator
Course
Date
ANALYZING THE MACROECONOMIC PERFORMANCE OF AUSTRALIA
Student Name
Institution Affiliation
Facilitator
Course
Date
Paraphrase This Document
Need a fresh take? Get an instant paraphrase of this document with our AI Paraphraser
ANALYZING THE MACROECONOMIC PERFORMANCE OF AUSTRALIA ii
Executive Summary
Australia is among the wealthier nations not only in the region of Asia-Pacific but also in the
whole world. It is among the world top richest economies and consists of a large economy which
is a mixed-market in nature (Groenewegen and McFarlane 2014, p.69). The Australian economy
is open in most of its sectors and hence the nation embraces a free economy. In accordance with
the 2019 Index, Australia is ranked position 5 considering the economic freedom performance
with a score of more than 80. The nation has continued to maintain its excellent scores in labor
and trade freedom, fiscal health and government integrity but its efficiency of the judiciary has
declined to some extent as compared to that of the previous years. In terms of economic
performance, Australia has been performing well for the last decade recording positive economic
growth rates though at reduced rates for some years. The nation has shown great resilient to
unfavorable economic conditions and even during the 2008 to 2009 global financial crisis, the
nation was able to keep its economic growth rate positive as compared to many economies
around the world. Considering the Asia-Pacific region, Australia among the 43 nations in the
region, is ranked position 4 in terms of economic performance. The Australian economic
performance has been kept above the expected average performance both at the regional as well
as the world level. This has been possible due to its sound economic policies which foster the
nation’s economic activity and its highly skilled readily available labor force (Courvisanos, Jain
and Mardaneh 2016, p.629). The nation’s viable business environment has continued to attract
many investors into the economy both domestically and internationally (Simon 2010, p.47). This
report has analyzed the Australian economic performance by evaluating its various
macroeconomic indicators which include the real gross domestic product growth rate and the

ANALYZING THE MACROECONOMIC PERFORMANCE OF AUSTRALIA iii
inflation, unemployment and exchange rates. Based on the analyzed macroeconomic indicators,
the Australian economic performance is good and better results are anticipated in the future.
inflation, unemployment and exchange rates. Based on the analyzed macroeconomic indicators,
the Australian economic performance is good and better results are anticipated in the future.
⊘ This is a preview!⊘
Do you want full access?
Subscribe today to unlock all pages.
Trusted by 1+ million students worldwide
ANALYZING THE MACROECONOMIC PERFORMANCE OF AUSTRALIA iv
Table of Contents
Executive Summary.........................................................................................................................ii
Australian Key Macroeconomic Indicators Data from 1995 to 2015..............................................1
Australian Data on Real GDP Growth Rates, Inflation Rates, Unemployment Rates, Exchange
Rates and Net Exports Data from 1995 to 2015..........................................................................1
Australian Cash Rates and the Federal Reserve Fund’s Rates Data from 1995 to 2015.............2
Australian Real GDP Growth Rates and Inflation Rates Relationship............................................7
Australian Real GDP Growth Rates and Unemployment Rates Relationship..............................10
Australian Net Exports and the Exchange Rates against the US dollar Relationship...................12
Australian Cash Rates and the Federal Reserve Fund’s Rates Relationship.................................14
Economic Explanations Based on the Report................................................................................15
A prediction of the Australian Macroeconomic Outlook..............................................................16
Conclusion.....................................................................................................................................16
References......................................................................................................................................18
Paraphrase This Document
Need a fresh take? Get an instant paraphrase of this document with our AI Paraphraser
ANALYZING THE MACROECONOMIC PERFORMANCE OF AUSTRALIA 1
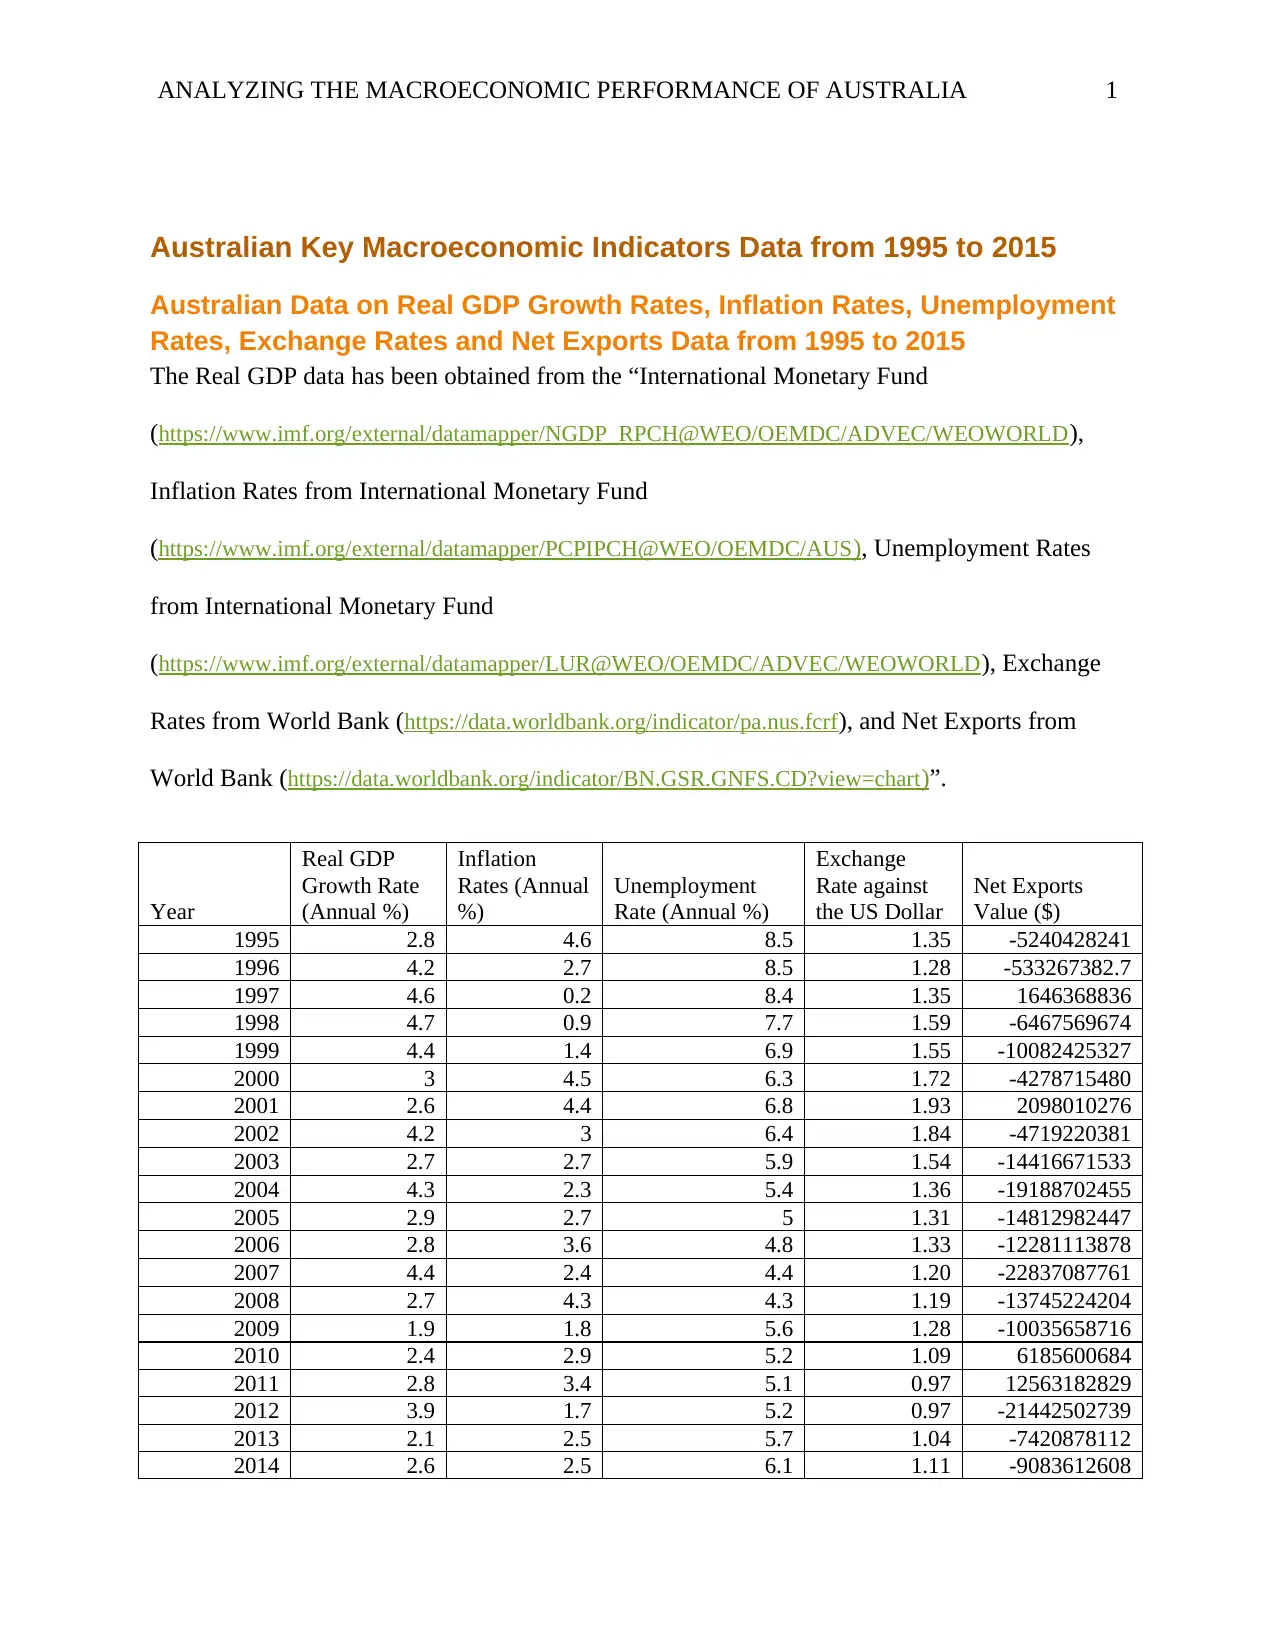
Australian Key Macroeconomic Indicators Data from 1995 to 2015
Australian Data on Real GDP Growth Rates, Inflation Rates, Unemployment
Rates, Exchange Rates and Net Exports Data from 1995 to 2015
The Real GDP data has been obtained from the “International Monetary Fund
(https://www.imf.org/external/datamapper/NGDP_RPCH@WEO/OEMDC/ADVEC/WEOWORLD),
Inflation Rates from International Monetary Fund
(https://www.imf.org/external/datamapper/PCPIPCH@WEO/OEMDC/AUS), Unemployment Rates
from International Monetary Fund
(https://www.imf.org/external/datamapper/LUR@WEO/OEMDC/ADVEC/WEOWORLD), Exchange
Rates from World Bank (https://data.worldbank.org/indicator/pa.nus.fcrf), and Net Exports from
World Bank (https://data.worldbank.org/indicator/BN.GSR.GNFS.CD?view=chart)”.
Year
Real GDP
Growth Rate
(Annual %)
Inflation
Rates (Annual
%)
Unemployment
Rate (Annual %)
Exchange
Rate against
the US Dollar
Net Exports
Value ($)
1995 2.8 4.6 8.5 1.35 -5240428241
1996 4.2 2.7 8.5 1.28 -533267382.7
1997 4.6 0.2 8.4 1.35 1646368836
1998 4.7 0.9 7.7 1.59 -6467569674
1999 4.4 1.4 6.9 1.55 -10082425327
2000 3 4.5 6.3 1.72 -4278715480
2001 2.6 4.4 6.8 1.93 2098010276
2002 4.2 3 6.4 1.84 -4719220381
2003 2.7 2.7 5.9 1.54 -14416671533
2004 4.3 2.3 5.4 1.36 -19188702455
2005 2.9 2.7 5 1.31 -14812982447
2006 2.8 3.6 4.8 1.33 -12281113878
2007 4.4 2.4 4.4 1.20 -22837087761
2008 2.7 4.3 4.3 1.19 -13745224204
2009 1.9 1.8 5.6 1.28 -10035658716
2010 2.4 2.9 5.2 1.09 6185600684
2011 2.8 3.4 5.1 0.97 12563182829
2012 3.9 1.7 5.2 0.97 -21442502739
2013 2.1 2.5 5.7 1.04 -7420878112
2014 2.6 2.5 6.1 1.11 -9083612608
ANALYZING THE MACROECONOMIC PERFORMANCE OF AUSTRALIA 2
2015 2.5 1.5 6 1.33 -27769803392
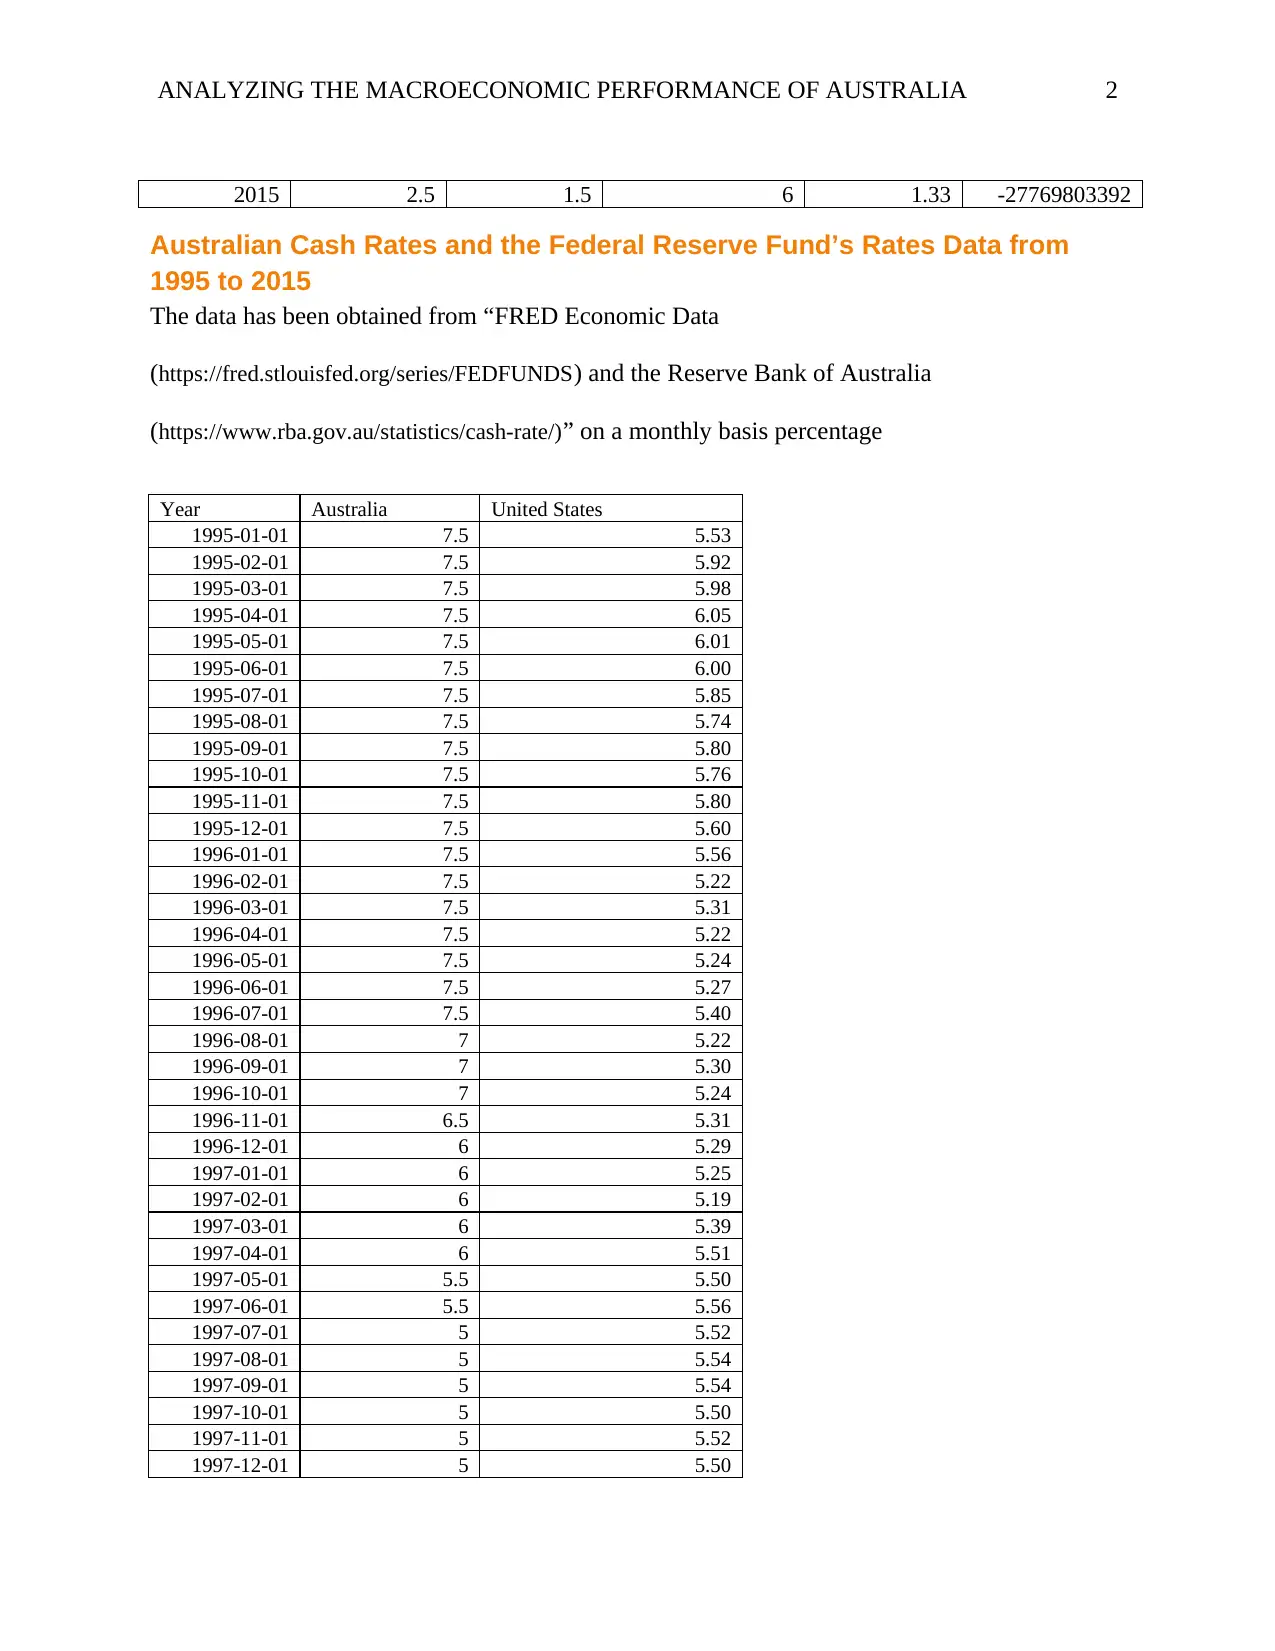
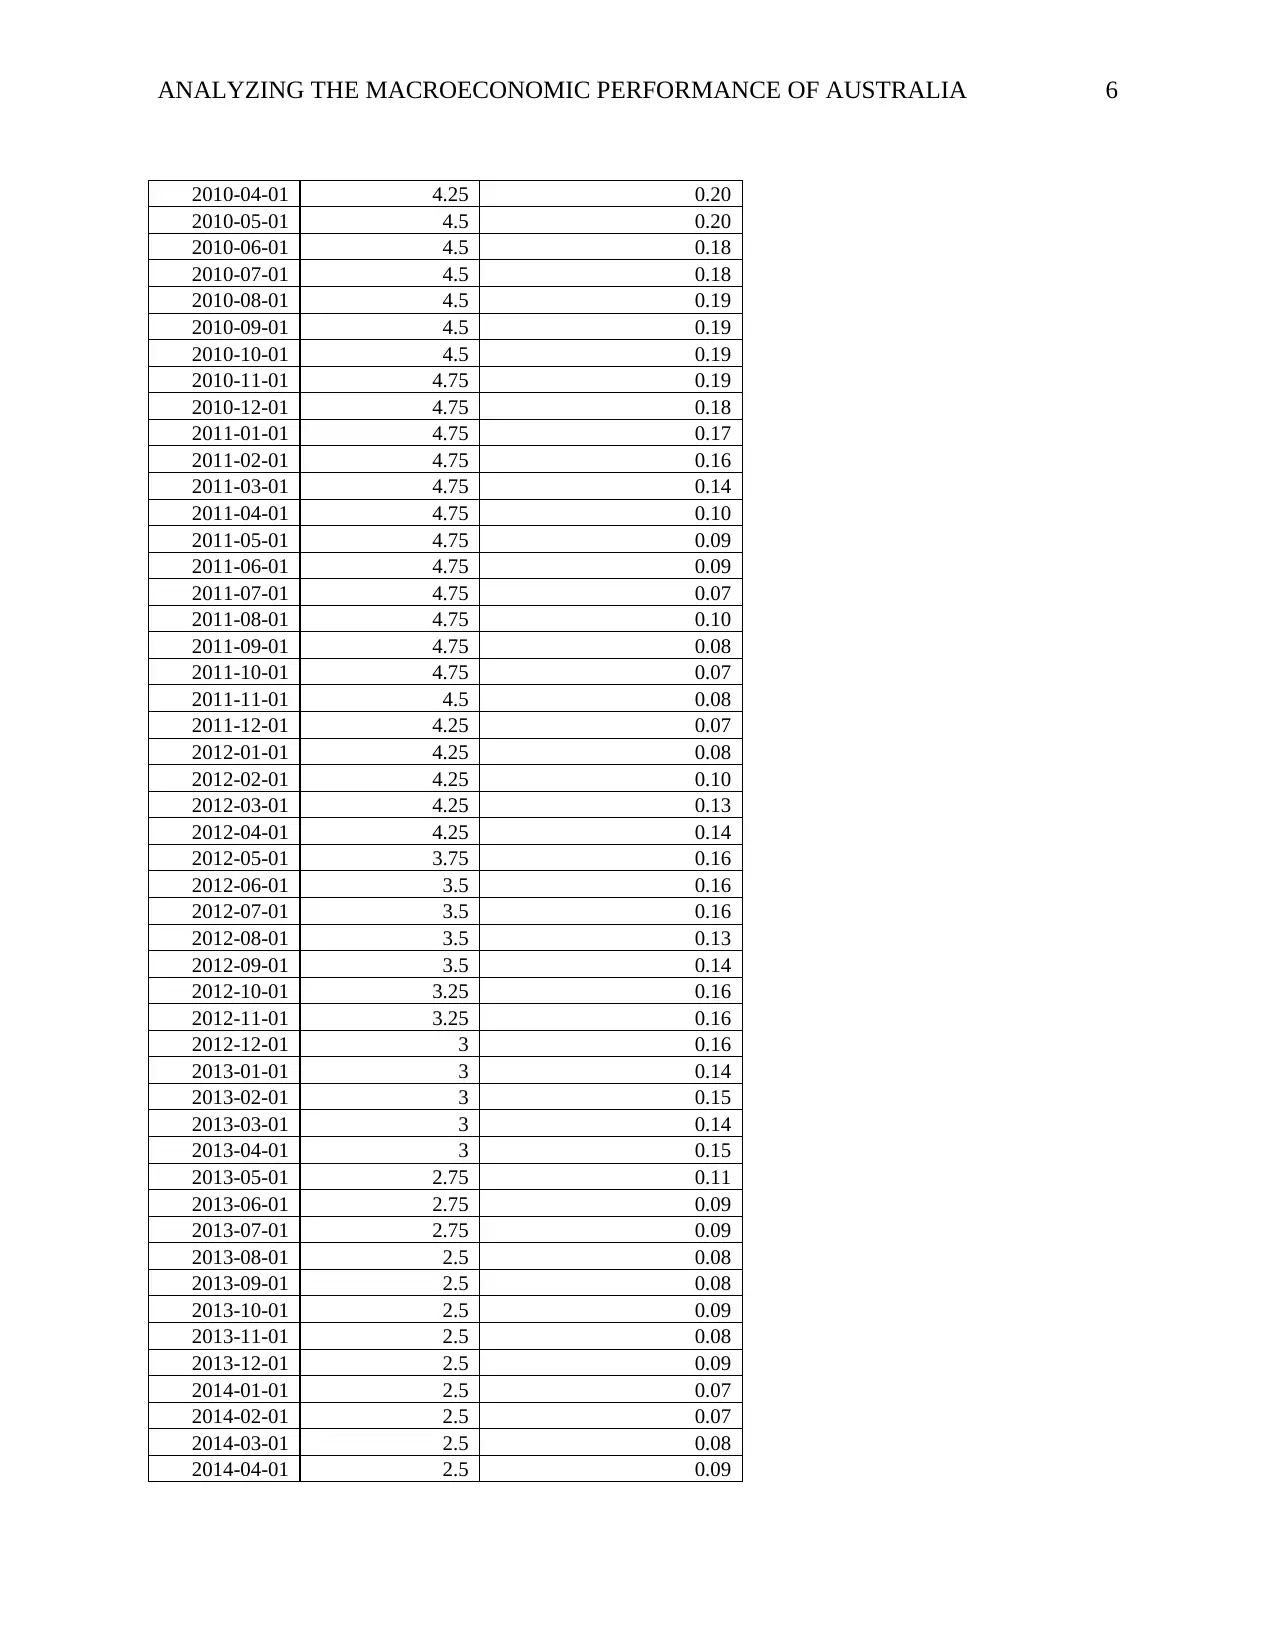
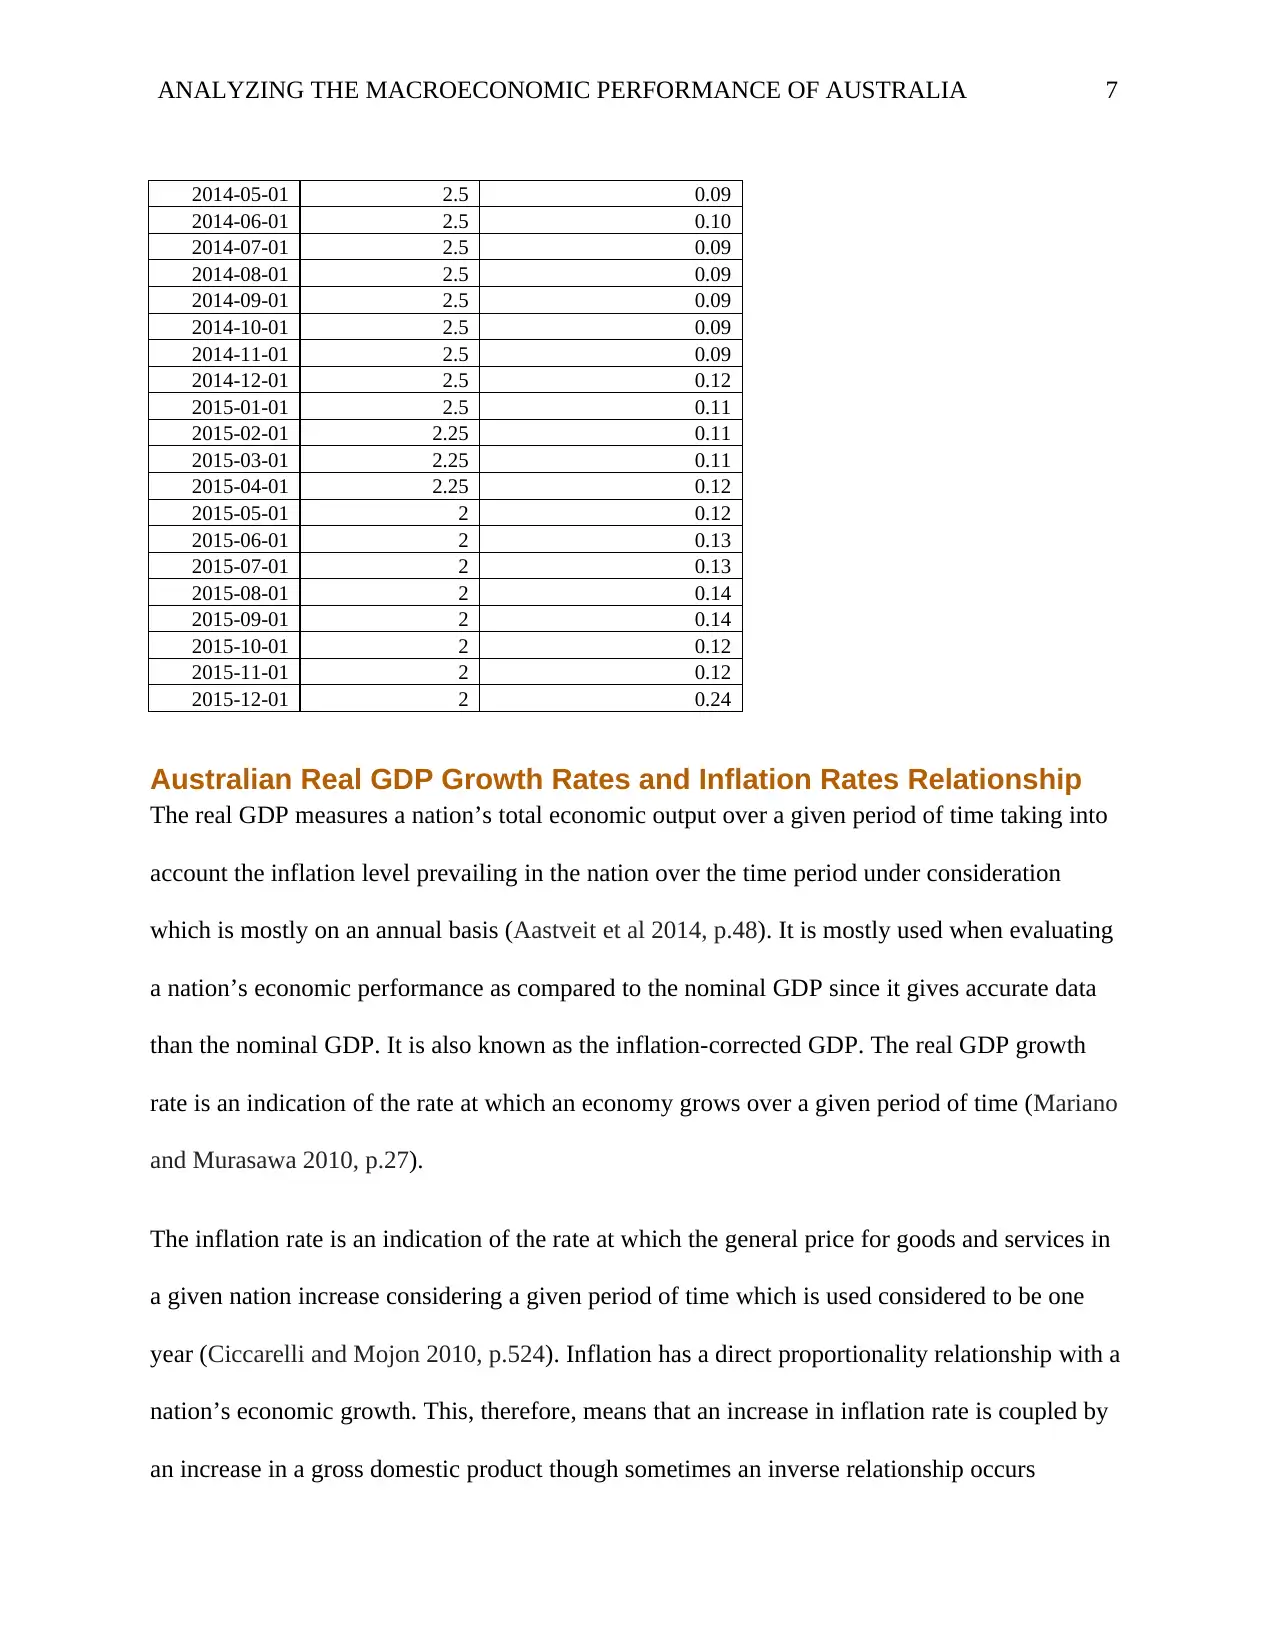
Australian Cash Rates and the Federal Reserve Fund’s Rates Data from
1995 to 2015
The data has been obtained from “FRED Economic Data
(https://fred.stlouisfed.org/series/FEDFUNDS) and the Reserve Bank of Australia
(https://www.rba.gov.au/statistics/cash-rate/)” on a monthly basis percentage
Year Australia United States
1995-01-01 7.5 5.53
1995-02-01 7.5 5.92
1995-03-01 7.5 5.98
1995-04-01 7.5 6.05
1995-05-01 7.5 6.01
1995-06-01 7.5 6.00
1995-07-01 7.5 5.85
1995-08-01 7.5 5.74
1995-09-01 7.5 5.80
1995-10-01 7.5 5.76
1995-11-01 7.5 5.80
1995-12-01 7.5 5.60
1996-01-01 7.5 5.56
1996-02-01 7.5 5.22
1996-03-01 7.5 5.31
1996-04-01 7.5 5.22
1996-05-01 7.5 5.24
1996-06-01 7.5 5.27
1996-07-01 7.5 5.40
1996-08-01 7 5.22
1996-09-01 7 5.30
1996-10-01 7 5.24
1996-11-01 6.5 5.31
1996-12-01 6 5.29
1997-01-01 6 5.25
1997-02-01 6 5.19
1997-03-01 6 5.39
1997-04-01 6 5.51
1997-05-01 5.5 5.50
1997-06-01 5.5 5.56
1997-07-01 5 5.52
1997-08-01 5 5.54
1997-09-01 5 5.54
1997-10-01 5 5.50
1997-11-01 5 5.52
1997-12-01 5 5.50
2015 2.5 1.5 6 1.33 -27769803392
Australian Cash Rates and the Federal Reserve Fund’s Rates Data from
1995 to 2015
The data has been obtained from “FRED Economic Data
(https://fred.stlouisfed.org/series/FEDFUNDS) and the Reserve Bank of Australia
(https://www.rba.gov.au/statistics/cash-rate/)” on a monthly basis percentage
Year Australia United States
1995-01-01 7.5 5.53
1995-02-01 7.5 5.92
1995-03-01 7.5 5.98
1995-04-01 7.5 6.05
1995-05-01 7.5 6.01
1995-06-01 7.5 6.00
1995-07-01 7.5 5.85
1995-08-01 7.5 5.74
1995-09-01 7.5 5.80
1995-10-01 7.5 5.76
1995-11-01 7.5 5.80
1995-12-01 7.5 5.60
1996-01-01 7.5 5.56
1996-02-01 7.5 5.22
1996-03-01 7.5 5.31
1996-04-01 7.5 5.22
1996-05-01 7.5 5.24
1996-06-01 7.5 5.27
1996-07-01 7.5 5.40
1996-08-01 7 5.22
1996-09-01 7 5.30
1996-10-01 7 5.24
1996-11-01 6.5 5.31
1996-12-01 6 5.29
1997-01-01 6 5.25
1997-02-01 6 5.19
1997-03-01 6 5.39
1997-04-01 6 5.51
1997-05-01 5.5 5.50
1997-06-01 5.5 5.56
1997-07-01 5 5.52
1997-08-01 5 5.54
1997-09-01 5 5.54
1997-10-01 5 5.50
1997-11-01 5 5.52
1997-12-01 5 5.50
⊘ This is a preview!⊘
Do you want full access?
Subscribe today to unlock all pages.
Trusted by 1+ million students worldwide
ANALYZING THE MACROECONOMIC PERFORMANCE OF AUSTRALIA 3
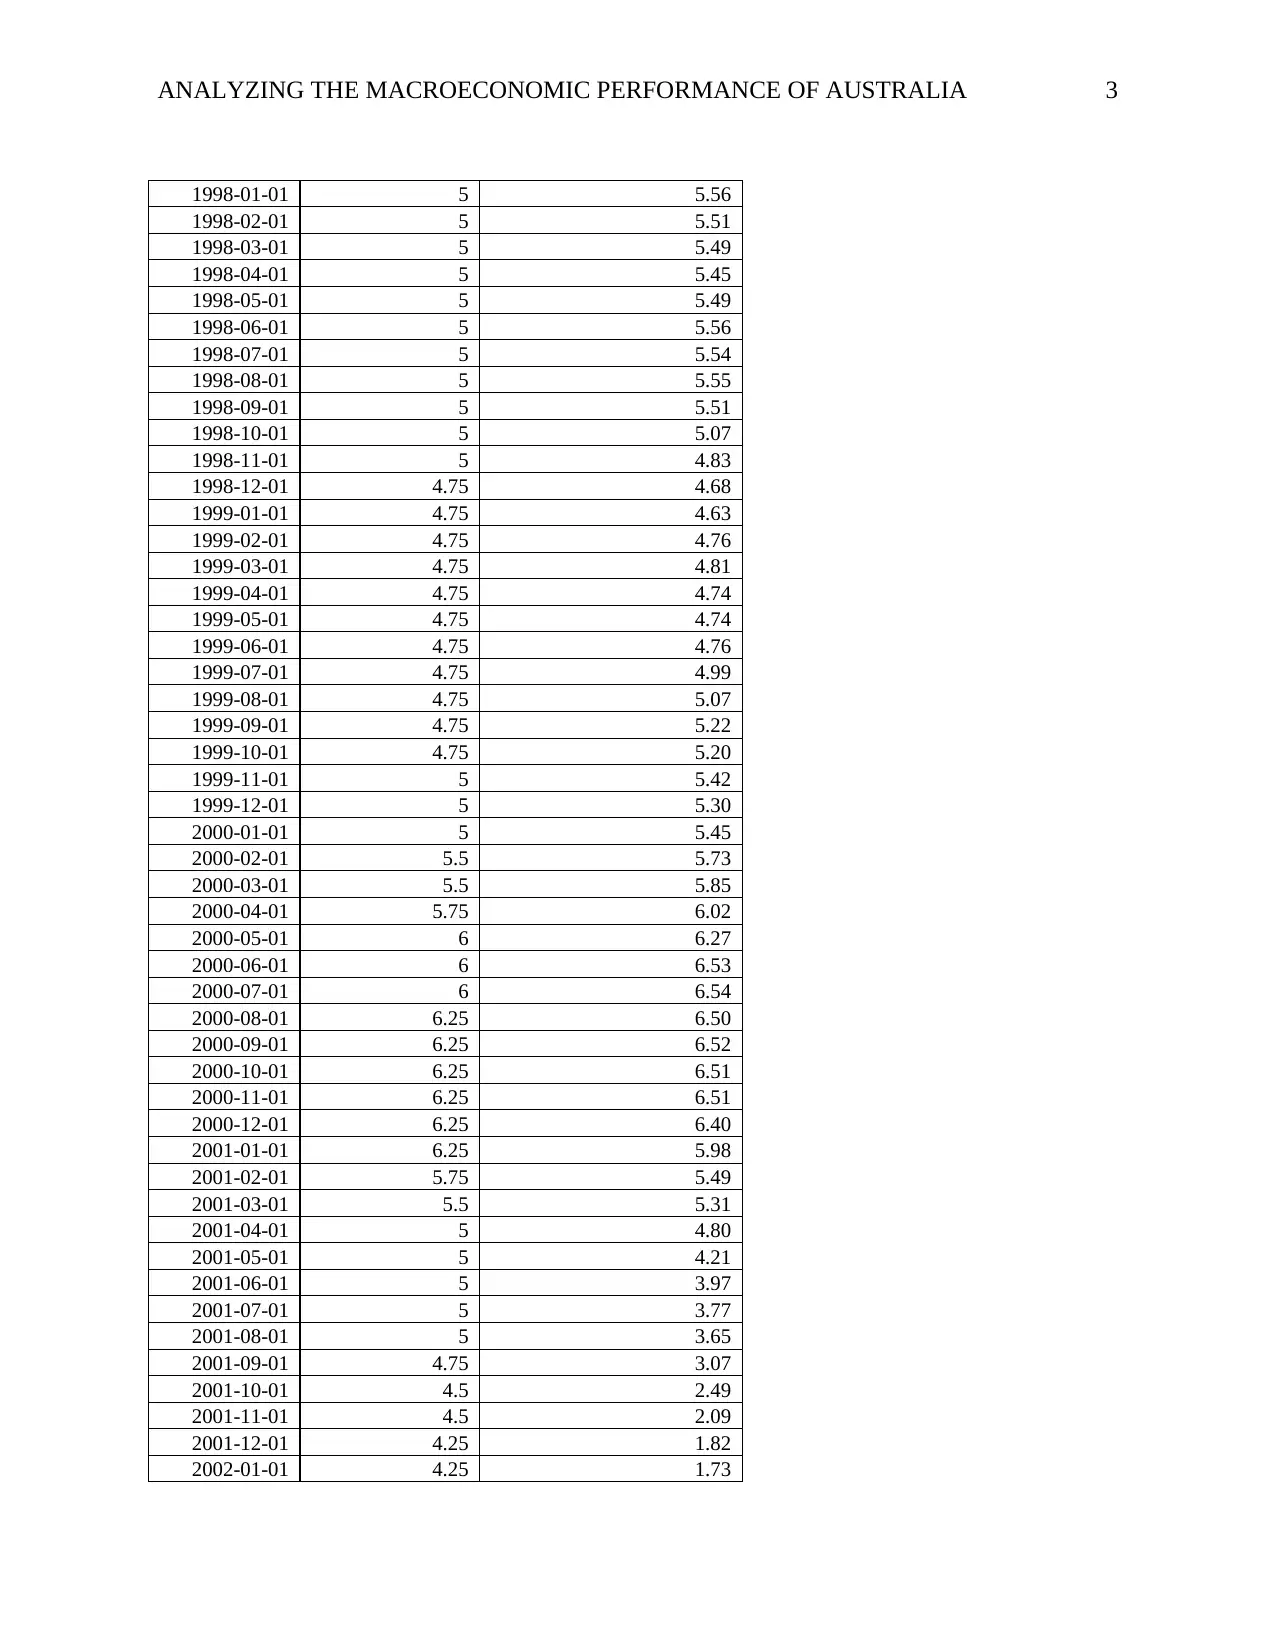
1998-01-01 5 5.56
1998-02-01 5 5.51
1998-03-01 5 5.49
1998-04-01 5 5.45
1998-05-01 5 5.49
1998-06-01 5 5.56
1998-07-01 5 5.54
1998-08-01 5 5.55
1998-09-01 5 5.51
1998-10-01 5 5.07
1998-11-01 5 4.83
1998-12-01 4.75 4.68
1999-01-01 4.75 4.63
1999-02-01 4.75 4.76
1999-03-01 4.75 4.81
1999-04-01 4.75 4.74
1999-05-01 4.75 4.74
1999-06-01 4.75 4.76
1999-07-01 4.75 4.99
1999-08-01 4.75 5.07
1999-09-01 4.75 5.22
1999-10-01 4.75 5.20
1999-11-01 5 5.42
1999-12-01 5 5.30
2000-01-01 5 5.45
2000-02-01 5.5 5.73
2000-03-01 5.5 5.85
2000-04-01 5.75 6.02
2000-05-01 6 6.27
2000-06-01 6 6.53
2000-07-01 6 6.54
2000-08-01 6.25 6.50
2000-09-01 6.25 6.52
2000-10-01 6.25 6.51
2000-11-01 6.25 6.51
2000-12-01 6.25 6.40
2001-01-01 6.25 5.98
2001-02-01 5.75 5.49
2001-03-01 5.5 5.31
2001-04-01 5 4.80
2001-05-01 5 4.21
2001-06-01 5 3.97
2001-07-01 5 3.77
2001-08-01 5 3.65
2001-09-01 4.75 3.07
2001-10-01 4.5 2.49
2001-11-01 4.5 2.09
2001-12-01 4.25 1.82
2002-01-01 4.25 1.73
Paraphrase This Document
Need a fresh take? Get an instant paraphrase of this document with our AI Paraphraser
ANALYZING THE MACROECONOMIC PERFORMANCE OF AUSTRALIA 4
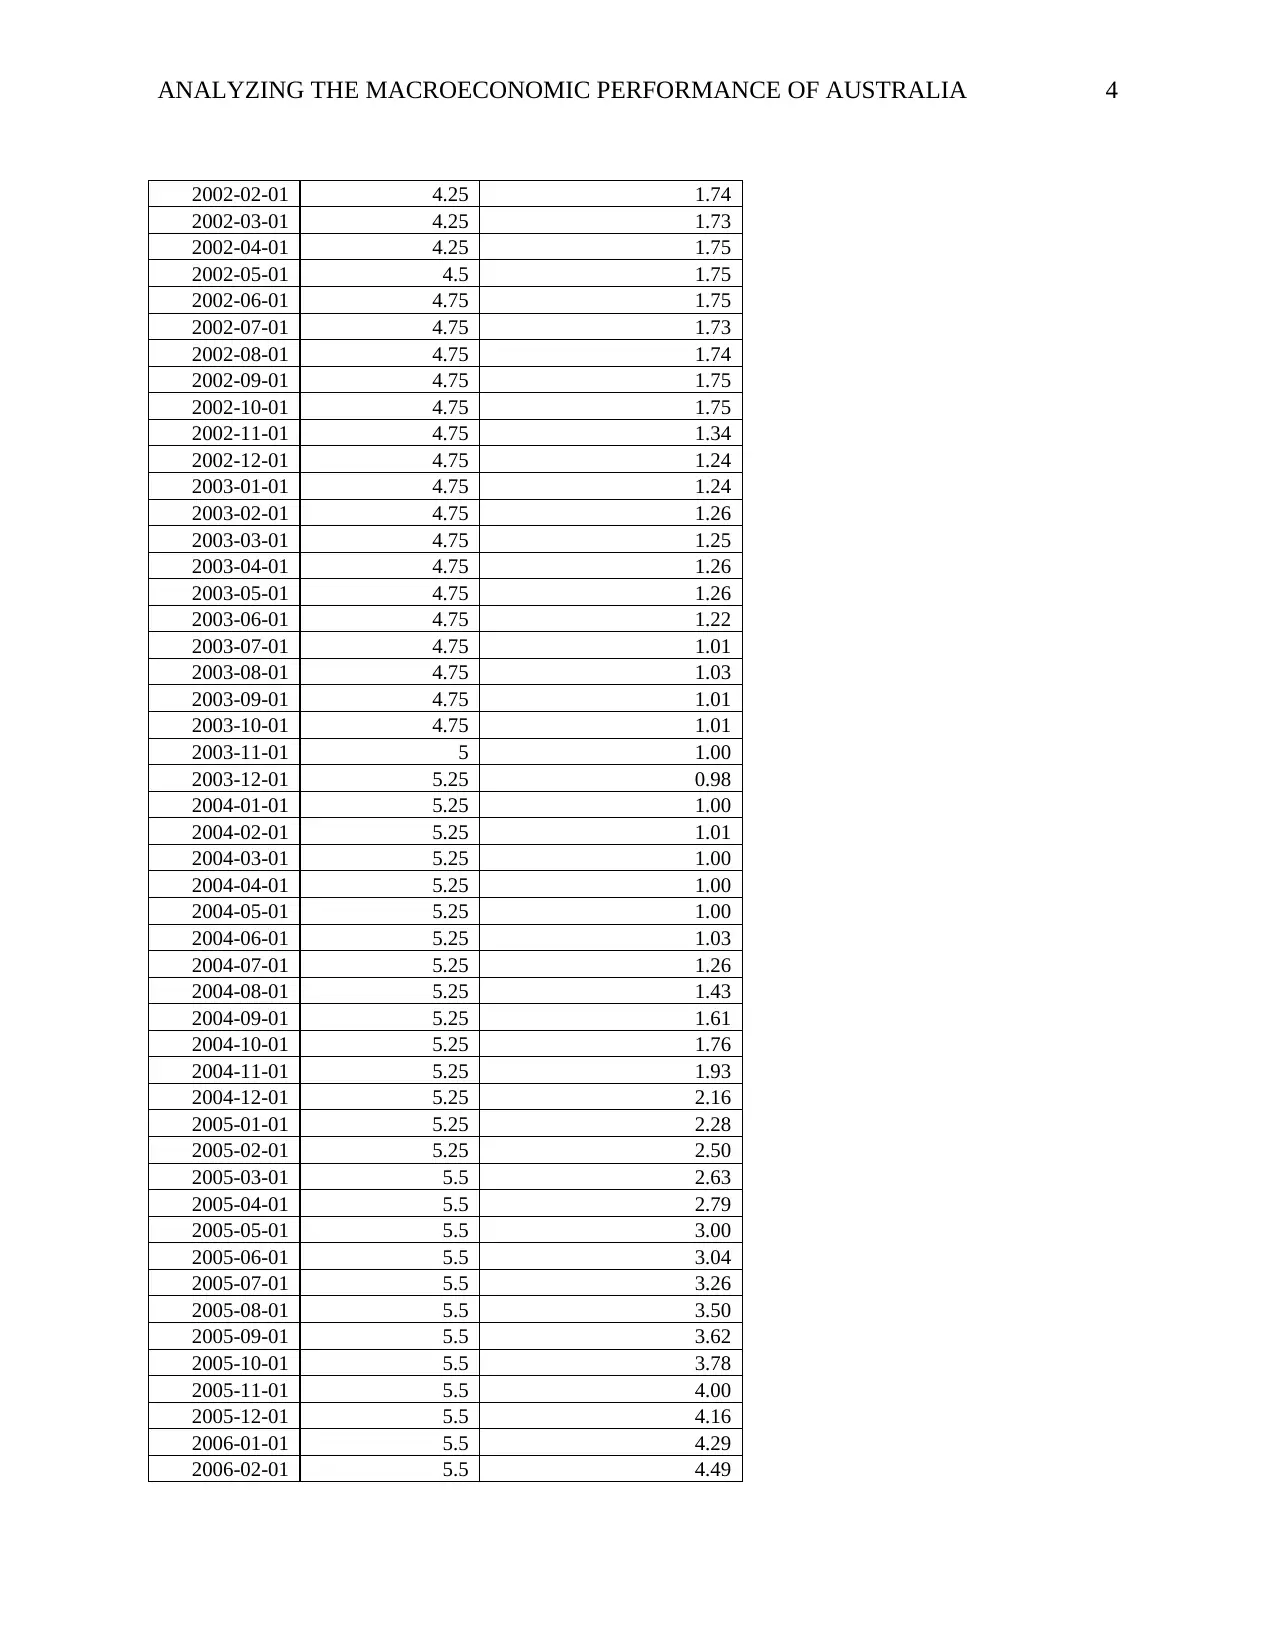
2002-02-01 4.25 1.74
2002-03-01 4.25 1.73
2002-04-01 4.25 1.75
2002-05-01 4.5 1.75
2002-06-01 4.75 1.75
2002-07-01 4.75 1.73
2002-08-01 4.75 1.74
2002-09-01 4.75 1.75
2002-10-01 4.75 1.75
2002-11-01 4.75 1.34
2002-12-01 4.75 1.24
2003-01-01 4.75 1.24
2003-02-01 4.75 1.26
2003-03-01 4.75 1.25
2003-04-01 4.75 1.26
2003-05-01 4.75 1.26
2003-06-01 4.75 1.22
2003-07-01 4.75 1.01
2003-08-01 4.75 1.03
2003-09-01 4.75 1.01
2003-10-01 4.75 1.01
2003-11-01 5 1.00
2003-12-01 5.25 0.98
2004-01-01 5.25 1.00
2004-02-01 5.25 1.01
2004-03-01 5.25 1.00
2004-04-01 5.25 1.00
2004-05-01 5.25 1.00
2004-06-01 5.25 1.03
2004-07-01 5.25 1.26
2004-08-01 5.25 1.43
2004-09-01 5.25 1.61
2004-10-01 5.25 1.76
2004-11-01 5.25 1.93
2004-12-01 5.25 2.16
2005-01-01 5.25 2.28
2005-02-01 5.25 2.50
2005-03-01 5.5 2.63
2005-04-01 5.5 2.79
2005-05-01 5.5 3.00
2005-06-01 5.5 3.04
2005-07-01 5.5 3.26
2005-08-01 5.5 3.50
2005-09-01 5.5 3.62
2005-10-01 5.5 3.78
2005-11-01 5.5 4.00
2005-12-01 5.5 4.16
2006-01-01 5.5 4.29
2006-02-01 5.5 4.49
ANALYZING THE MACROECONOMIC PERFORMANCE OF AUSTRALIA 5
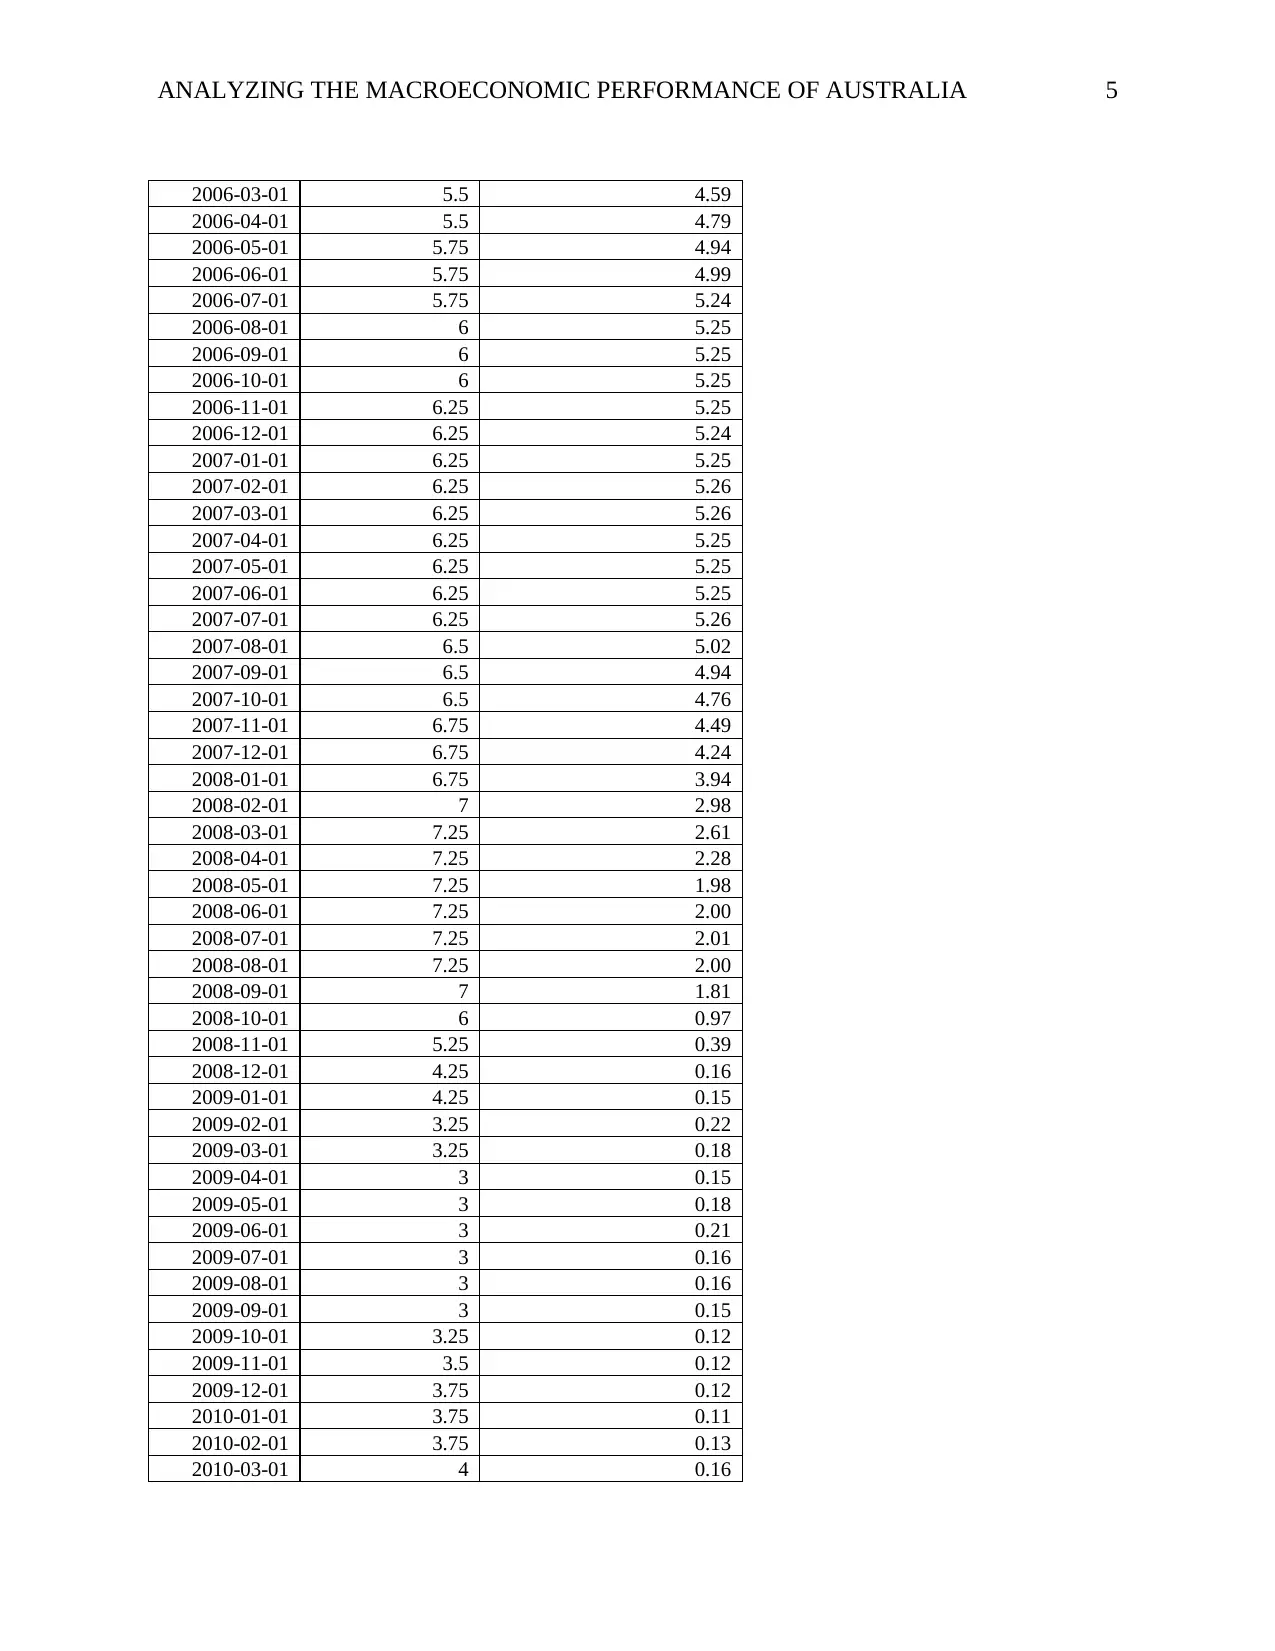
2006-03-01 5.5 4.59
2006-04-01 5.5 4.79
2006-05-01 5.75 4.94
2006-06-01 5.75 4.99
2006-07-01 5.75 5.24
2006-08-01 6 5.25
2006-09-01 6 5.25
2006-10-01 6 5.25
2006-11-01 6.25 5.25
2006-12-01 6.25 5.24
2007-01-01 6.25 5.25
2007-02-01 6.25 5.26
2007-03-01 6.25 5.26
2007-04-01 6.25 5.25
2007-05-01 6.25 5.25
2007-06-01 6.25 5.25
2007-07-01 6.25 5.26
2007-08-01 6.5 5.02
2007-09-01 6.5 4.94
2007-10-01 6.5 4.76
2007-11-01 6.75 4.49
2007-12-01 6.75 4.24
2008-01-01 6.75 3.94
2008-02-01 7 2.98
2008-03-01 7.25 2.61
2008-04-01 7.25 2.28
2008-05-01 7.25 1.98
2008-06-01 7.25 2.00
2008-07-01 7.25 2.01
2008-08-01 7.25 2.00
2008-09-01 7 1.81
2008-10-01 6 0.97
2008-11-01 5.25 0.39
2008-12-01 4.25 0.16
2009-01-01 4.25 0.15
2009-02-01 3.25 0.22
2009-03-01 3.25 0.18
2009-04-01 3 0.15
2009-05-01 3 0.18
2009-06-01 3 0.21
2009-07-01 3 0.16
2009-08-01 3 0.16
2009-09-01 3 0.15
2009-10-01 3.25 0.12
2009-11-01 3.5 0.12
2009-12-01 3.75 0.12
2010-01-01 3.75 0.11
2010-02-01 3.75 0.13
2010-03-01 4 0.16
⊘ This is a preview!⊘
Do you want full access?
Subscribe today to unlock all pages.
Trusted by 1+ million students worldwide
ANALYZING THE MACROECONOMIC PERFORMANCE OF AUSTRALIA 6
2010-04-01 4.25 0.20
2010-05-01 4.5 0.20
2010-06-01 4.5 0.18
2010-07-01 4.5 0.18
2010-08-01 4.5 0.19
2010-09-01 4.5 0.19
2010-10-01 4.5 0.19
2010-11-01 4.75 0.19
2010-12-01 4.75 0.18
2011-01-01 4.75 0.17
2011-02-01 4.75 0.16
2011-03-01 4.75 0.14
2011-04-01 4.75 0.10
2011-05-01 4.75 0.09
2011-06-01 4.75 0.09
2011-07-01 4.75 0.07
2011-08-01 4.75 0.10
2011-09-01 4.75 0.08
2011-10-01 4.75 0.07
2011-11-01 4.5 0.08
2011-12-01 4.25 0.07
2012-01-01 4.25 0.08
2012-02-01 4.25 0.10
2012-03-01 4.25 0.13
2012-04-01 4.25 0.14
2012-05-01 3.75 0.16
2012-06-01 3.5 0.16
2012-07-01 3.5 0.16
2012-08-01 3.5 0.13
2012-09-01 3.5 0.14
2012-10-01 3.25 0.16
2012-11-01 3.25 0.16
2012-12-01 3 0.16
2013-01-01 3 0.14
2013-02-01 3 0.15
2013-03-01 3 0.14
2013-04-01 3 0.15
2013-05-01 2.75 0.11
2013-06-01 2.75 0.09
2013-07-01 2.75 0.09
2013-08-01 2.5 0.08
2013-09-01 2.5 0.08
2013-10-01 2.5 0.09
2013-11-01 2.5 0.08
2013-12-01 2.5 0.09
2014-01-01 2.5 0.07
2014-02-01 2.5 0.07
2014-03-01 2.5 0.08
2014-04-01 2.5 0.09
Paraphrase This Document
Need a fresh take? Get an instant paraphrase of this document with our AI Paraphraser
ANALYZING THE MACROECONOMIC PERFORMANCE OF AUSTRALIA 7
2014-05-01 2.5 0.09
2014-06-01 2.5 0.10
2014-07-01 2.5 0.09
2014-08-01 2.5 0.09
2014-09-01 2.5 0.09
2014-10-01 2.5 0.09
2014-11-01 2.5 0.09
2014-12-01 2.5 0.12
2015-01-01 2.5 0.11
2015-02-01 2.25 0.11
2015-03-01 2.25 0.11
2015-04-01 2.25 0.12
2015-05-01 2 0.12
2015-06-01 2 0.13
2015-07-01 2 0.13
2015-08-01 2 0.14
2015-09-01 2 0.14
2015-10-01 2 0.12
2015-11-01 2 0.12
2015-12-01 2 0.24
Australian Real GDP Growth Rates and Inflation Rates Relationship
The real GDP measures a nation’s total economic output over a given period of time taking into
account the inflation level prevailing in the nation over the time period under consideration
which is mostly on an annual basis (Aastveit et al 2014, p.48). It is mostly used when evaluating
a nation’s economic performance as compared to the nominal GDP since it gives accurate data
than the nominal GDP. It is also known as the inflation-corrected GDP. The real GDP growth
rate is an indication of the rate at which an economy grows over a given period of time (Mariano
and Murasawa 2010, p.27).
The inflation rate is an indication of the rate at which the general price for goods and services in
a given nation increase considering a given period of time which is used considered to be one
year (Ciccarelli and Mojon 2010, p.524). Inflation has a direct proportionality relationship with a
nation’s economic growth. This, therefore, means that an increase in inflation rate is coupled by
an increase in a gross domestic product though sometimes an inverse relationship occurs
ANALYZING THE MACROECONOMIC PERFORMANCE OF AUSTRALIA 8
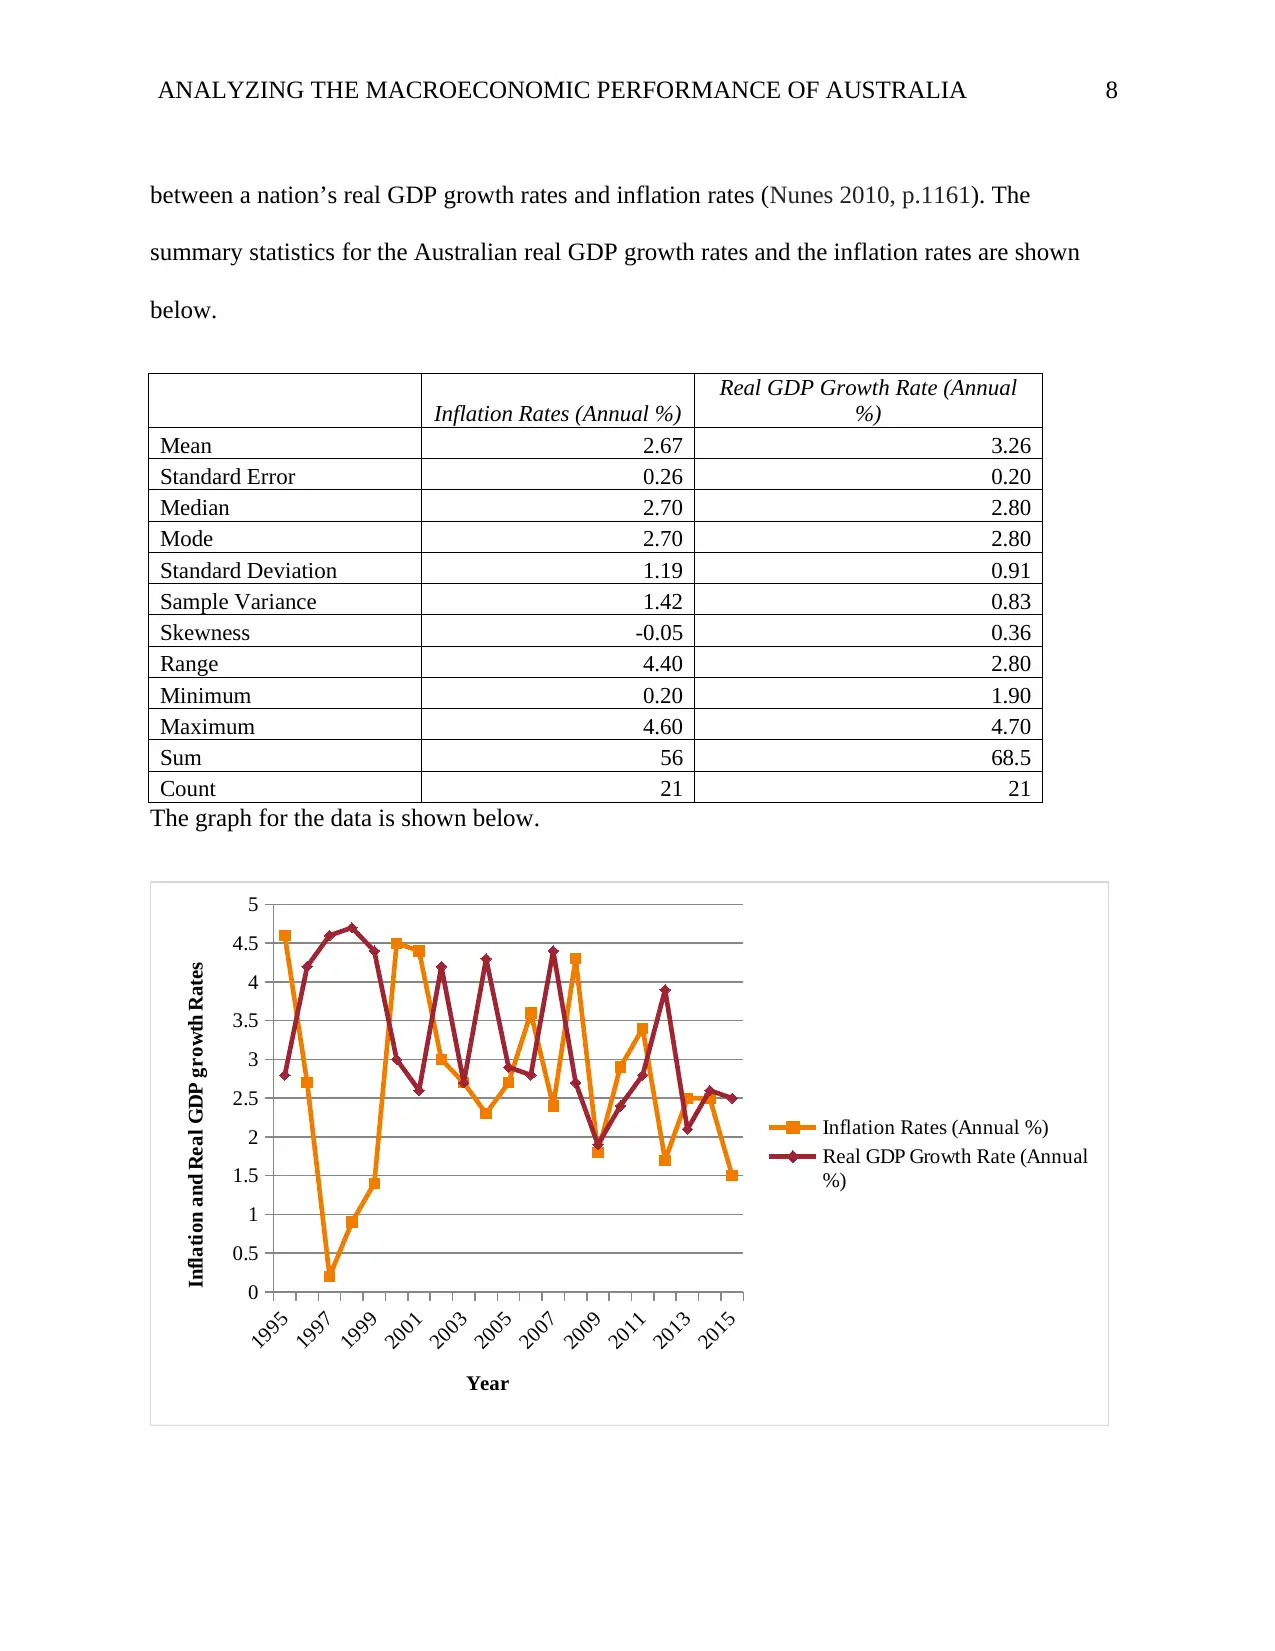
between a nation’s real GDP growth rates and inflation rates (Nunes 2010, p.1161). The
summary statistics for the Australian real GDP growth rates and the inflation rates are shown
below.
Inflation Rates (Annual %)
Real GDP Growth Rate (Annual
%)
Mean 2.67 3.26
Standard Error 0.26 0.20
Median 2.70 2.80
Mode 2.70 2.80
Standard Deviation 1.19 0.91
Sample Variance 1.42 0.83
Skewness -0.05 0.36
Range 4.40 2.80
Minimum 0.20 1.90
Maximum 4.60 4.70
Sum 56 68.5
Count 21 21
The graph for the data is shown below.
1995
1997
1999
2001
2003
2005
2007
2009
2011
2013
2015
0
0.5
1
1.5
2
2.5
3
3.5
4
4.5
5
Inflation Rates (Annual %)
Real GDP Growth Rate (Annual
%)
Year
Inflation and Real GDP growth Rates
⊘ This is a preview!⊘
Do you want full access?
Subscribe today to unlock all pages.
Trusted by 1+ million students worldwide
1 out of 23
Related Documents


Your All-in-One AI-Powered Toolkit for Academic Success.
+13062052269
info@desklib.com
Available 24*7 on WhatsApp / Email
![[object Object]](/_next/static/media/star-bottom.7253800d.svg)
Unlock your academic potential
Copyright © 2020–2026 A2Z Services. All Rights Reserved. Developed and managed by ZUCOL.