ECO100 Assignment 2: Macroeconomic Indicators for Oil & Gas

Verified

Added on  2023/06/07

|6
|1170
|313
Report
AI Summary
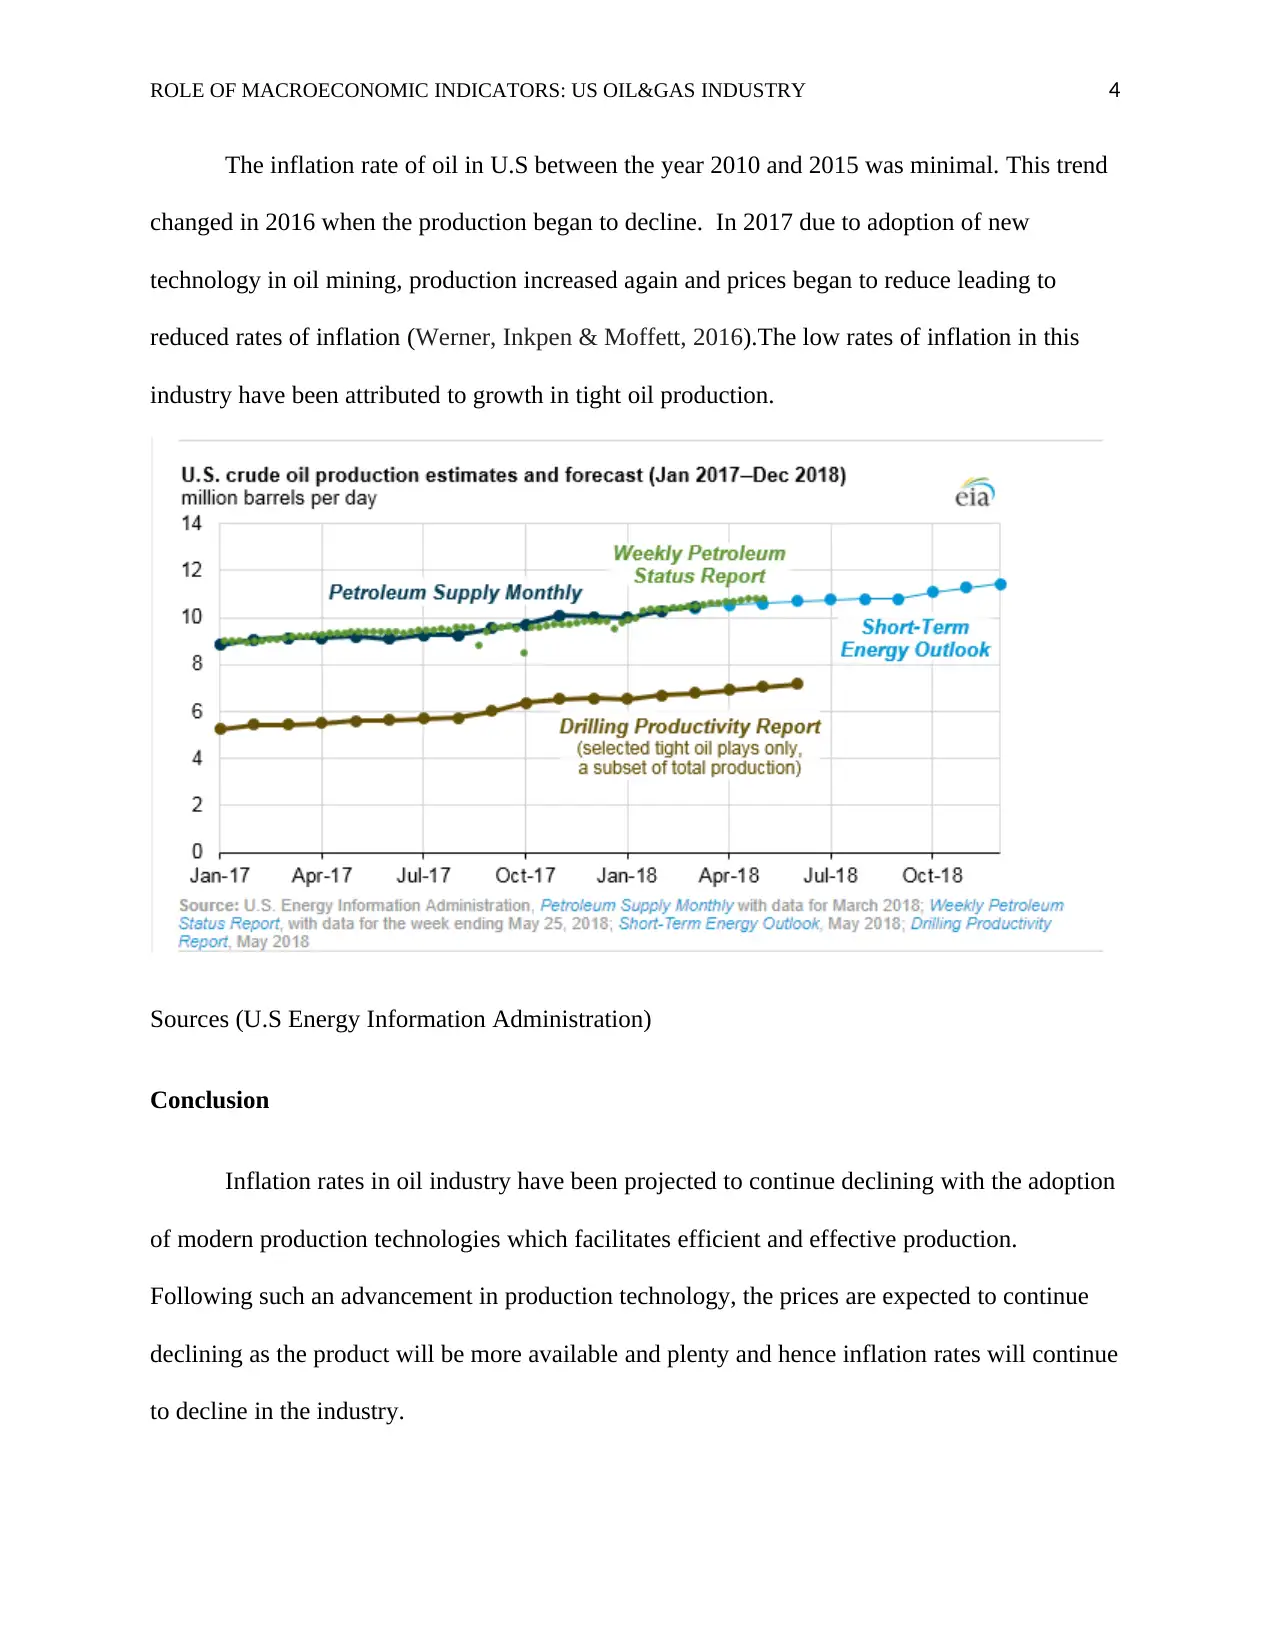
This report examines the role of macroeconomic indicators in the US oil and gas industry, focusing on the impact of these indicators on market dynamics and economic trends. The report begins with an overview of the US oil and gas industry, including its size, contribution to the economy, and employment figures. It then delves into key macroeconomic indicators, such as inflation rates and crude oil inventories, and how these indicators are used by traders and investors to understand market fundamentals and predict price movements. The report also analyzes recent trends in oil inflation rates, highlighting the factors influencing these trends. The analysis includes data from 2010 to 2017 and discusses the impact of technological advancements on production and prices. Finally, the report concludes with a projection of future trends, suggesting a continued decline in inflation rates due to the adoption of modern production technologies. The report uses data from the U.S. Energy Information Administration and other sources to support its findings, providing a comprehensive overview of the relationship between macroeconomic indicators and the US oil and gas industry.
Document Page
Running Head: ROLE OF MACROECONOMIC INDICATORS: US OIL&GAS INDUSTRY 1
ROLE OF MACROECONOMIC INDICATORS: US OIL&GAS INDUSTRY
Student Name
Institution Affiliation
Facilitator
Course
Date
tabler-icon-diamond-filled.svg

Paraphrase This Document

Need a fresh take? Get an instant paraphrase of this document with our AI Paraphraser
Document Page
ROLE OF MACROECONOMIC INDICATORS: US OIL&GAS INDUSTRY 2
Size of Oil and Gas Industry in U.S
Oil and Gas production industry in United States began early in 1800’s. Current statistics
have indicated that U.S. produces 571 million tons and 734.5 cubic meters of oil and gas
respectively. Also, U.S oil and gas reserves are among the largest in the world. Notably, U.S. has
also been ranked as the largest oil and gas consumer nation, with an approximate consumption of
913.3 million metric tons of oil and 27.1 trillion cubic feet of natural gas as the 2017 statistics
(Berk & Rauch, 2016). This has made Texas to be the leading producer of both oil and natural
gas in U.S. followed by Pennsylvania and then Virginia.
In consideration to the industry’s contribution to the economy of U.S., it has continually
increased its absorption rate of workers. For instance, between 2011 and 2015, statistics by the
American Petroleum Industry indicated that the industry’s job creation rate rose from 500,000 to
10.3 million, accounting for 5.6% of the country’s employment (EIA & GPO, 2016). PwC report
has indicated that oil and gas industry in U.S. contribute more than $1.1 trillion towards the
country’s GDP of $15 trillion annually. That is almost 7.3% of the total U.S. economy output.
Basically, that percentage comes from $481 billion in direct impact, $494 billion in indirect
impact and $126 billion in induced impact.
Noteworthy Macroeconomic Indicator in U.S. Oil and Gas Industry
Traders and potential investors use macroeconomic indicators to understand the basic
fundamentals of different markets. Economic indicators considered by these people however
depends on the specific markets they operate in, for instance, the oil traders focus on economic
indicators providing information in regard to petroleum industry. Mainly, inflation rate of crude
oil in U.S. is a macroeconomic indicator that should be monitored. This popular macroeconomic
indicator in U.S (Fisher, 2015), is influenced by the amount of crude oil which has been reserved
Document Page
ROLE OF MACROECONOMIC INDICATORS: US OIL&GAS INDUSTRY 3
for future use. Its quantity and all the changes that it undergoes signal the trends in the industry
over a specific period of time. Inflation rate of oil industry is influenced by the total U.S. crude
oil and lease condensate that is currently at the refineries, pipelines, and terminals.
Since this information is released on weekly basis by Energy Information Administration,
traders in the industry must compare the inventory number of crude oil to expectations and along
the past levels in order to gain insights into the future moves of oil prices. For instance, if the
inventories are on their increasing trend, it acts as an indication that production outstrips demand
and that should signal future decline in energy prices (Mügge, 2016). On the other hand, if the
inventories are decreasing, the traders are signaled to expect an increase in oil prices. Therefore,
considering these facts indicates how importance this macroeconomic indicator is in the industry
for any trader who wishes to keep track on the market trends within the industry and to ensure
that he/she achieves customer satisfaction as well as profitability.
Also, the release of crude oil inventories is accompanied by other important facts
pertaining the oil industry like domestic production, utilization, other inventory levels (like
motor gasoline), refinery input and import/ export data (Wang, Chen, Jha & Rogers, 2014). This
information is equally important for monitoring by the stakeholders in the industry as it helps
them to gain more insights in regard to fundamentals of crude oil market. For instance, traders
will assess the refinery use of oil to define the capacity of oil available to have additional supply
to the market. In a case where refinery use is in an increasing trend, it is assumed that putting
more oil through refineries may be difficult hence leading to reduced supplies and increased
prices.
Recent Trends in inflation rates of Oil in U.S
Document Page
ROLE OF MACROECONOMIC INDICATORS: US OIL&GAS INDUSTRY 4
The inflation rate of oil in U.S between the year 2010 and 2015 was minimal. This trend
changed in 2016 when the production began to decline. In 2017 due to adoption of new
technology in oil mining, production increased again and prices began to reduce leading to
reduced rates of inflation (Werner, Inkpen & Moffett, 2016).The low rates of inflation in this
industry have been attributed to growth in tight oil production.
Sources (U.S Energy Information Administration)
Conclusion
Inflation rates in oil industry have been projected to continue declining with the adoption
of modern production technologies which facilitates efficient and effective production.
Following such an advancement in production technology, the prices are expected to continue
declining as the product will be more available and plenty and hence inflation rates will continue
to decline in the industry.
tabler-icon-diamond-filled.svg

Paraphrase This Document

Need a fresh take? Get an instant paraphrase of this document with our AI Paraphraser
Document Page
ROLE OF MACROECONOMIC INDICATORS: US OIL&GAS INDUSTRY 5
References
Berk, I., & Rauch, J. (2016). Regulatory interventions in the US oil and gas sector: How do the
stock markets perceive the CFTC's announcements during the 2008 financial
crisis?. Energy Economics, 54, 337-348.
Energy Information Administration (US), & Government Publications Office (Eds.).
(2016). International Energy Outlook 2016: With Projections to 2040. Government
Printing Office.
Fisher, F. M. (2015). Supply and Costs in the US Petroleum Industry (Routledge Revivals): Two
Econometric Studies. Routledge.
Mügge, D. (2016). Studying macroeconomic indicators as powerful ideas. Journal of European
Public Policy, 23(3), 410-427.
Wang, Q., Chen, X., Jha, A. N., & Rogers, H. (2014). Natural gas from shale formation–the
evolution, evidences and challenges of shale gas revolution in United States. Renewable
and Sustainable Energy Reviews, 30, 1-28.
Werner, S., Inkpen, A., & Moffett, M. H. (2016). Managing Human Resources in the Oil & Gas
Industry. PennWell Books.
Document Page
ROLE OF MACROECONOMIC INDICATORS: US OIL&GAS INDUSTRY 6
chevron_up_icon
1 out of 6
circle_padding
hide_on_mobile
zoom_out_icon
[object Object]