Macroeconomics Assignment: GDP, Labour Force, and Budget Deficit
VerifiedAdded on 2021/04/21
|12
|2416
|61
Homework Assignment
AI Summary
This macroeconomics assignment provides detailed solutions to five key questions. The first question analyzes private and public savings, national savings, and the concept of a closed economy, calculating values based on given GDP, consumption, and tax figures. The second question delves into labor market dynamics, calculating the labor force size, labor force participation rate, unemployment rate, and cyclical unemployment rate based on provided employment data. The third question focuses on economic growth, comparing the real GDP growth of two countries over 100 years. The fourth question explores population growth trends and their impact on economies, drawing insights from a video. Finally, the fifth question addresses government budget deficits, examining their economic implications, the benefits of a balanced budget, and the impact of budget deficits and surpluses in different phases of the business cycle. The assignment draws on economic literature to support its answers.
Running head: MACROECONOMICS
Macroeconomics
Name of the student
Name of the university
Author Note
Macroeconomics
Name of the student
Name of the university
Author Note
Paraphrase This Document
Need a fresh take? Get an instant paraphrase of this document with our AI Paraphraser
1MACROECONOMICS
Table of Contents
Answer 1:.........................................................................................................................................2
Answer 2:.........................................................................................................................................4
Answer 3:.........................................................................................................................................5
Answer 4:.........................................................................................................................................6
Answer 5:.........................................................................................................................................7
References:....................................................................................................................................10
2MACROECONOMICS
Answer 1:
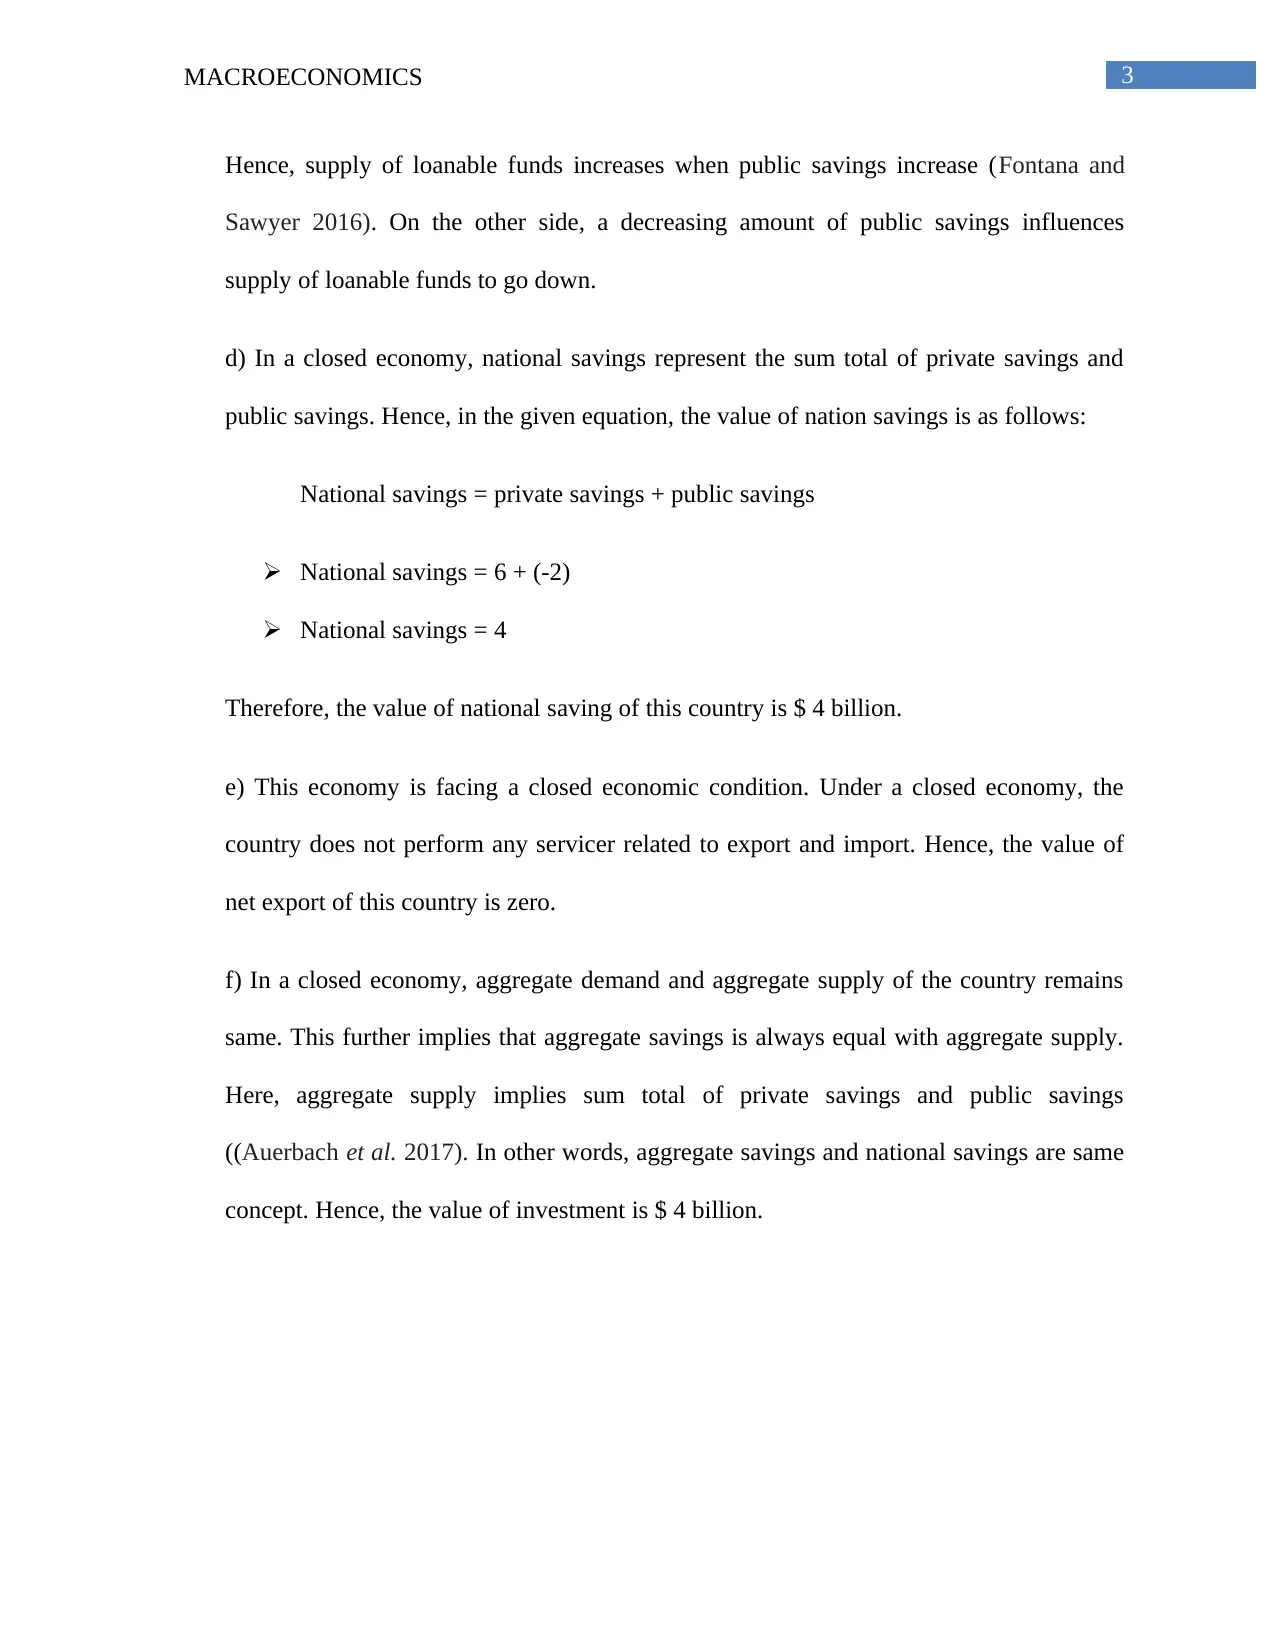
a) Private savings of a country implies the difference between gross domestic products (GDP)
with tax and consumption (Auerbach et al. 2017). In the given equation, country’s GDP is $ 20
billion, consumption (C) is $13 billion and tax revenue (T) is $ 1 billion.
Hence, the value of private savings is:
Private savings= GDP - C – T
Private savings = 20 - ( 13 + 1)
Private savings = ( 20 – 14)
Private savings = 6
Thus, the private saving is worth $6 billion.
b) The public savings represent the difference between tax revenue (T) and spending of
government (G). In the given equation, the amount of government purchase is worth $ 3 billion.
Public Savings = T – G
Public Savings = ( 1 – 3)
Public Savings = - 2
The negative value of public saving implies budget deficit. From the above
equation, it can be stated that the country is facing this phase.
c) The equation of total supply of loanable funds is as follow:
Supply of loanable funds = private savings + public savings + foreign savings
Answer 1:
a) Private savings of a country implies the difference between gross domestic products (GDP)
with tax and consumption (Auerbach et al. 2017). In the given equation, country’s GDP is $ 20
billion, consumption (C) is $13 billion and tax revenue (T) is $ 1 billion.
Hence, the value of private savings is:
Private savings= GDP - C – T
Private savings = 20 - ( 13 + 1)
Private savings = ( 20 – 14)
Private savings = 6
Thus, the private saving is worth $6 billion.
b) The public savings represent the difference between tax revenue (T) and spending of
government (G). In the given equation, the amount of government purchase is worth $ 3 billion.
Public Savings = T – G
Public Savings = ( 1 – 3)
Public Savings = - 2
The negative value of public saving implies budget deficit. From the above
equation, it can be stated that the country is facing this phase.
c) The equation of total supply of loanable funds is as follow:
Supply of loanable funds = private savings + public savings + foreign savings
⊘ This is a preview!⊘
Do you want full access?
Subscribe today to unlock all pages.
Trusted by 1+ million students worldwide
3MACROECONOMICS
Hence, supply of loanable funds increases when public savings increase (Fontana and
Sawyer 2016). On the other side, a decreasing amount of public savings influences
supply of loanable funds to go down.
d) In a closed economy, national savings represent the sum total of private savings and
public savings. Hence, in the given equation, the value of nation savings is as follows:
National savings = private savings + public savings
National savings = 6 + (-2)
National savings = 4
Therefore, the value of national saving of this country is $ 4 billion.
e) This economy is facing a closed economic condition. Under a closed economy, the
country does not perform any servicer related to export and import. Hence, the value of
net export of this country is zero.
f) In a closed economy, aggregate demand and aggregate supply of the country remains
same. This further implies that aggregate savings is always equal with aggregate supply.
Here, aggregate supply implies sum total of private savings and public savings
((Auerbach et al. 2017). In other words, aggregate savings and national savings are same
concept. Hence, the value of investment is $ 4 billion.
Paraphrase This Document
Need a fresh take? Get an instant paraphrase of this document with our AI Paraphraser
4MACROECONOMICS
Answer 2:
a) The size of the labour force within an economy is described by the total amount of
employed and unemployed workers (Krueger 2017). An employed person means those
who are working for full time and part time. On the other side, unemployed person means
those, who are not presently work but seeking for job.
Hence, in the given economy, total labour size is:
Labour force = employed workers + unemployed workers
Labour force = full-time workers + part-time workers + unemployed workers
Labour force = 7000 + 2000 +600
Labour force = 9600
b) Labour force participation rate (LFPR) implies the ratio between total numbers of
labour force with total adult population (Krueger 2017). Total adult population indicates
the difference between total number populations and people under the age group of 15.
Hence, in this equation, total number of adult population is (14300 – 3000) = 11300. This
equation can be written as follows:
LFPR = (number of people in labour force / total adult population) * 100
LFPR = (9600/ 11300) * 100
LFPR = 84.96%
c) Unemployment rate of an economy implies the ratio between number of
unemployment and labour force (Krueger, Mas and Niu 2017).
5MACROECONOMICS
Hence, in this given economy, unemployment rate implies;
Unemployment rate = (number of unemployed/labour force) * 100
Unemployment rate = (600 / 9600) * 100
Unemployment rate = 6.25%
d) Unemployment rate of a country can be obtained from the sum total of natural rate of
unemployment and cyclical rate of unemployment (Stepanok 2018). In the given
equation, natural rate of unemployment is 5% and unemployment rate is 6.25%.
Hence, from the following equation, cyclical rate of unemployment can be measured.
Unemployment rate = Natural Rate of Unemployment + Cyclical Rate of Unemployment
Cyclical rate of unemployment = Unemployment rate - Natural Rate of
Unemployment
Cyclical rate of unemployment = 6.25% - 5%
Cyclical rate of unemployment = 1.25%
Answer 3:
Today, the real GDP of both Neverland and Gotham is $20000. Neverland expects their
real GDP growth rate for the next 100 years is going to be 2%. Gotham also expects that
their real GDP growth rate for the next 100 years is 1.5%. Hence, to estimate real GDP
growth rate of each country after 100 years, P (1+r/100) n formula will be used, where r
represents GDP growth rate, P represents the real GDP of today and n indicates number
of years.
⊘ This is a preview!⊘
Do you want full access?
Subscribe today to unlock all pages.
Trusted by 1+ million students worldwide
6MACROECONOMICS
Thus, over the next 100 years, Neverland’s real GDP per capita will be
$20000(1+ 2/100)100
= $20000 (1+0.02)100
= $20000 * 7.24
= $ 144800
Moreover, Gotham’s real GDP per capita will be:
$20000(1+ 1.5/100)100
= $20000 (1+0.015)100
= $20000 * 4.43
= $ 88600
Therefore, after 100 years, real GDP of Neverland will be $144800 and that of Gotham
will be $88600.
Answer 4:
The video shows that the world population is increasing continuously. The number of
world population almost becomes double from 1960 to 2008. However, this population growth
may become stable after the year 2050. There are various reasons that will further help various
countries to prevent their population growth in future. Moreover, the basic concept regarding
negative impacts of excessive population on a country’s economy and environment is also wrong
(Casey and Galor 2017). In 1950, the number of population of some countries has increased
Paraphrase This Document
Need a fresh take? Get an instant paraphrase of this document with our AI Paraphraser
7MACROECONOMICS
significantly. However, some countries have possessed higher number of population with low
life expectancy and they are generally developing countries. Moreover, some other countries
have possessed small number of population with high life expectancy and they are called
developed countries. However, during 1950-2007, the population structure of developing
countries has changed and they have moved towards population structure of developed countries
though Africa cannot achieve higher rate of life expectancy due to various diseases (Lea et al.
2018). In this context, the professor of this video has taken example of changing population
structure of Swede, Chile and Tanzania. During 1950 to 2007, the population structure of
Sweden has grown slightly. However, population structure of Chile has increased towards a
higher life expect rate after war. However, Tanzania has faced various health issues like HIV
epidemic and so on. Hence, the country’s population growth trend has decreased slowly and the
life expectancy rate has reached to a level from where Chile has started its journey. According to
the professor, the only way to stop population is decreasing the number of family members or
making small family.
Answer 5:
The government of a country faces budget deficit when its total expenditure
exceeds total revenue, which the government collects from tax and non-tax sources. At
this situation, the government does not possess extra amount of money after spending
expenses (Biza, Kapingura and Tsegaye 2015). This further leads the government to take
debt from any national or international money lending sources.
8MACROECONOMICS
Major concern of running government deficit:
The government of a country should take major concern regarding the budget
deficit and various economic implications can support this view. Firstly, excessive
burden of debt leads an economy to an imbalance situation and this further affects entire
economic condition and well-being of that particular country, adversely (Silva, Silva and
Perera 2018). Secondly, to overcome budget deficit, the government takes loans from
domestic banks and other private institutions. This further adversely affects private
borrowers from taking loan and investing in production procedure (Lee and Ng 2015).
Thus, national income of that country will again go down. Thirdly, this excessive amount
of debt will adversely affect future generation of a country by decreasing their income
level and increasing their tax rate. Lastly, budget deficit may further cause high rate of
economic inflation within country. To overcome this condition, the government can print
money to offset the financial imbalance. However, excessive supply of money may
further cause inflation within this economy.
Economic reason to have a balanced budget:
Balanced budget occurs when total government revenue becomes equal with total
government spending. Each country wants to achieve a balanced budget so that the
country can overcome various economic shortfalls. According to some economists,
balanced economic condition helps a country to decrease its interest rate and trade deficit
(Huang, Meng and Xue 2017). Moreover, this balanced budget influences the country to
⊘ This is a preview!⊘
Do you want full access?
Subscribe today to unlock all pages.
Trusted by 1+ million students worldwide
9MACROECONOMICS
increase its aggregate amount of savings and investment. Thus, under this economic
situation, a country can achieve its economic development further.
Positive impacts of budget deficit and budget surplus:
The present business cycle of a country states that whether a budget deficit or
surplus becomes acceptable for the economy or not. If the country is facing a contraction
phase within the business cycle, then the government may choose to increase its deficit
by decreasing tax rate and increasing government expenditure. This decreasing tax rate
further influences people to enhance their consumption level and total investment level
(Biza, Kapingura and Tsegaye 2015). Moreover, increasing amount of government
expenditure further leads the county to produce more output and generate more
employment opportunity. On the other side, the government may choose surplus budget
when the country is facing expansionary phase within the business cycle.
In order to balance the budget of Australia, the government may choose
deflationary fiscal policy. By adopting this policy, the government can reduce
government expenditure on the one hand and can raise tax rate on another hand (Panjer,
de Haan and Jacobs 2017). Thus, increasing amount of tax can further help the economy
to overcome its budget deficit.
Paraphrase This Document
Need a fresh take? Get an instant paraphrase of this document with our AI Paraphraser
10MACROECONOMICS
References:
Auerbach, A.J., Grinberg, I., Barthold, T.A., Bull, N., Moomau, P.J., Moore, R., Pecoraro, B.,
Elkins, W.G., Pomerleau, K. and Page, B., 2017. Macroeconomic Modeling of Tax Policy: A
Comparison of Current Methodologies.
Biza, R.A., Kapingura, F.M. and Tsegaye, A., 2015. Do budget deficits crowd out private
investment? An analysis of the South African economy. International Journal of Economic
Policy in Emerging Economies, 8(1), pp.52-76.
Casey, G. and Galor, O., 2017. Is faster economic growth compatible with reductions in carbon
emissions? The role of diminished population growth. Environmental Research Letters, 12(1),
p.014003.
Fontana, G. and Sawyer, M., 2016. Towards post-Keynesian ecological
macroeconomics. Ecological Economics, 121, pp.186-195.
Huang, K.X., Meng, Q. and Xue, J., 2017. Balanced-budget income taxes and aggregate stability
in a small open economy. Journal of International Economics, 105, pp.90-101.
Krueger, A.B., 2017. Where have all the workers gone? An inquiry into the decline of the US
labor force participation rate. Brookings Papers on Economic Activity, pp.7-8.
Krueger, A.B., Mas, A. and Niu, X., 2017. The Evolution of Rotation Group Bias: Will the Real
Unemployment Rate Please Stand Up?. Review of Economics and Statistics, 99(2), pp.258-264.
Lea, J., Walker, S.L., Kerley, G.I., Jackson, J., Matevich, S.C. and Shultz, S., 2018. Non‐
invasive physiological markers demonstrate link between habitat quality, adult sex ratio and poor
11MACROECONOMICS
population growth rate in a vulnerable species, the Cape mountain zebra. Functional
Ecology, 32(2), pp.300-312.
Lee, S.P. and Ng, Y.L., 2015. Public debt and economic growth in Malaysia. Asian Economic
and Financial Review, 5(1), pp.119-126.
Panjer, N., de Haan, L. and Jacobs, J., 2017. Is fiscal policy in the euro area Ricardian? (No.
562). Netherlands Central Bank, Research Department.
Silva, N.L.C., Silva, N.K.L. and Perera, P.R.M.R., 2018. Effect of Government Debt on Gross
Domestic Production: Evidence from Sri Lanka. Journal for Accounting Researchers and
Educators (JARE), 1(1).
Stepanok, I., 2018. A North–South model of trade with search unemployment. European
Economic Review, 101, pp.546-566.
⊘ This is a preview!⊘
Do you want full access?
Subscribe today to unlock all pages.
Trusted by 1+ million students worldwide
1 out of 12
Related Documents


Your All-in-One AI-Powered Toolkit for Academic Success.
+13062052269
info@desklib.com
Available 24*7 on WhatsApp / Email
![[object Object]](/_next/static/media/star-bottom.7253800d.svg)
Unlock your academic potential
Copyright © 2020–2026 A2Z Services. All Rights Reserved. Developed and managed by ZUCOL.