Macroeconomics Assignment - Analyzing Economic Indicators and Policies
VerifiedAdded on 2020/05/28
|18
|2647
|59
Homework Assignment
AI Summary
This macroeconomics assignment addresses key economic concepts and their interrelationships. It begins with an analysis of GDP, exploring different approaches to its measurement and the limitations of using it as a measure of economic welfare. The assignment then delves into the labor market, examining unemployment rates, inflation, and the relationship between job vacancies and unemployment. It also explores the causes of structural unemployment and the impact of monetary policy on investment, consumption, and economic growth. The final section focuses on global economic issues, analyzing the global saving glut, the U.S. current account deficit, and the impact of exchange rates on the balance of payments, including a case study of Colombia's rose exports. The assignment utilizes graphs and economic models to illustrate the concepts discussed, providing a comprehensive overview of macroeconomic principles and their practical applications.
Running Head: MACROECONOMICS
Macroeconomics
Name of the Student
Name of the University
Author note
Macroeconomics
Name of the Student
Name of the University
Author note
Paraphrase This Document
Need a fresh take? Get an instant paraphrase of this document with our AI Paraphraser
1MACROECONOMICS
Table of Contents
Question 1: Measuring GDP and Economic Growth......................................................................2
Answer a......................................................................................................................................2
Answer b......................................................................................................................................2
Answer c......................................................................................................................................2
Answer d......................................................................................................................................3
Answer e......................................................................................................................................4
Answer f.......................................................................................................................................5
Answer g......................................................................................................................................5
Question 2: Job and Inflation...........................................................................................................6
Answer a......................................................................................................................................6
Answer b......................................................................................................................................6
Answer c......................................................................................................................................6
Answer d......................................................................................................................................7
Answer e......................................................................................................................................8
Answer f.......................................................................................................................................8
Answer g......................................................................................................................................8
Answer h......................................................................................................................................9
Question 3......................................................................................................................................12
Global saving glut and U.S Current Account............................................................................12
Answer a................................................................................................................................12
Answer b................................................................................................................................12
Answer c................................................................................................................................13
Exchange rate and Balance of Payment.....................................................................................13
Balance of Payment...................................................................................................................15
Answer a................................................................................................................................15
Answer b................................................................................................................................15
Answer c................................................................................................................................15
Answer d................................................................................................................................16
References......................................................................................................................................17
2MACROECONOMICS
Question 1: Measuring GDP and Economic Growth
Answer a
GDP under expenditure approach
GDP=Consumption expenditure+ Investment expenditure+Government exp enditure+ Net export
¿ $ 2000+$ 800+$ 400−$ 200
¿ $ 3000
Answer b
Sum of total income = $2900
Wages = $2000
Statistical Discrepancy = GDP at expenditure approach – GDP at income approach
= $3000 - $2900
=$100
Total income less wages and statistical discrepancy = $2900 - $2000 - $100
=$800
Answer c
Nominal GDP in 2015
( 1000∗$ 20 ) + ( 500∗$ 10 )
¿ 20000+5000
⊘ This is a preview!⊘
Do you want full access?
Subscribe today to unlock all pages.
Trusted by 1+ million students worldwide
3MACROECONOMICS
¿ 25000
Nominal GDP in 2016
( 1100∗$ 30 )+ ( 525∗$ 8 )
¿ $ 33000+$ 4200
¿ 37200
Answer d
Real GDP in 2016
( 1100∗$ 20 ) +(525∗$ 10)
¿ $ 22000+$ 5250
¿ $ 27250
Chain volume measure of real GDP
To determine the chain volume measure of real GDP the following information are needed
2015 quantities at 2015 prices = Nominal GDP of 2015 = $25,000
2016 quantities at 2015 prices = (1100*$20) + (525* $10) = $27,250
2015 quantities at 2016 prices = (1000 *$30) + (500 *$8) = $34,000
2016 quantities at 2016 prices = Nominal GDP of 2016 = $37,200
GDP growth rate at 2015 prices,
27250−25000
2500 0 ∗100
Paraphrase This Document
Need a fresh take? Get an instant paraphrase of this document with our AI Paraphraser
4MACROECONOMICS
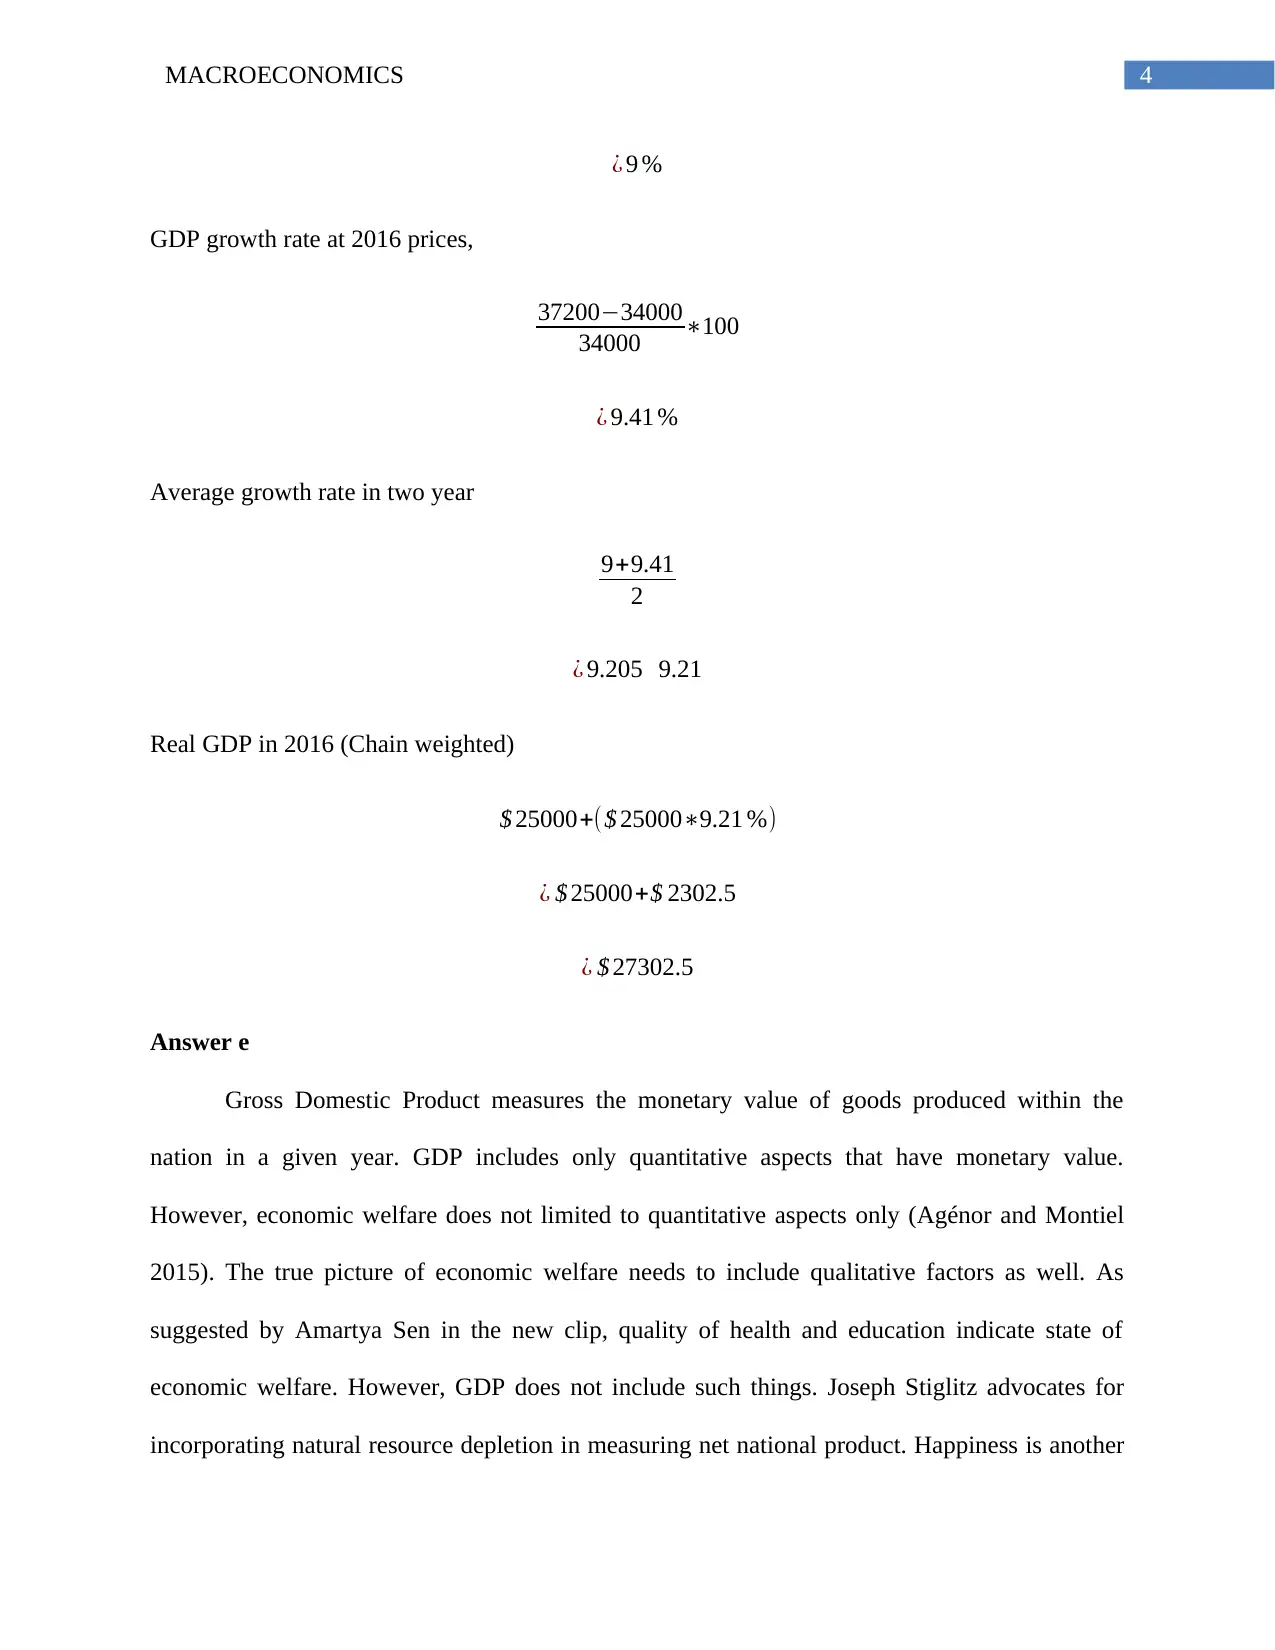
¿ 9 %
GDP growth rate at 2016 prices,
37200−34000
34000 ∗100
¿ 9.41 %
Average growth rate in two year
9+9.41
2
¿ 9.205 9.21
Real GDP in 2016 (Chain weighted)
$ 25000+($ 25000∗9.21 %)
¿ $ 25000+$ 2302.5
¿ $ 27302.5
Answer e
Gross Domestic Product measures the monetary value of goods produced within the
nation in a given year. GDP includes only quantitative aspects that have monetary value.
However, economic welfare does not limited to quantitative aspects only (Agénor and Montiel
2015). The true picture of economic welfare needs to include qualitative factors as well. As
suggested by Amartya Sen in the new clip, quality of health and education indicate state of
economic welfare. However, GDP does not include such things. Joseph Stiglitz advocates for
incorporating natural resource depletion in measuring net national product. Happiness is another
5MACROECONOMICS
thing that is not a part of GDP. These are some factors limiting the use of GDP as a measure of
economic welfare.
Answer f
GDP includes factors that have monetary values. There is no monetary unit of measuring
quality of health and education. Government provides these services as free in order to ensure a
minimum standard health and education. Those services cannot be measure in monetary terms.
Another factor is depilation of natural resources. Natural resources are used in productive
activities. GDP measures the value of final output. Continuous use of natural resources ends up
stock of these resources (Scarth 2014). The rate depletion cannot be modelled. Happiness is
another factor that cannot be indexed. Therefore, though all these factors have their own merit in
presenting economic welfare the question remain regarding whether they are as compatible as
reliability, impartiality and frequency of GDP.
Answer g
Human Development Index measures progress of a nation in terms of three basic
indicators of human development – a healthy and long life, having access to education and
decent living standard. The ranking of Australia with respect to Human Development Index is
second, next to Norway. The HDI value of Australia is 0.939 (hdr.undp.org 2018). Australia
shared the same position in HDI ranking with Norway. Life expectancy at birth in Australia is
recorded as 82.5 years, which is even greater than that in Norway having 81.7 years of life
expectancy. The expected years of schooling for Australia is 20.4 years. This is again higher than
Norway that have 17.7 years of expected schooling and Switzerland having 16 years. In terms of
average schooling years, Australia is ahead of Norway. The average years of schooling in
Australia is 13.2 years. Therefore, in terms of health and education Australia is in a better
⊘ This is a preview!⊘
Do you want full access?
Subscribe today to unlock all pages.
Trusted by 1+ million students worldwide
6MACROECONOMICS
position than most other nation. This signifies remarkable progress of Australia in Human
development.
Question 2: Job and Inflation
Answer a
Labor force particiaption rate ( % ) = Labor force
Working age populaion∗100
¿ , 69.6= Labor force
18429726 ∗100
¿ , labor force=12,827,089.292 12,827,089
Answer b
Employment ¿ population ratio= Number of people employed
working age population ∗100
¿ , 65.2= Number of people employed
18,429,726 ∗100
¿ , number of employed people=12,016,181.352 12,016,181
Answer c
Labor force ∈November 2015=3,803,200−300
¿ 3,802,900
Number of people unemployed in October 2015 = 200,500
Labor force = 3,803, 200
Therefore,
Number of people employed in 2015 = 3,803, 200 - 200,500
Paraphrase This Document
Need a fresh take? Get an instant paraphrase of this document with our AI Paraphraser
7MACROECONOMICS
= 3,602,700
Number of peopleemployed ∈ November 2015=3,602,700+ 2,900
¿ 3,605,600
Therefore,
Number of peopleunemployed ∈november 2015=3,802,900−3,605,600
¿ 197,300
Unemployment rate∈ November 2015= 197,300
3,802,900∗100
¿ 5.12
Answer d
Expenditure on juice in the base year = $40
Price of juice per bottle in the base year = $4
Therefore, bottle of juice consumed in the base year = $40/$4 = 10
Expenditure on cloth in the base year = $25
Price of cloth per length in the base year was = $5
Therefore, length of clothe used in base year = $25/$5 = 5
CPI2016= ( 10∗$ 4 ) + ( 5∗$ 6 )
¿ $ 40+ $ 30
¿ $ 70
8MACROECONOMICS
Answer e
CPI2015=$ 40+$ 25
¿ $ 65
Rate of inflation=CPI 2016−CPI2015
CPI2015
∗100
¿ 70−65
65 ∗100
¿ 7.69 %
The inflation rate implies that average price level increases by 7.69%.
Answer f
There is a close relation between the rate of job vacancy and consequent unemployment
rate. The higher vacancy in general should be accompanied with a low unemployment rate.
However, in recent years the positive relation between vacancy rate and unemployment rate does
not held up well Australia. The unemployed workers find it difficult to get work. This is perhaps
because of locational mismatch and mismatch of skills. Job are not created in areas where
unemployed person are (theguardian.com 2016). The skills of unemployed workers might not
match with skills required to fill the vacancies.
Answer g
The people who are unable to find jobs are part of economy’s structural unemployment.
Structural unemployment refers to the type of unemployment where people remain unemployed
because of structural mismatches. Cyclical unemployment on the other hand implies
unemployment arising from business cycle fluctuation (Heijdra 2017). In Australia, the scenario
⊘ This is a preview!⊘
Do you want full access?
Subscribe today to unlock all pages.
Trusted by 1+ million students worldwide
9MACROECONOMICS
of labor market change as compared to past. The problem that Australia is facing is that despite
growing number of job vacancies the employment growth has slowed down. Job vacancies are
higher in states like Victoria and New South Wales while it is weak for states like Western
Australia, Northern Territory and Queensland. Because of uneven distribution of job vacancies,
problem of unemployment remain in Western Australia, Northern Territory and Queensland.
Vacancies are mostly in industries like administration and support industry, followed by retail
trade. Among the top five industries having most number of job vacancies have highest share of
part time workers. Hence, people are still looking for full time jobs. As unemployed people are
unable to get work because of locational mismatch or skill mismatch, it is part of economy’s
structural unemployment.
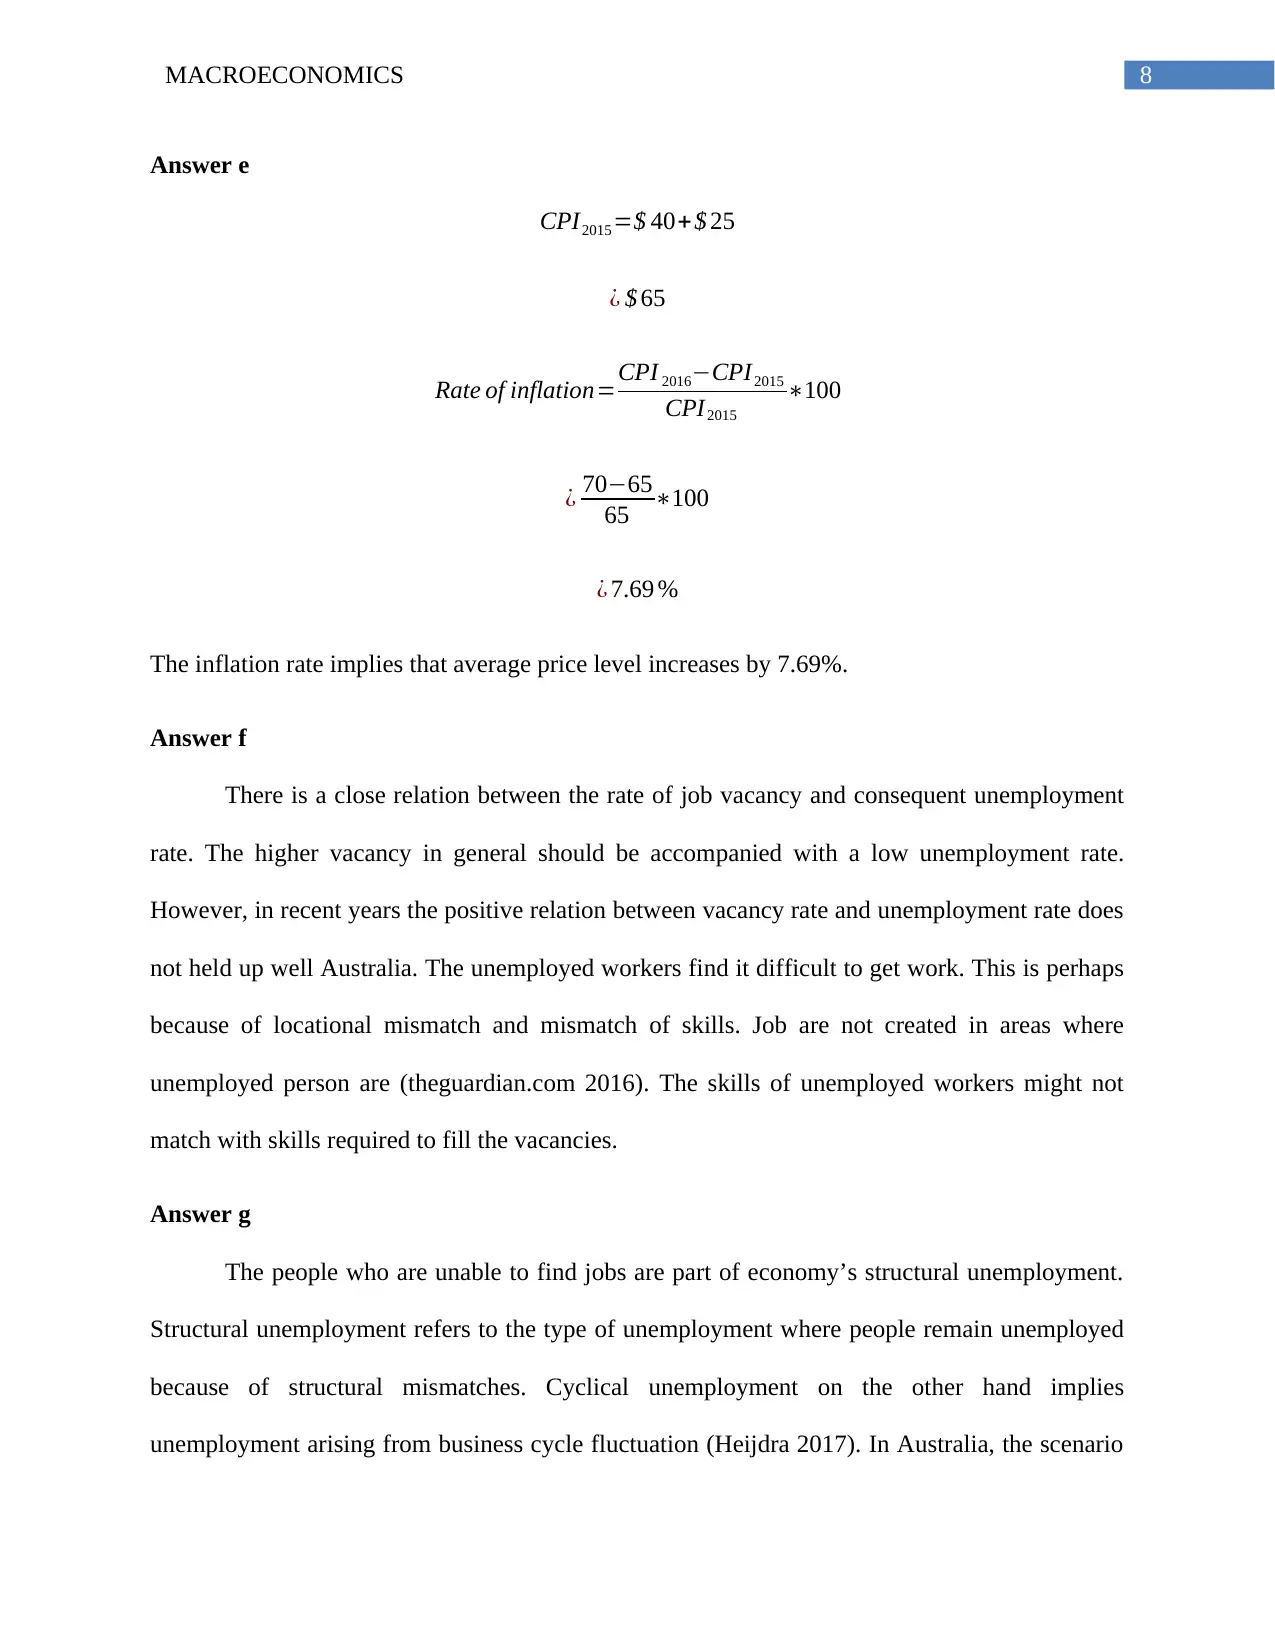
Answer h
The quantity expansion of euro money effect different nominal and real variables of the
economy. There are channels through which the effect of such quantity expansion affects
economic growth (Mankiw 2014). The first direct impact is on interest rate.
Figure 1: effect of quantity expansion of money on interest rate
(Source: as created by Author)
of labor market change as compared to past. The problem that Australia is facing is that despite
growing number of job vacancies the employment growth has slowed down. Job vacancies are
higher in states like Victoria and New South Wales while it is weak for states like Western
Australia, Northern Territory and Queensland. Because of uneven distribution of job vacancies,
problem of unemployment remain in Western Australia, Northern Territory and Queensland.
Vacancies are mostly in industries like administration and support industry, followed by retail
trade. Among the top five industries having most number of job vacancies have highest share of
part time workers. Hence, people are still looking for full time jobs. As unemployed people are
unable to get work because of locational mismatch or skill mismatch, it is part of economy’s
structural unemployment.
Answer h
The quantity expansion of euro money effect different nominal and real variables of the
economy. There are channels through which the effect of such quantity expansion affects
economic growth (Mankiw 2014). The first direct impact is on interest rate.
Figure 1: effect of quantity expansion of money on interest rate
(Source: as created by Author)
Paraphrase This Document
Need a fresh take? Get an instant paraphrase of this document with our AI Paraphraser
10MACROECONOMICS
The supply of real money balance is fixed and therefore is given by a vertical straight
line. The money demand curve is DD. The interest rate is in the money market is determined
from the intersection of money supply and money demand cure. The initial equilibrium is at E.
Prevailing interest rate is r*. Now, when EU increases the quantity if Euro then the money
supply curve shifts rightward from S to S1. The equilibrium shifts from E to E1. At the new
equilibrium the interest rate decreases from r* to r1.
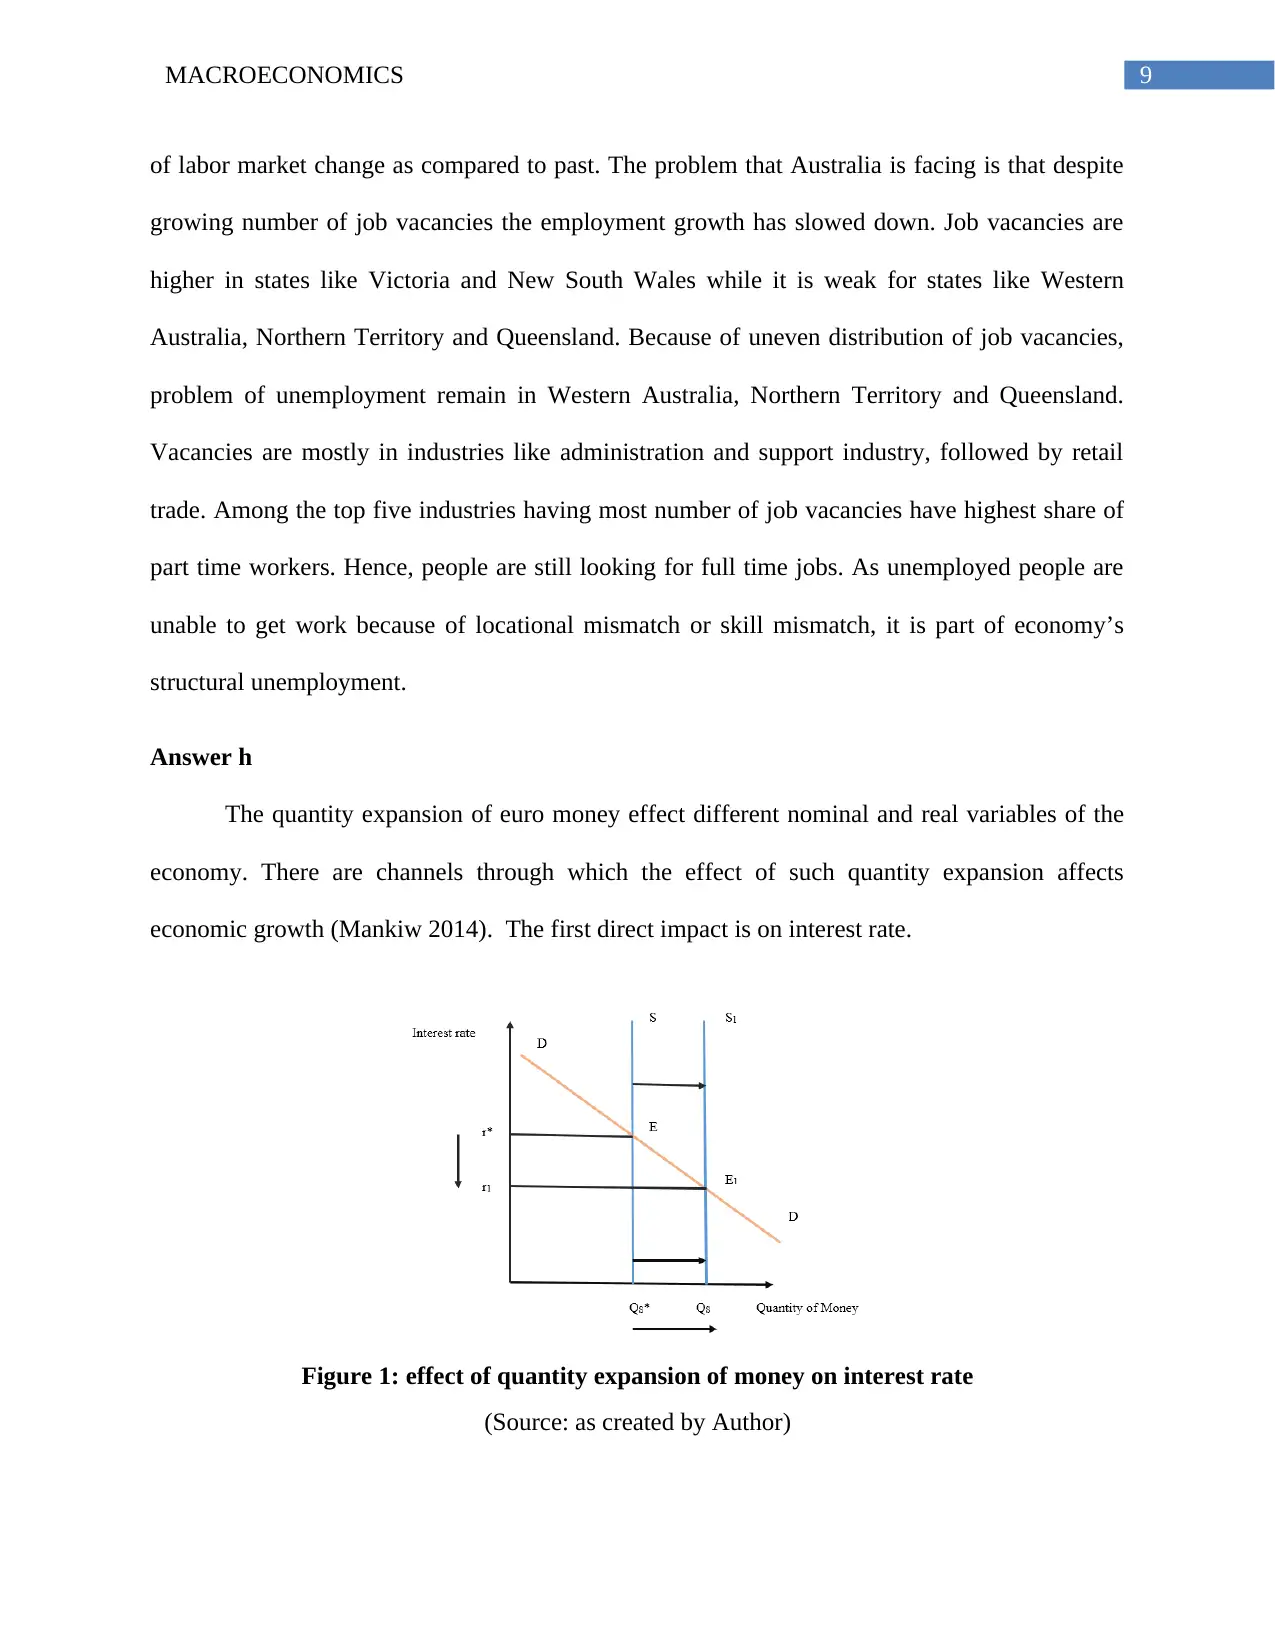
Figure 2: Effect on investment
(Source: as created by Author)
The direct effect of interest rate is on the investment. Interest rate is the cost of
investment and hence s inversely proportional to investment. When interest rate is r* then I* is
the investment demand. As the interest rate declines from r* to r1, investment increases from I*
to I1.
The supply of real money balance is fixed and therefore is given by a vertical straight
line. The money demand curve is DD. The interest rate is in the money market is determined
from the intersection of money supply and money demand cure. The initial equilibrium is at E.
Prevailing interest rate is r*. Now, when EU increases the quantity if Euro then the money
supply curve shifts rightward from S to S1. The equilibrium shifts from E to E1. At the new
equilibrium the interest rate decreases from r* to r1.
Figure 2: Effect on investment
(Source: as created by Author)
The direct effect of interest rate is on the investment. Interest rate is the cost of
investment and hence s inversely proportional to investment. When interest rate is r* then I* is
the investment demand. As the interest rate declines from r* to r1, investment increases from I*
to I1.
11MACROECONOMICS
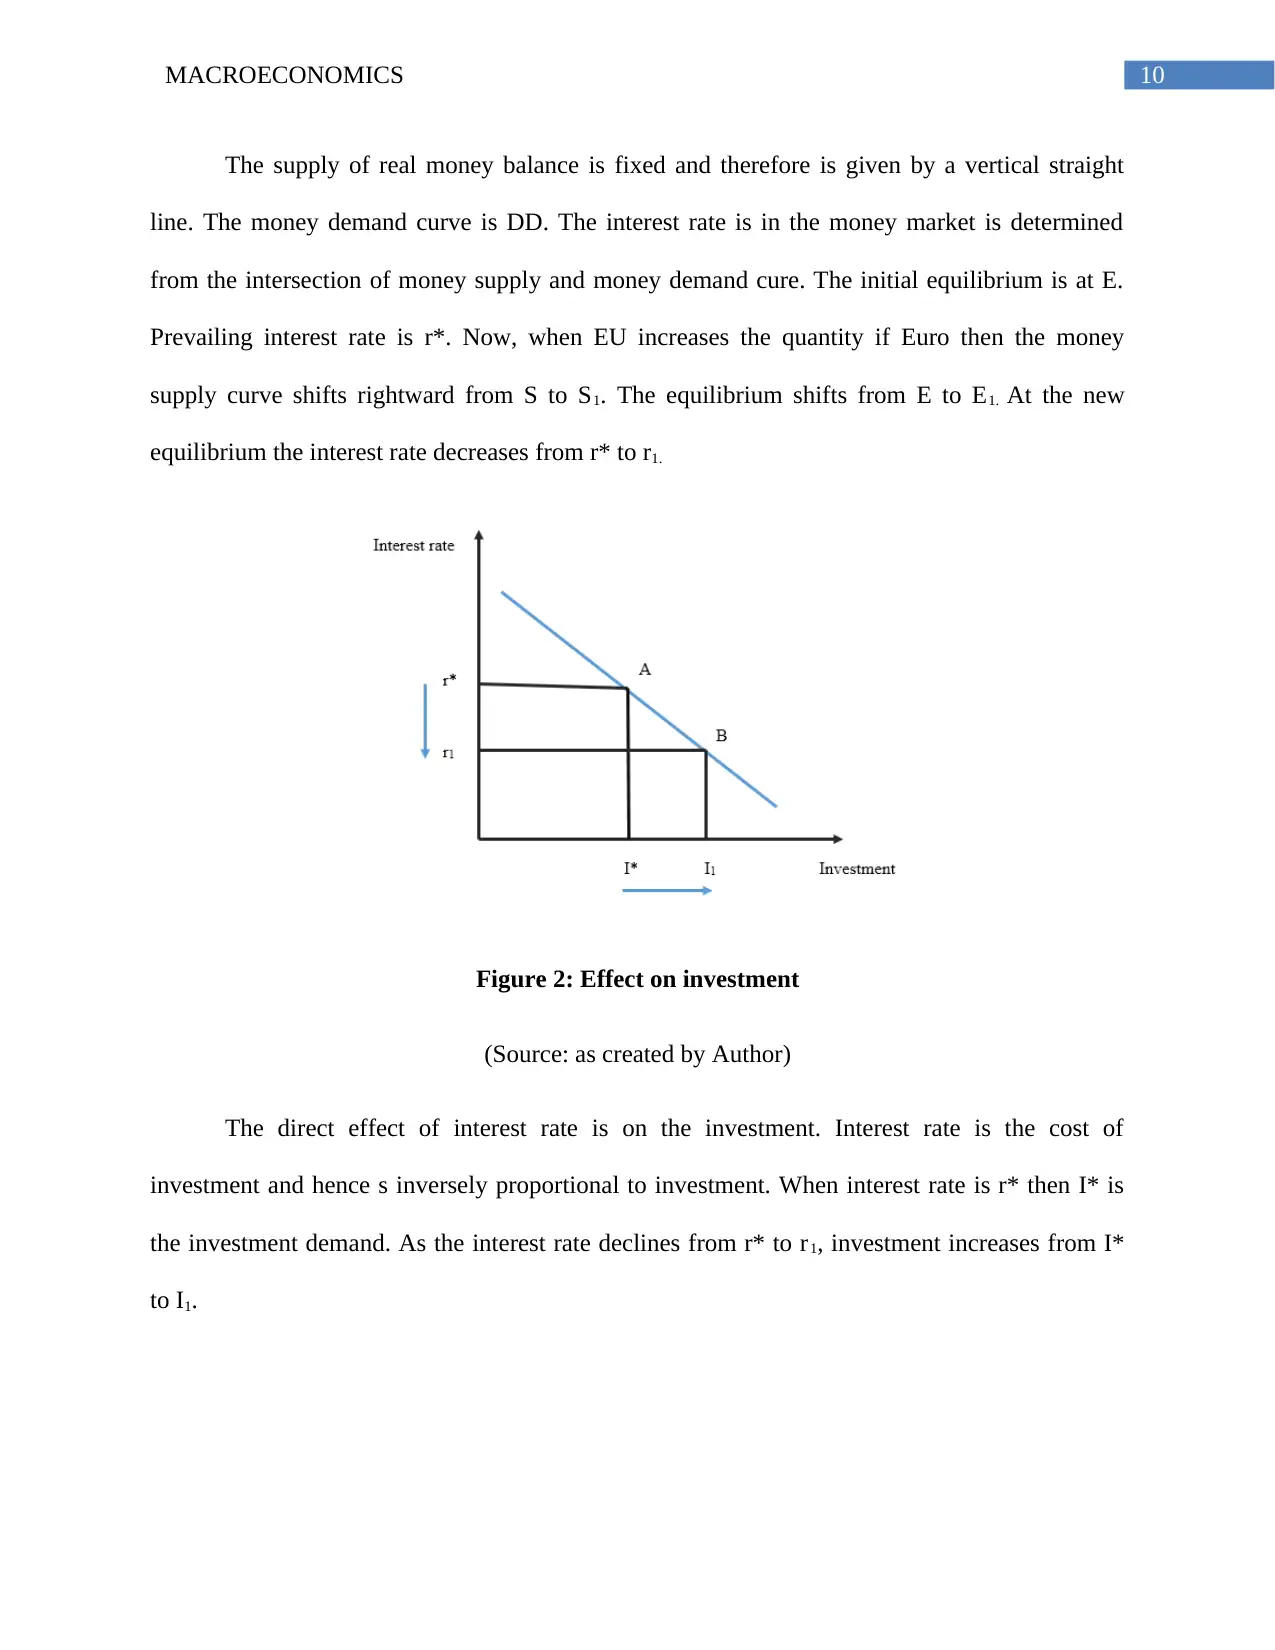
Figure 3: effect on consumption and economic growth
(Source: as created by Author)
When invested funds are used for expanding production then more goods are available in
the economy for consumption. With investment expansion, new job opportunities are created and
hence, employment increases. All this affect the planned expenditure curve. The equilibrium
output or income is determined from the intersection of actual and planned expenditure (Uribe
and Schmitt-Grohé 2017). As the actual expenditure curve shifts upward, the economy’s output
will shift from Y* to Y1 leading to an economic growth.
⊘ This is a preview!⊘
Do you want full access?
Subscribe today to unlock all pages.
Trusted by 1+ million students worldwide
1 out of 18
Related Documents


Your All-in-One AI-Powered Toolkit for Academic Success.
+13062052269
info@desklib.com
Available 24*7 on WhatsApp / Email
![[object Object]](/_next/static/media/star-bottom.7253800d.svg)
Unlock your academic potential
Copyright © 2020–2026 A2Z Services. All Rights Reserved. Developed and managed by ZUCOL.