Macroeconomics Assignment Report - University Name

Verified

Added on  2021/12/20

|6
|411
|49
Report
AI Summary
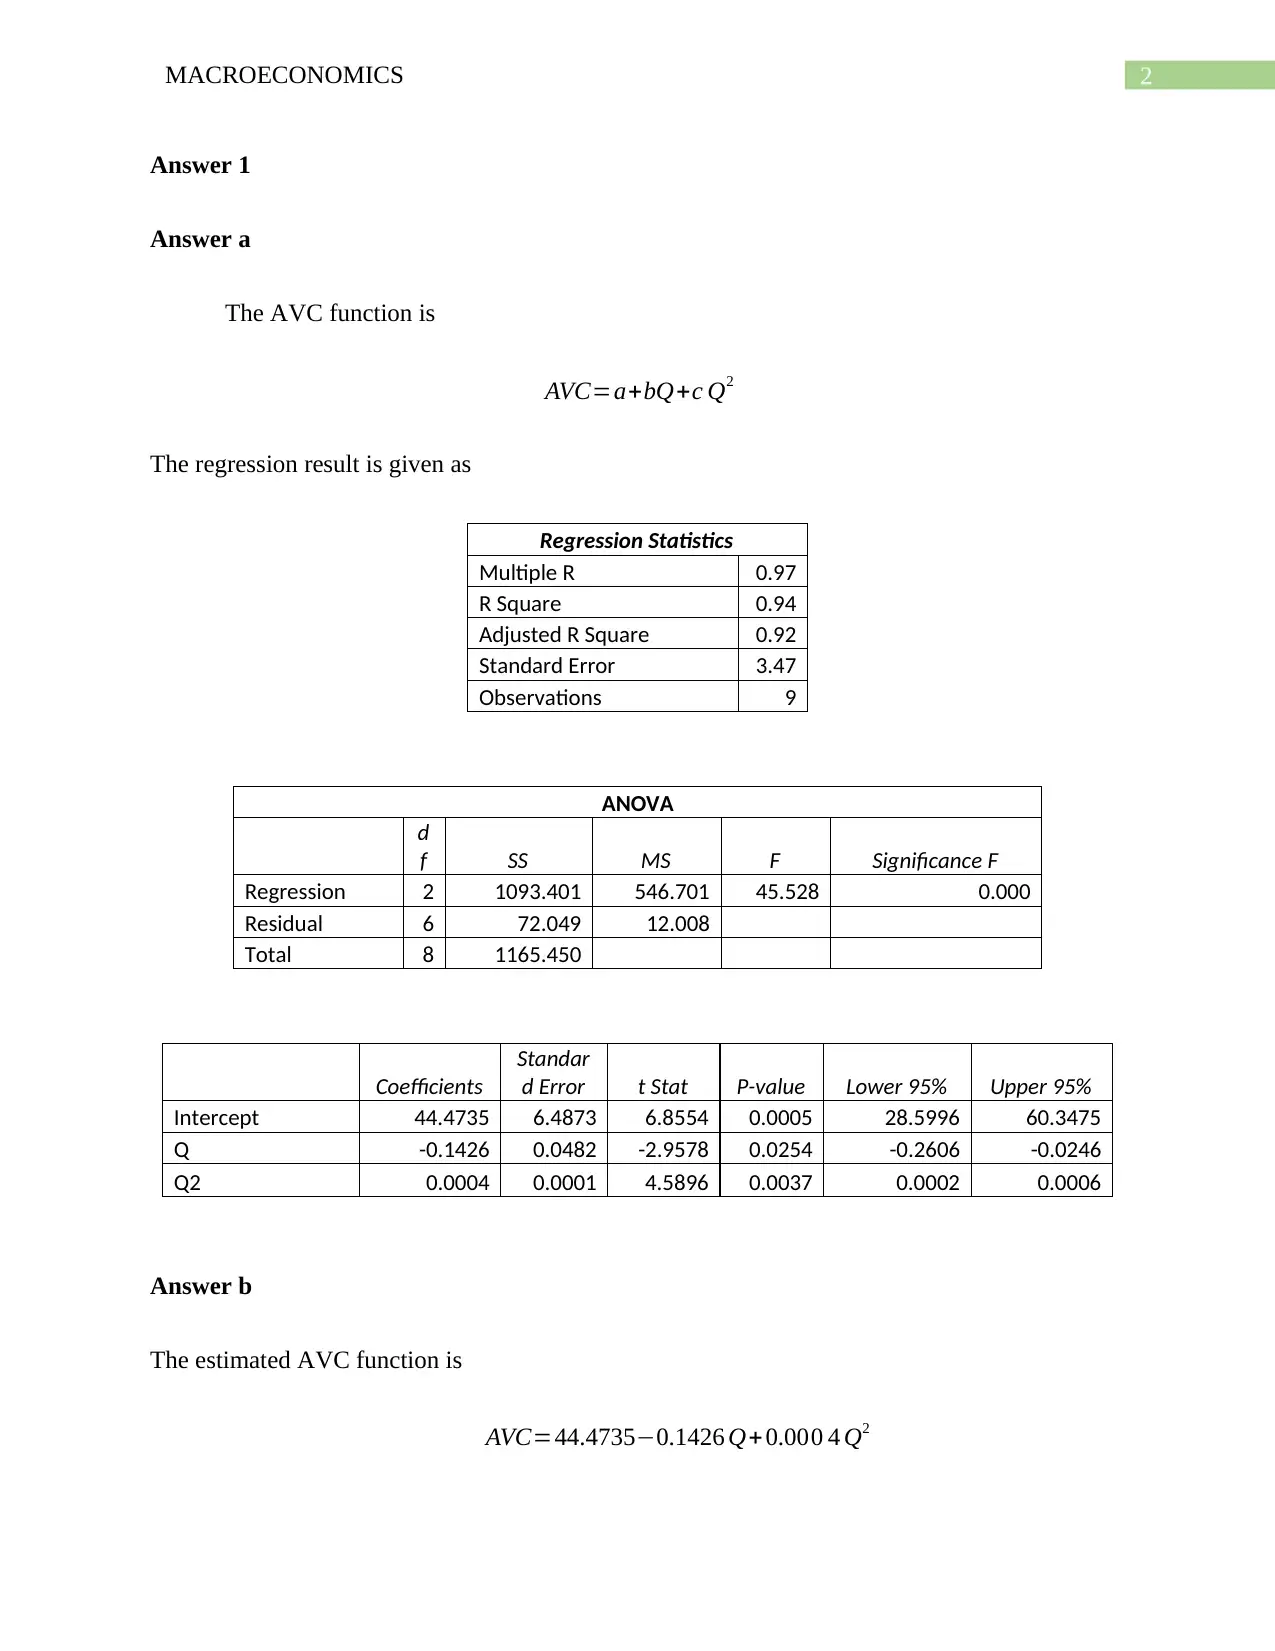
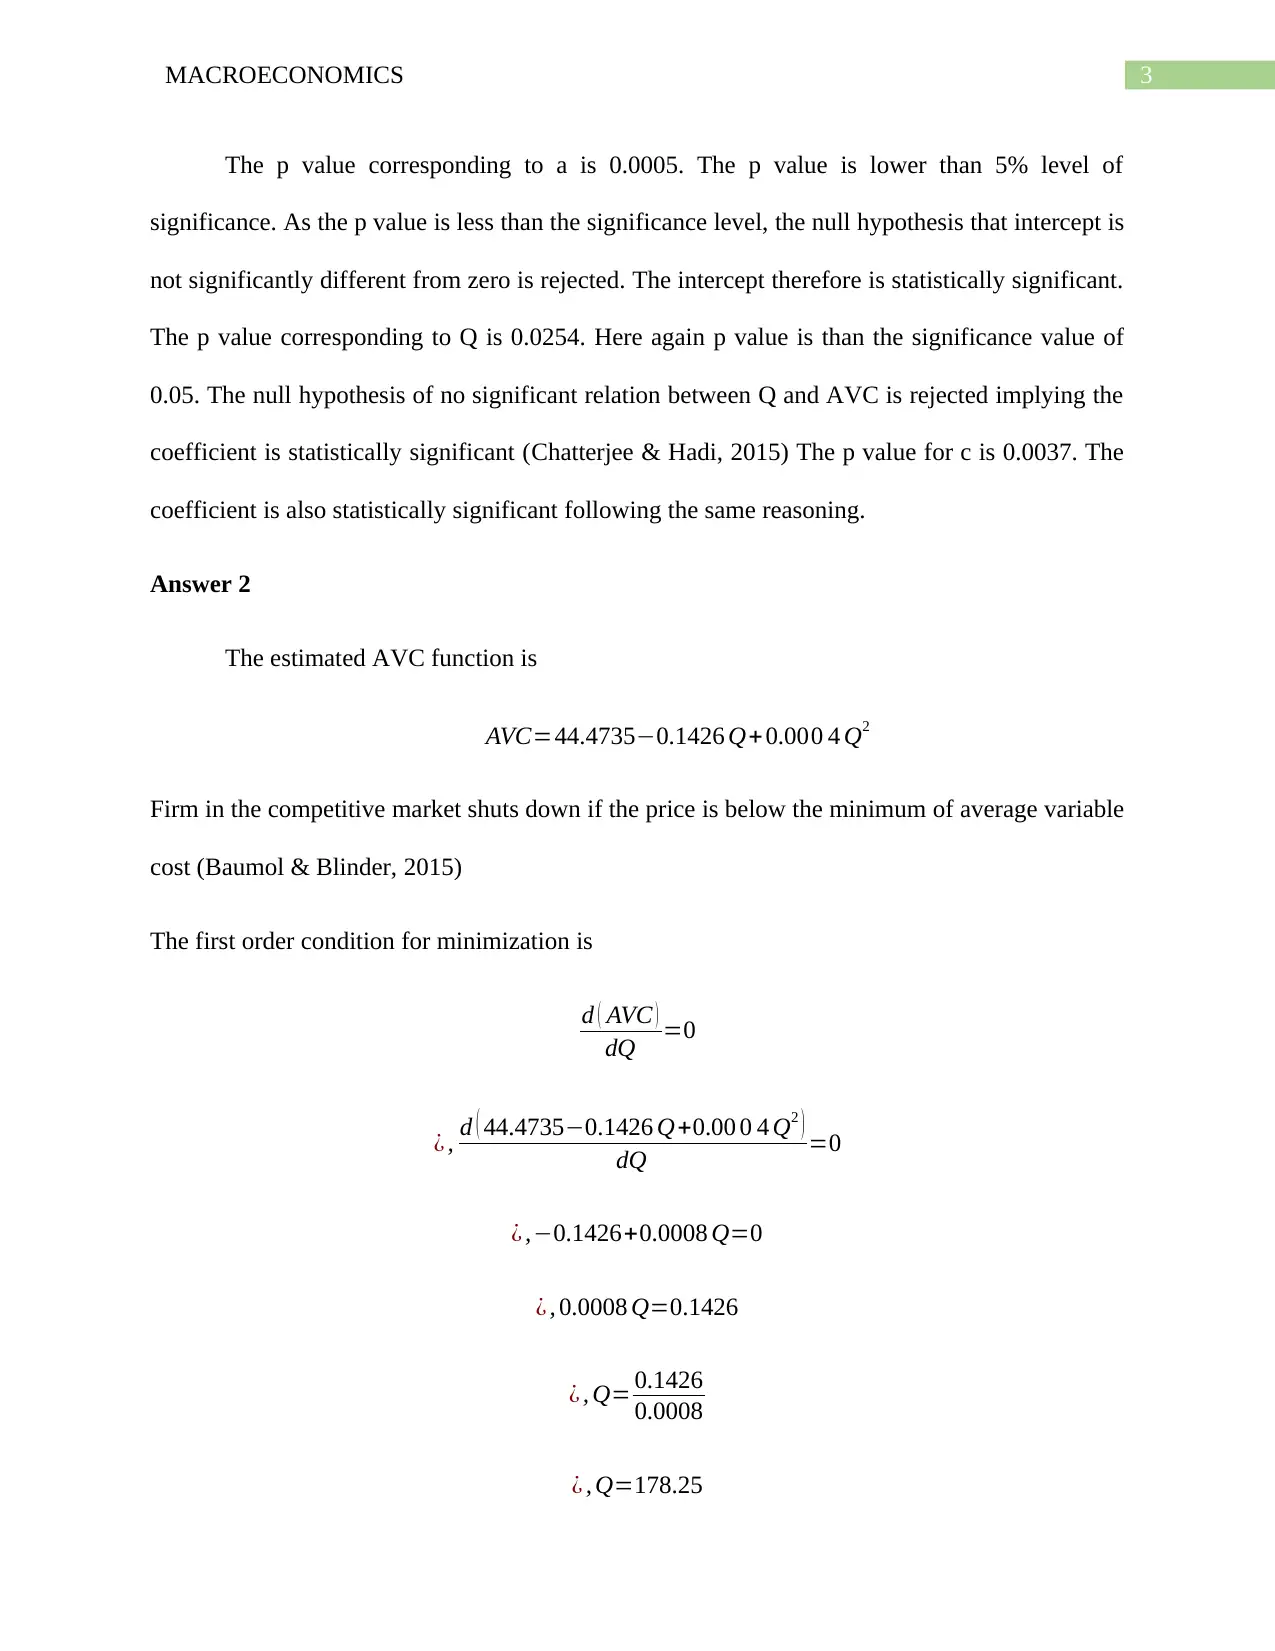
This report presents a solution to a macroeconomics assignment. It begins with an analysis of the Average Variable Cost (AVC) function, including regression results and the statistical significance of the intercept and coefficients. The report then delves into the conditions for a firm to shut down in a competitive market, comparing the market price to the minimum AVC. Finally, it determines the profit-maximizing output level using the estimated Short-Run Marginal Cost (SMC) function derived from the regression analysis, providing a comprehensive overview of cost functions and market behavior in the short run. References to relevant economic literature are also included.
Document Page
Running head: MACROECONOMICS
Macroeconomics
Name of the Student
Name of the University
Course ID
tabler-icon-diamond-filled.svg

Paraphrase This Document

Need a fresh take? Get an instant paraphrase of this document with our AI Paraphraser
Document Page
1MACROECONOMICS
Table of Contents
Answer 1..........................................................................................................................................2
Answer a......................................................................................................................................2
Answer b......................................................................................................................................2
Answer 2..........................................................................................................................................3
Answer b......................................................................................................................................4
References........................................................................................................................................5
Document Page
2MACROECONOMICS
Answer 1
Answer a
The AVC function is
AVC=a+bQ+c Q2
The regression result is given as
Regression Statistics
Multiple R 0.97
R Square 0.94
Adjusted R Square 0.92
Standard Error 3.47
Observations 9
ANOVA
d
f SS MS F Significance F
Regression 2 1093.401 546.701 45.528 0.000
Residual 6 72.049 12.008
Total 8 1165.450
Coefficients
Standar
d Error t Stat P-value Lower 95% Upper 95%
Intercept 44.4735 6.4873 6.8554 0.0005 28.5996 60.3475
Q -0.1426 0.0482 -2.9578 0.0254 -0.2606 -0.0246
Q2 0.0004 0.0001 4.5896 0.0037 0.0002 0.0006
Answer b
The estimated AVC function is
AVC=44.47350.1426 Q+ 0.000 4 Q2
Document Page
3MACROECONOMICS
The p value corresponding to a is 0.0005. The p value is lower than 5% level of
significance. As the p value is less than the significance level, the null hypothesis that intercept is
not significantly different from zero is rejected. The intercept therefore is statistically significant.
The p value corresponding to Q is 0.0254. Here again p value is than the significance value of
0.05. The null hypothesis of no significant relation between Q and AVC is rejected implying the
coefficient is statistically significant (Chatterjee & Hadi, 2015) The p value for c is 0.0037. The
coefficient is also statistically significant following the same reasoning.
Answer 2
The estimated AVC function is
AVC=44.47350.1426 Q+ 0.000 4 Q2
Firm in the competitive market shuts down if the price is below the minimum of average variable
cost (Baumol & Blinder, 2015)
The first order condition for minimization is
d ( AVC )
dQ =0
¿ , d ( 44.47350.1426 Q+0.00 0 4 Q2 )
dQ =0
¿ ,0.1426+0.0008 Q=0
¿ , 0.0008 Q=0.1426
¿ , Q= 0.1426
0.0008
¿ , Q=178.25
tabler-icon-diamond-filled.svg

Paraphrase This Document

Need a fresh take? Get an instant paraphrase of this document with our AI Paraphraser
Document Page
4MACROECONOMICS
The minimum of AVC thus is
AVC=44.47350.1426 Q+0.000 4 Q2
¿ 44.4735 ( 0.1426 ×178.25 ) + ( 0.004 ×178.25 )
¿ 30.56
The price in the market is given as $50
At price exceeds the minimum of AVC, the firm should not shut down in the short run.
Answer b
^SMC= ^a+2 ^b Q+3 ^c Q2
Using coefficient value from the regression the SMC function can be written as
SMC=44.47350.2852Q+ 0.012Q2
Profit maximization condition in the short run,
P=SMC
¿ , 50=44.47350.2852Q+0.012 Q2
¿ , 0.012Q20.2852Q5.5265=0
Solving for Q,
Q = 36.41
The profit maximizing output level for firm thus is 36.41 or 36.
References
Document Page
5MACROECONOMICS
Baumol, W. J., & Blinder, A. S. (2015). Microeconomics: Principles and policy. Nelson
Chatterjee, S., & Hadi, A. S. (2015). Regression analysis by example. John Wiley & Sons.
chevron_up_icon
1 out of 6
circle_padding
hide_on_mobile
zoom_out_icon
[object Object]