Macroeconomics Report: Analysis of the Australian Economy (2018)
VerifiedAdded on 2020/10/22
|12
|2620
|88
Report
AI Summary
This report provides a comprehensive analysis of the Australian economy, focusing on the prevailing equilibrium of interest rates and output, the short-run effects of the resources boom collapse, and the policies implemented to counter adverse impacts. The report utilizes the IS-LM model to explain macroeconomic dynamics and assesses the effects of the mining boom on key economic indicators such as unemployment, inflation, and the real exchange rate. It also evaluates the effectiveness of monetary and fiscal policies in mitigating economic challenges. Furthermore, the report examines the long-term consequences of inaction, particularly on household income, consumption, and the composition of consumption within the Australian economy. The analysis draws upon various economic models and data to provide a nuanced understanding of the Australian economic landscape and the interrelation of various economic factors.

Macroeconomics
Paraphrase This Document
Need a fresh take? Get an instant paraphrase of this document with our AI Paraphraser
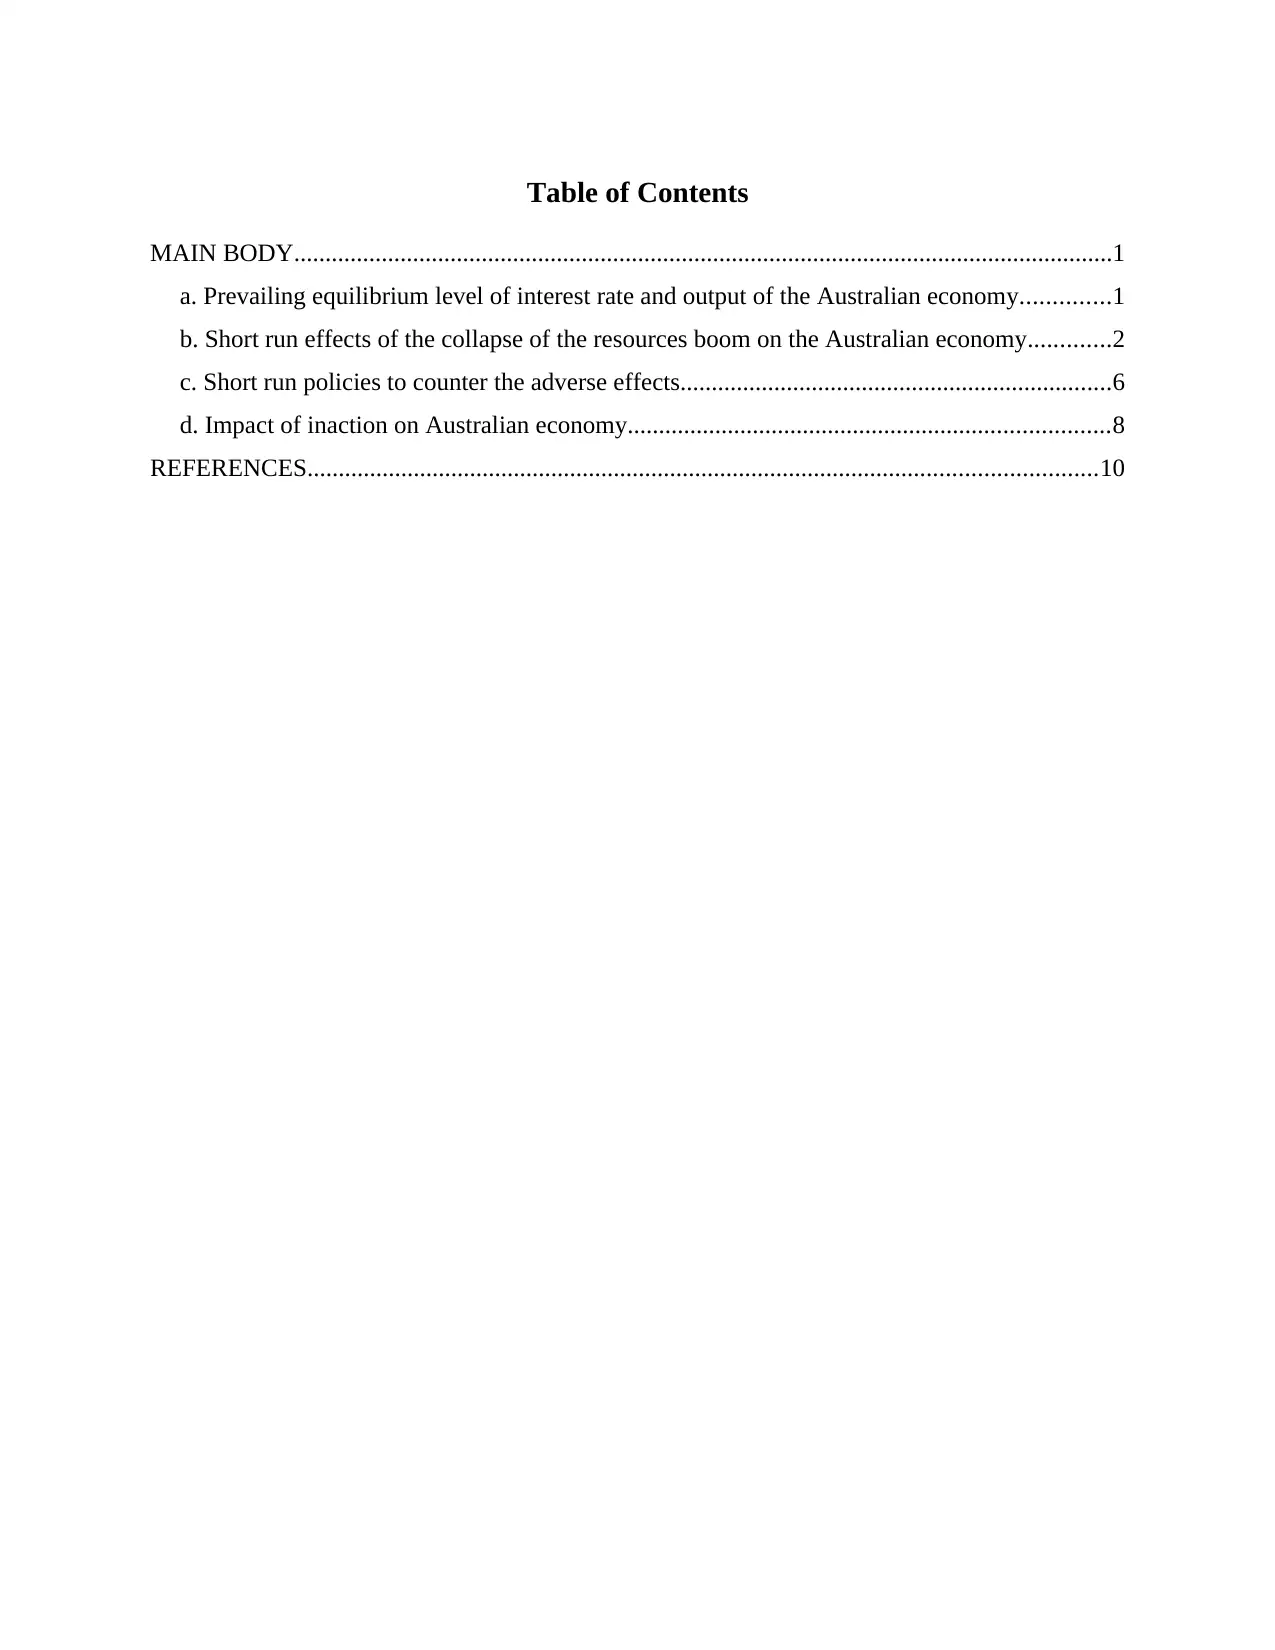
Table of Contents
MAIN BODY...................................................................................................................................1
a. Prevailing equilibrium level of interest rate and output of the Australian economy..............1
b. Short run effects of the collapse of the resources boom on the Australian economy.............2
c. Short run policies to counter the adverse effects.....................................................................6
d. Impact of inaction on Australian economy.............................................................................8
REFERENCES..............................................................................................................................10
MAIN BODY
a. Prevailing equilibrium level of interest rate and output of the Australian economy
Australia is currently (2018) operating at both internal and external balance. Inflation is
tracking around 1.9 per cent per annum which is within the RBA’s inflation rate target of 2‐3 per
cent per annum. The unemployment rate is around 5.5 per cent per annum which is close to the
trend rate of unemployment. The official cash rate has remained constant at 1.5 per cent since
August of 2016. the resources boom crash in 2019 due to an abrupt fall in demand in the rest of
the world.
Due to increase in prices and Stable rate of interest recorded in last year is 1.5% and
inflated up-to 1.9% . In recent years target interest rate(short term) have declined to zero and
cannot go further downwards (nominal interest rates for the most part cannot be negative). Hence
interest rate can't decline and equilibrium interest rate remains positive . However fiscal policy
can increase output which cause monetary policy becomes ineffective (Agénor and Montiel,
2015).
The IS-LM (Investment Saving– Liquidity Preference Money Supply) model is a
macroeconomic model that graphically represents two intersecting curves. The
investment/saving (IS) curve is a variation of the income-expenditure model incorporating
market interest rates (demand), while the liquidity preference/money supply equilibrium (LM)
curve represents the amount of money available for investing (supply) .the IS-LM model has
been one of the main tools for macroeconomic teaching and policy analysis. The IS-LM model
describes the aggregate demand of the economy using the relationship between output and
interest rates. In a closed economy, in the goods market, a rise in interest rate reduces aggregate
demand, usually investment demand and/or demand for consumer durables. This lowers the level
of output and results in equating the quantity demanded with the quantity produced. This
condition is equal to the condition that planned investment equals saving. The negative
relationship between interest rate and output is known as the IS curve.
1
⊘ This is a preview!⊘
Do you want full access?
Subscribe today to unlock all pages.
Trusted by 1+ million students worldwide
Y IS1 LM2 LM1
interest rate i2 a1
i1 a
IS1
0 X
Aggregate output
Above figure, In a closed economy, in the goods market, a rise in interest rate reduces
aggregate demand, usually investment demand . This lowers the level of output and results in
equating the quantity demanded with the quantity produced. This condition is equal to the
condition that planned investment equals saving. The negative relationship between interest rate
and output is known as the IS curve, LM curve shifts towards left due fall in output level (Borio,
2014).
b. Short run effects of the collapse of the resources boom on the Australian economy
The sudden rise in the prices of natural resources in Australia and the related conceived
increase in Australian founded capability to provide primal commodities is one of the huge
economic boom in Australia's history. It begun in 2003 when there is high demand of iron and
coal in market and the prices started rising. The boom in 2005 was mainly related to the
increased demand of major export commodities of the nation. Consumption of coal and iron is
continuously increasing in Australia, hence the government has to ship large quantity of coal and
iron. The rise in demand has been impelled in large part by speedy growth of central emergent
market economies. The rise in demand has also stretched the world wide capacity of suppliers
(Brunnermeier, Eisenbach and Sannikov, 2012).
The prices of Australian mining is increasing continuously, and its has also increased the
investment of mining sector in GDP of the nation. The mining boom is the largest shock to the
economy of the country. This boom has considerably increased the living standard of country. It
has increased per capital household disposable income and real wages and decreased
2
Paraphrase This Document
Need a fresh take? Get an instant paraphrase of this document with our AI Paraphraser
unemployment rate within the country. But it is not that all parts of economy get benefits
because of this boom. It has decreased the manufacturing employment share of the country. It
has also taken the Australian dollar high with a huge appreciation in it, which has provided
weight to various industries like agriculture and manufacturing. The impact can be assessed by
analysing the increased purchasing power and volume of output.
The major impact of mining boom was on exchange rate, it has comparatively increased
after it. Unemployment rates of Australia has decreased after this boom. The inflation rates are
affected too because increased demand has affected supply of products that decreased the
inflation rates. This boom was the best source to earn money in a small period because there is a
huge demand of natural products in the market and the merchants who have optimum resources
to sale, they have earned good profits with the same by setting high prices to products. As it has
resulted in incredible profits, till the stock of iron and coal ends.
Mining boom was very auspicious for Australia, because when all the countries are
dealing with low and weak economy at the same time Australian economy was continuously
rising with a higher level of growth. In other countries unemployment rates are endlessly
increasing but the boom helps Australia to overrode that situation within the nation in a short
period of time (Burda and Wyplosz, 2013).
There are following main impacts of mining boom in Australia:
Unemployment rate:
3
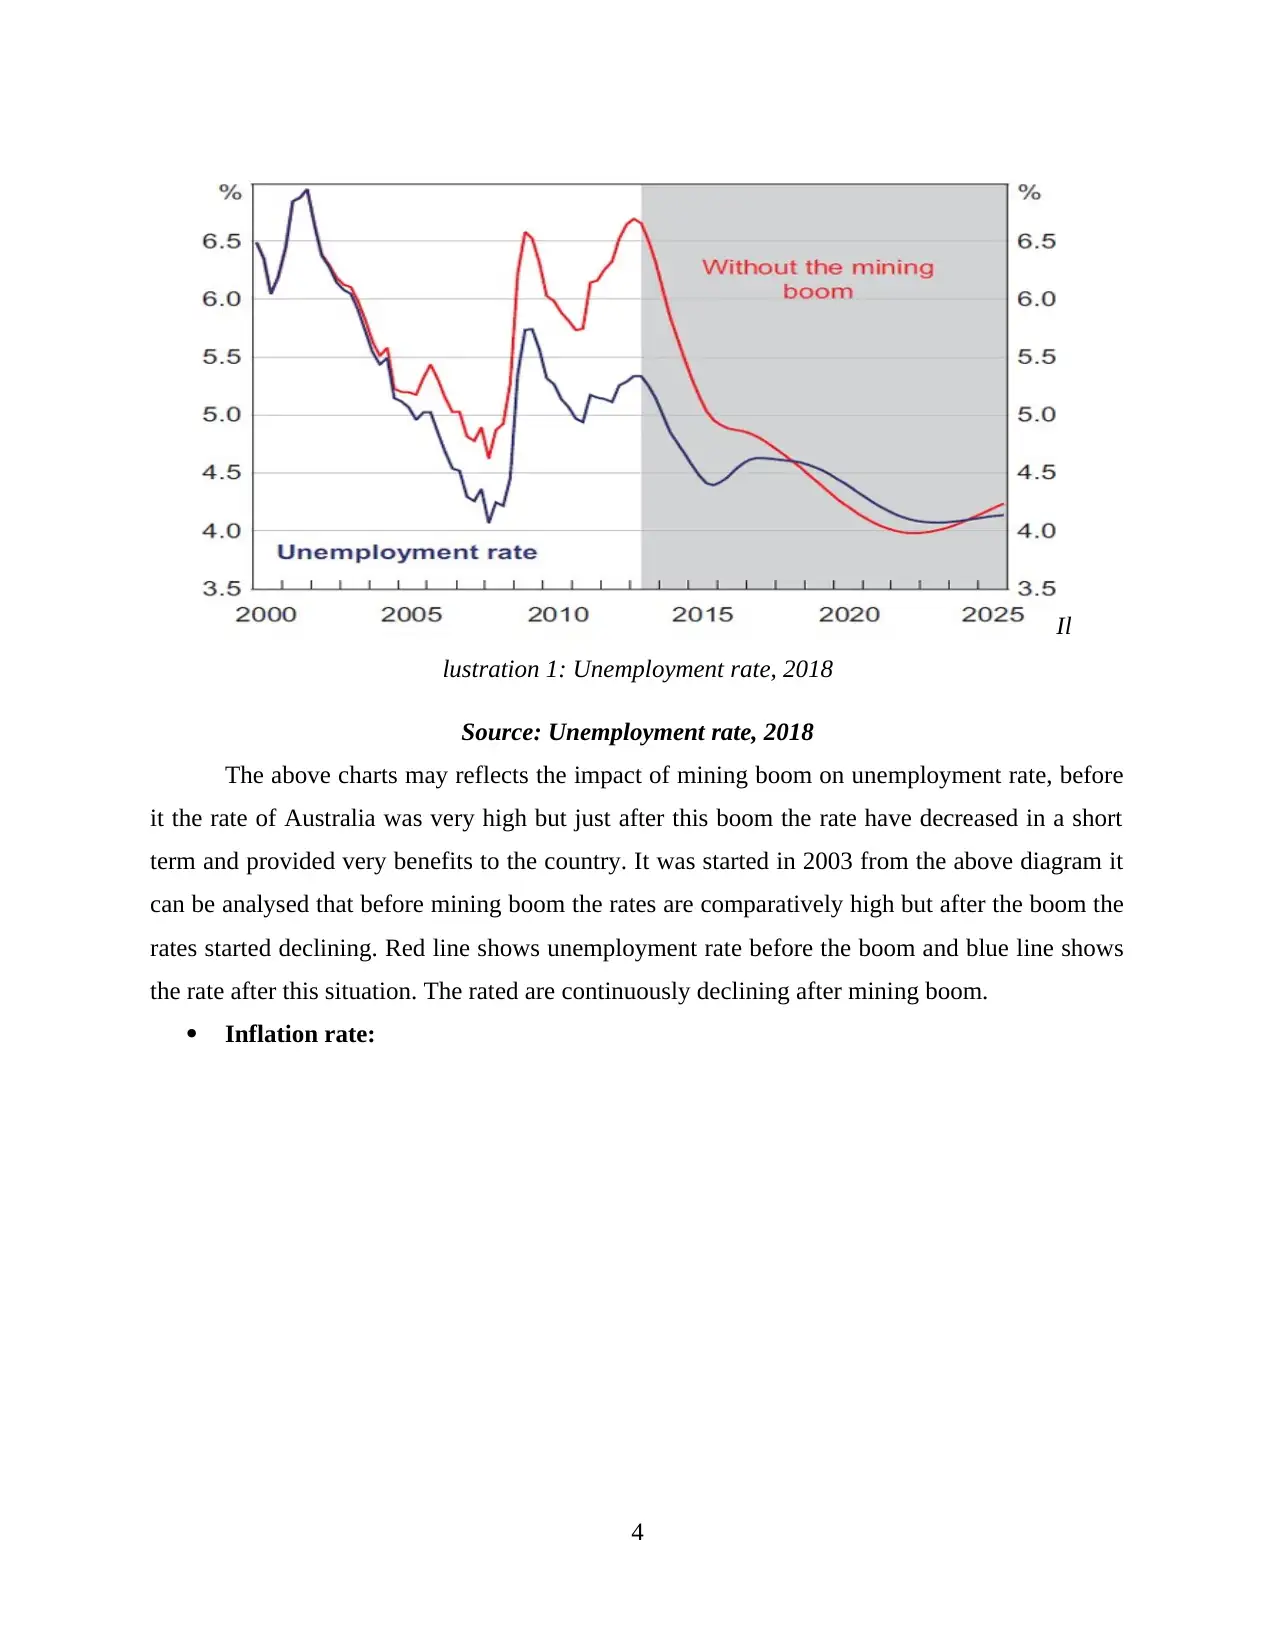
Source: Unemployment rate, 2018
The above charts may reflects the impact of mining boom on unemployment rate, before
it the rate of Australia was very high but just after this boom the rate have decreased in a short
term and provided very benefits to the country. It was started in 2003 from the above diagram it
can be analysed that before mining boom the rates are comparatively high but after the boom the
rates started declining. Red line shows unemployment rate before the boom and blue line shows
the rate after this situation. The rated are continuously declining after mining boom.
Inflation rate:
4
Il
lustration 1: Unemployment rate, 2018
⊘ This is a preview!⊘
Do you want full access?
Subscribe today to unlock all pages.
Trusted by 1+ million students worldwide
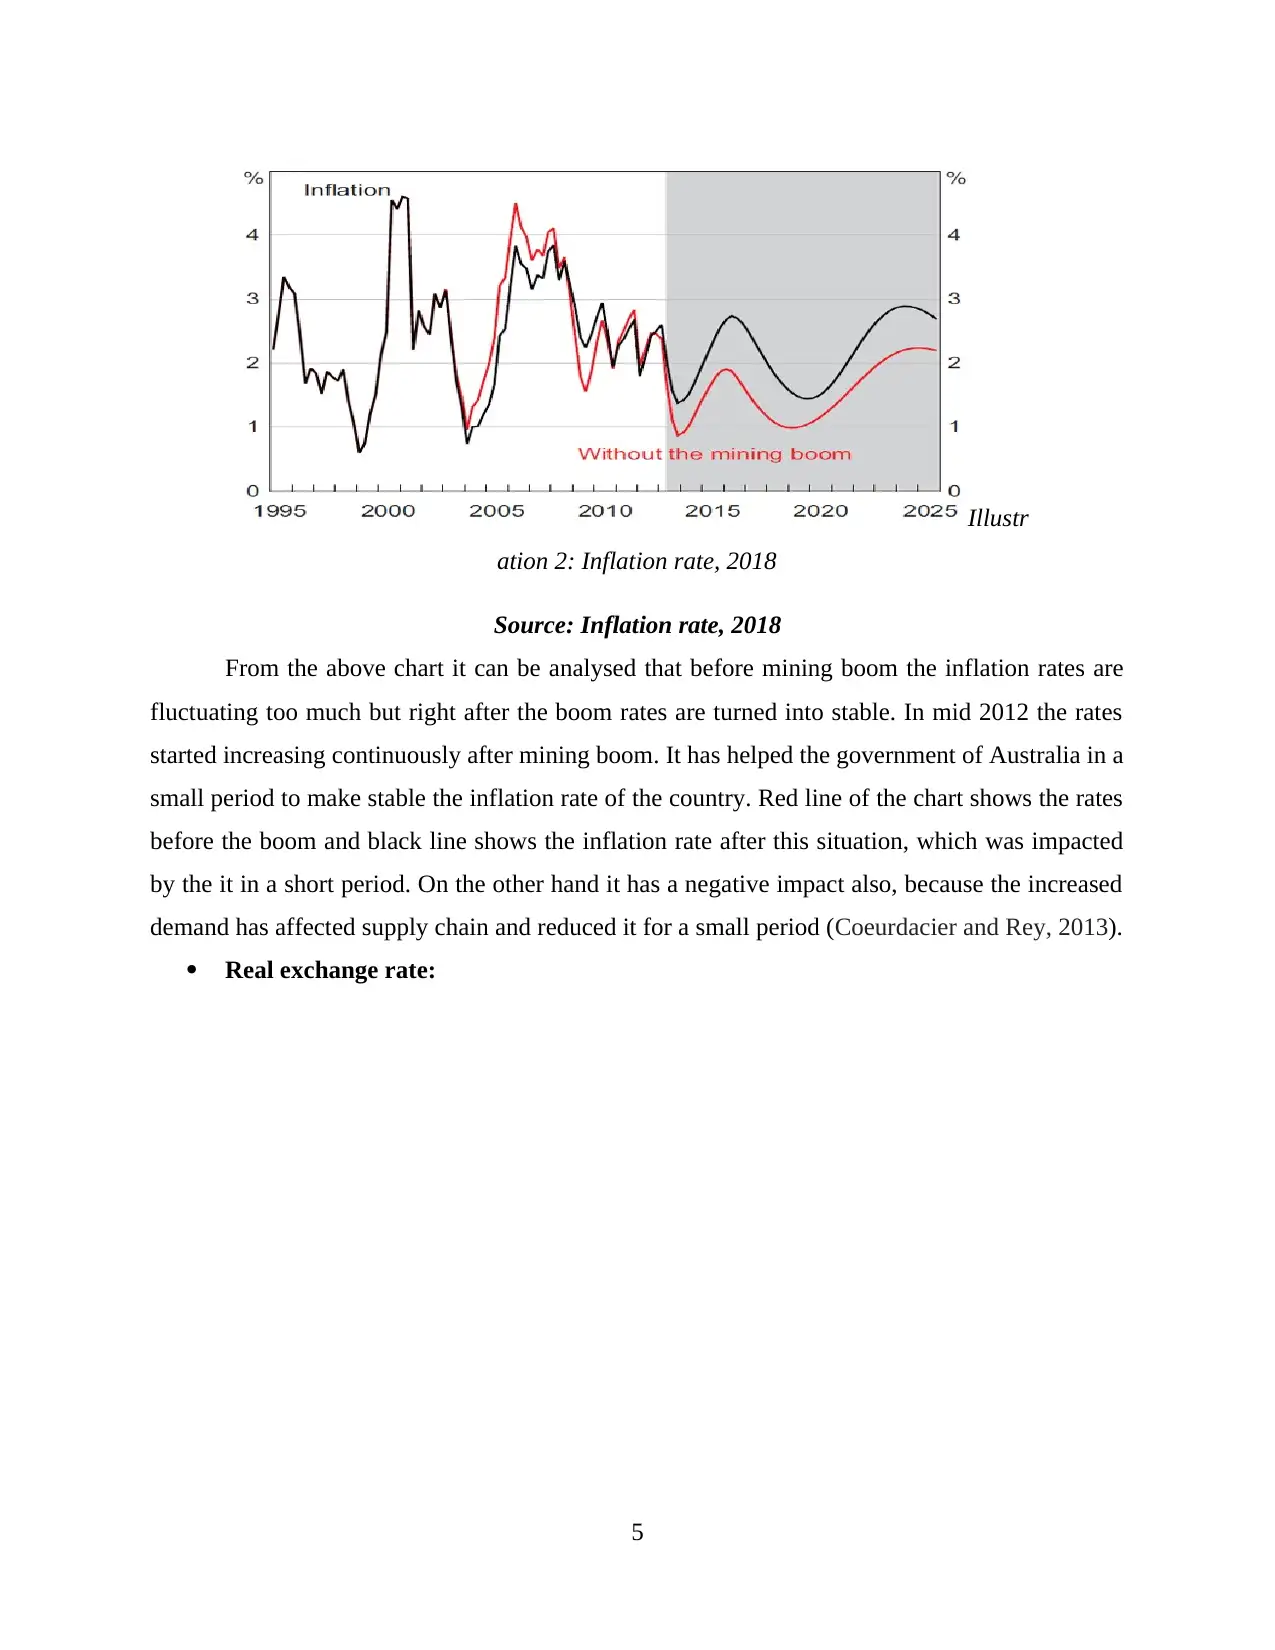
Source: Inflation rate, 2018
From the above chart it can be analysed that before mining boom the inflation rates are
fluctuating too much but right after the boom rates are turned into stable. In mid 2012 the rates
started increasing continuously after mining boom. It has helped the government of Australia in a
small period to make stable the inflation rate of the country. Red line of the chart shows the rates
before the boom and black line shows the inflation rate after this situation, which was impacted
by the it in a short period. On the other hand it has a negative impact also, because the increased
demand has affected supply chain and reduced it for a small period (Coeurdacier and Rey, 2013).
Real exchange rate:
5
Illustr
ation 2: Inflation rate, 2018
Paraphrase This Document
Need a fresh take? Get an instant paraphrase of this document with our AI Paraphraser
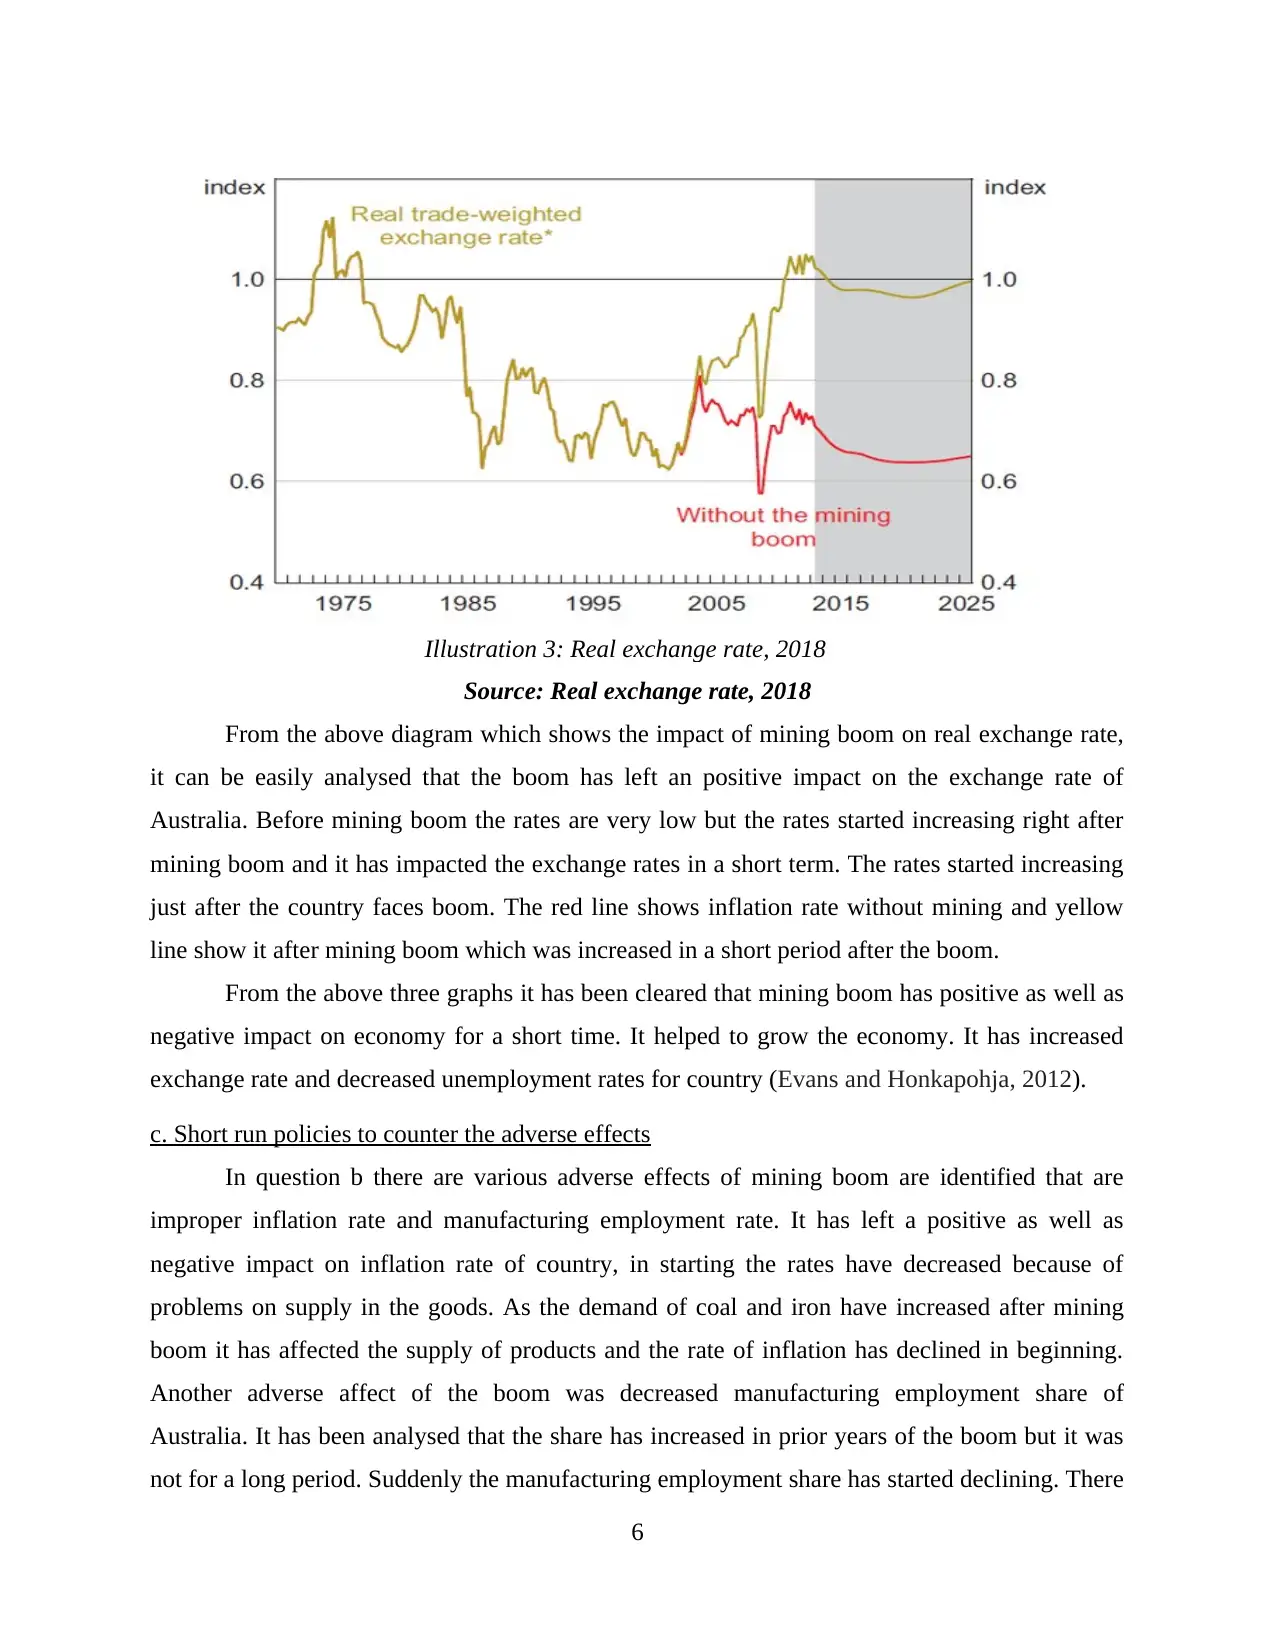
Source: Real exchange rate, 2018
From the above diagram which shows the impact of mining boom on real exchange rate,
it can be easily analysed that the boom has left an positive impact on the exchange rate of
Australia. Before mining boom the rates are very low but the rates started increasing right after
mining boom and it has impacted the exchange rates in a short term. The rates started increasing
just after the country faces boom. The red line shows inflation rate without mining and yellow
line show it after mining boom which was increased in a short period after the boom.
From the above three graphs it has been cleared that mining boom has positive as well as
negative impact on economy for a short time. It helped to grow the economy. It has increased
exchange rate and decreased unemployment rates for country (Evans and Honkapohja, 2012).
c. Short run policies to counter the adverse effects
In question b there are various adverse effects of mining boom are identified that are
improper inflation rate and manufacturing employment rate. It has left a positive as well as
negative impact on inflation rate of country, in starting the rates have decreased because of
problems on supply in the goods. As the demand of coal and iron have increased after mining
boom it has affected the supply of products and the rate of inflation has declined in beginning.
Another adverse affect of the boom was decreased manufacturing employment share of
Australia. It has been analysed that the share has increased in prior years of the boom but it was
not for a long period. Suddenly the manufacturing employment share has started declining. There
6
Illustration 3: Real exchange rate, 2018
is one more negative effect of the boom which has increased the import of iron and coal from
different Asian countries. The government of Australia was very concerned about these adverse
situations and to overcome the same, legal authorities have used two different policies. That are
as follows:
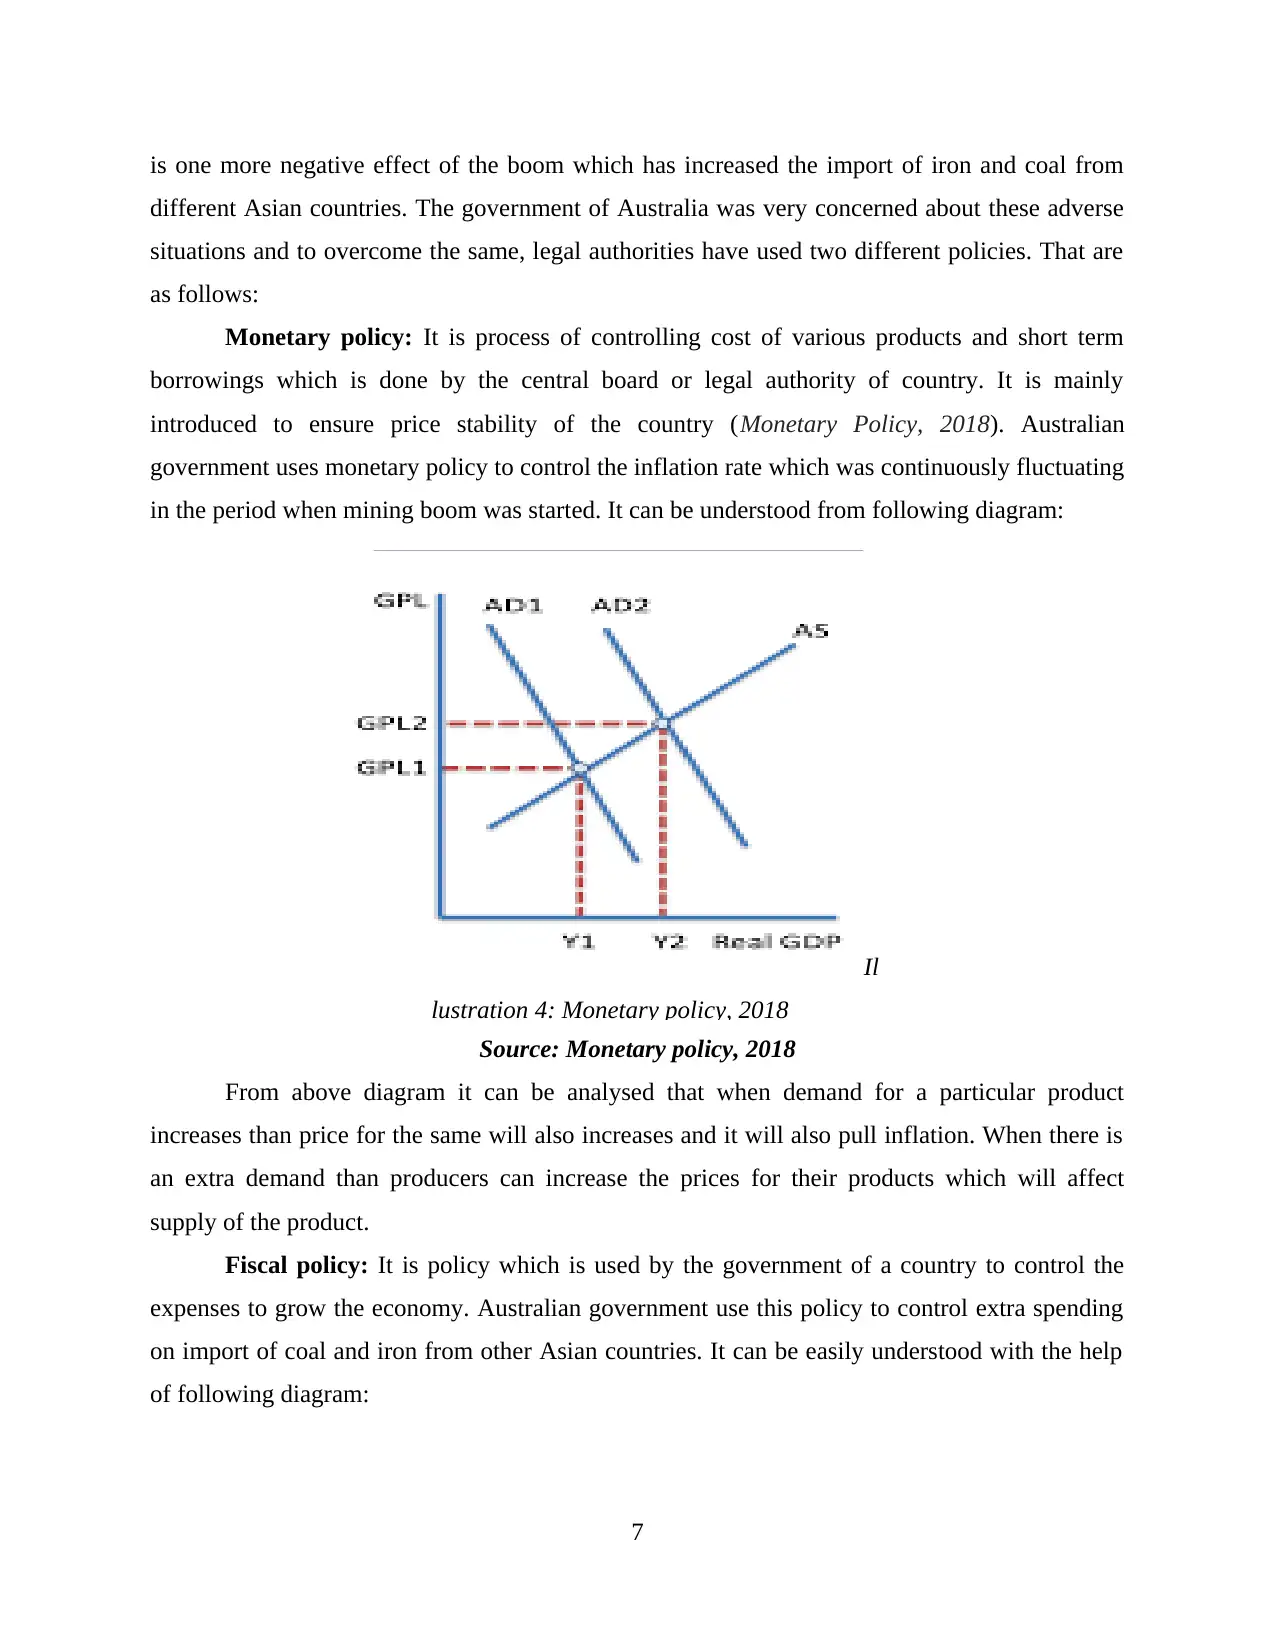
Monetary policy: It is process of controlling cost of various products and short term
borrowings which is done by the central board or legal authority of country. It is mainly
introduced to ensure price stability of the country (Monetary Policy, 2018). Australian
government uses monetary policy to control the inflation rate which was continuously fluctuating
in the period when mining boom was started. It can be understood from following diagram:
Il
lustration 4: Monetary policy, 2018
Source: Monetary policy, 2018
From above diagram it can be analysed that when demand for a particular product
increases than price for the same will also increases and it will also pull inflation. When there is
an extra demand than producers can increase the prices for their products which will affect
supply of the product.
Fiscal policy: It is policy which is used by the government of a country to control the
expenses to grow the economy. Australian government use this policy to control extra spending
on import of coal and iron from other Asian countries. It can be easily understood with the help
of following diagram:
7
different Asian countries. The government of Australia was very concerned about these adverse
situations and to overcome the same, legal authorities have used two different policies. That are
as follows:
Monetary policy: It is process of controlling cost of various products and short term
borrowings which is done by the central board or legal authority of country. It is mainly
introduced to ensure price stability of the country (Monetary Policy, 2018). Australian
government uses monetary policy to control the inflation rate which was continuously fluctuating
in the period when mining boom was started. It can be understood from following diagram:
Il
lustration 4: Monetary policy, 2018
Source: Monetary policy, 2018
From above diagram it can be analysed that when demand for a particular product
increases than price for the same will also increases and it will also pull inflation. When there is
an extra demand than producers can increase the prices for their products which will affect
supply of the product.
Fiscal policy: It is policy which is used by the government of a country to control the
expenses to grow the economy. Australian government use this policy to control extra spending
on import of coal and iron from other Asian countries. It can be easily understood with the help
of following diagram:
7
⊘ This is a preview!⊘
Do you want full access?
Subscribe today to unlock all pages.
Trusted by 1+ million students worldwide
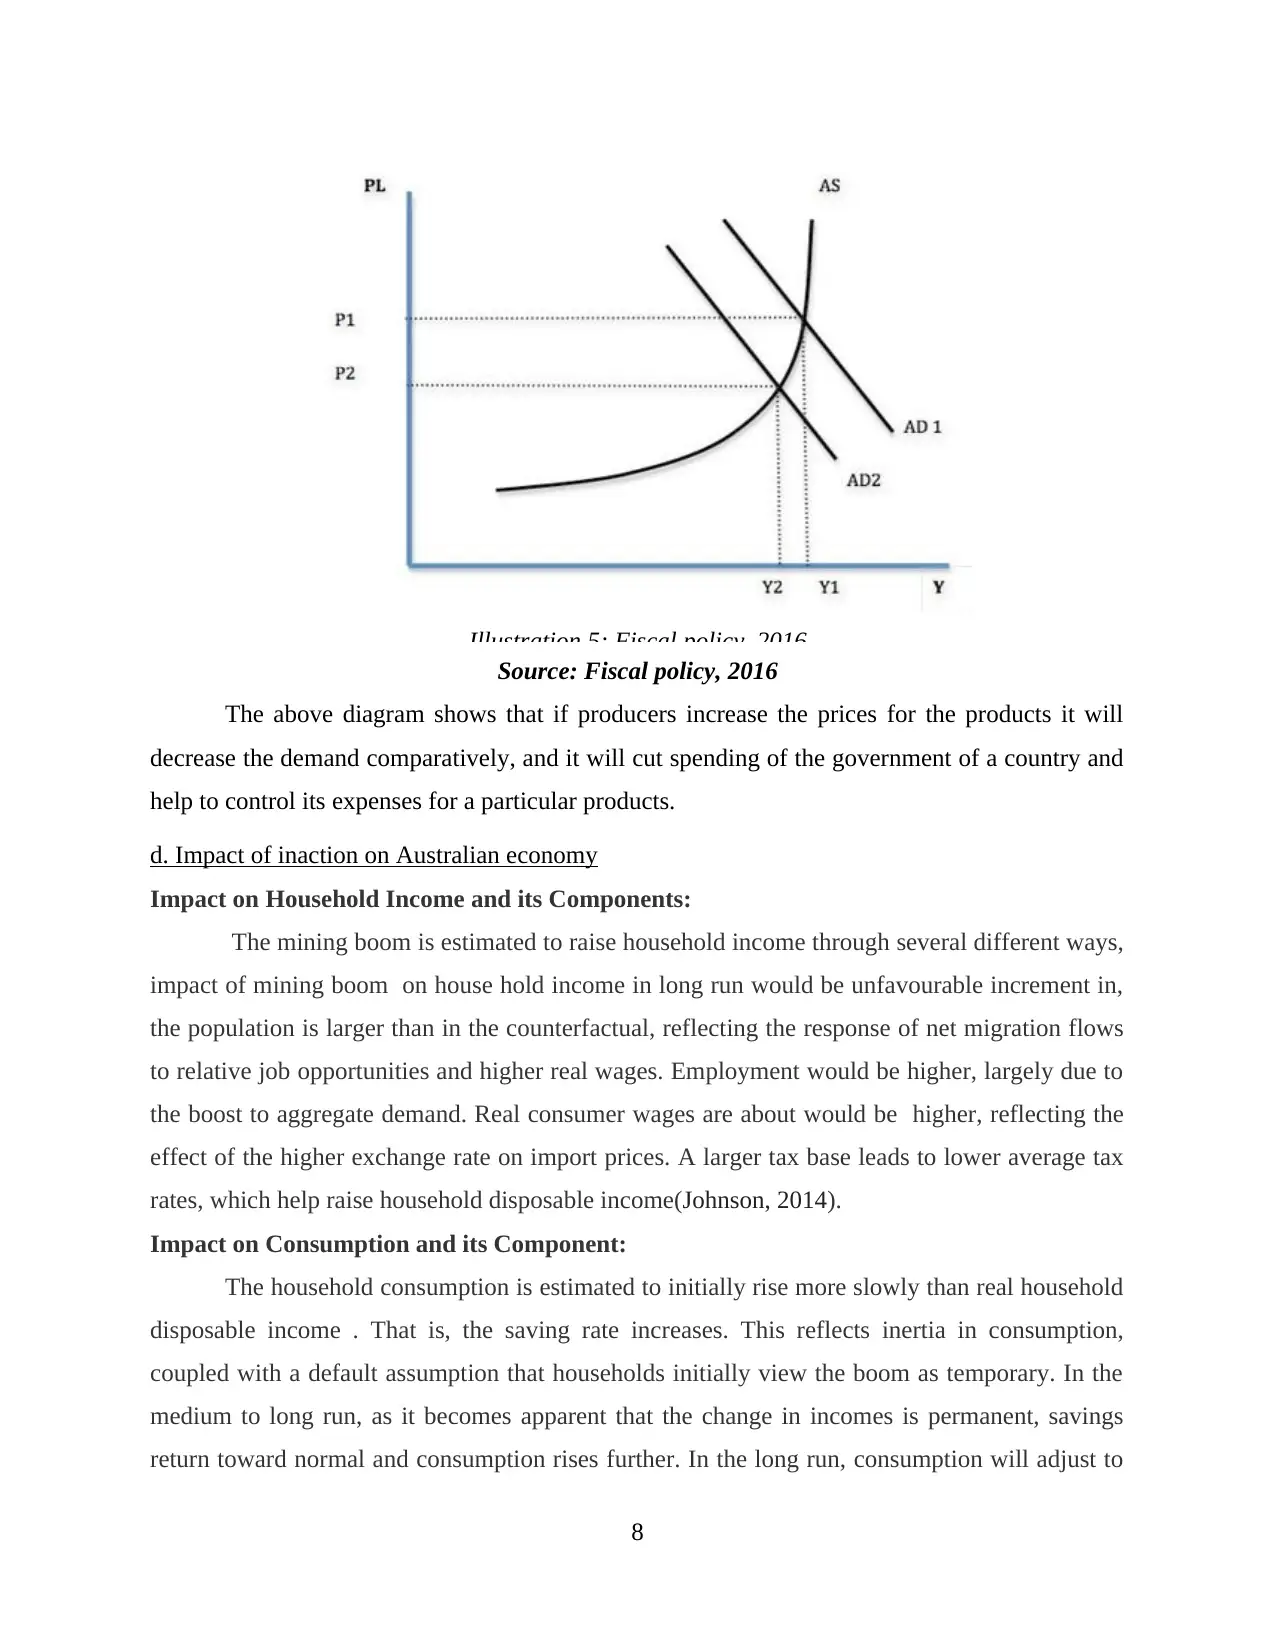
Illustration 5: Fiscal policy, 2016
Source: Fiscal policy, 2016
The above diagram shows that if producers increase the prices for the products it will
decrease the demand comparatively, and it will cut spending of the government of a country and
help to control its expenses for a particular products.
d. Impact of inaction on Australian economy
Impact on Household Income and its Components:
The mining boom is estimated to raise household income through several different ways,
impact of mining boom on house hold income in long run would be unfavourable increment in,
the population is larger than in the counterfactual, reflecting the response of net migration flows
to relative job opportunities and higher real wages. Employment would be higher, largely due to
the boost to aggregate demand. Real consumer wages are about would be higher, reflecting the
effect of the higher exchange rate on import prices. A larger tax base leads to lower average tax
rates, which help raise household disposable income(Johnson, 2014).
Impact on Consumption and its Component:
The household consumption is estimated to initially rise more slowly than real household
disposable income . That is, the saving rate increases. This reflects inertia in consumption,
coupled with a default assumption that households initially view the boom as temporary. In the
medium to long run, as it becomes apparent that the change in incomes is permanent, savings
return toward normal and consumption rises further. In the long run, consumption will adjust to
8
Paraphrase This Document
Need a fresh take? Get an instant paraphrase of this document with our AI Paraphraser
be consistent with the rise in household disposable income, which, Changes in the composition
of consumption are an important determinant of how the mining boom affects different
industries. These compositional changes, in turn, reflect how households react to relative price
movements and changing income. estimated changes in prices. The higher exchange rate drives
the prices of imported goods like motor vehicles and durables lower but has relatively little effect
on the prices of most goods and services produced domestically (Mankiw, 2014).
Impact on Export volumes:
For commodity exports (agriculture and mining), goods are reasonably homogeneous and
that producers are price takers on the world market. Supply is price-inelastic in the short run but
responds with a lag to ‘internal competitiveness’ (the world price expressed in A$ relative to
local costs), and hence profitability, which induces investment. For agricultural exports, prices
are reduced by the exchange rate appreciation, an effect that is partially offset by the assumed
increase in world demand, the latter effect being relatively small. With lower profitability and
investment, supply decreases and exports are lower after a decade. Moreover, decrease in level
of export and GDP leads to massive growth in level of import.
9
REFERENCES
Books and Journals:
Agénor, P. R. and Montiel, P. J., 2015. Development macroeconomics. Princeton University
Press.
Borio, C., 2014. The financial cycle and macroeconomics: What have we learnt?. Journal of
Banking & Finance. 45. pp.182-198.
Brunnermeier, M. K., Eisenbach, T. M. and Sannikov, Y., 2012. Macroeconomics with financial
frictions: A survey (No. w18102). National Bureau of Economic Research.
Burda, M. and Wyplosz, C., 2013. Macroeconomics: a European text. Oxford university press.
Coeurdacier, N. and Rey, H., 2013. Home bias in open economy financial macroeconomics.
Journal of Economic Literature. 51(1). pp.63-115.
Evans, G. W. and Honkapohja, S., 2012. Learning and expectations in macroeconomics.
Princeton University Press.
Johnson, R. C., 2014. Five facts about value-added exports and implications for macroeconomics
and trade research. Journal of Economic Perspectives. 28(2). pp.119-42.
Mankiw, N. G., 2014. Principles of macroeconomics. Cengage Learning.
Online
Monetary Policy. 2018. [Online]. Available through:
<https://www.livemint.com/Companies/iHFotgxKoxEwnTBApB3Z8L/What-is-RBIs-
monetary-policy-review-An-explainer.html>
10
⊘ This is a preview!⊘
Do you want full access?
Subscribe today to unlock all pages.
Trusted by 1+ million students worldwide
1 out of 12
Related Documents


Your All-in-One AI-Powered Toolkit for Academic Success.
+13062052269
info@desklib.com
Available 24*7 on WhatsApp / Email
![[object Object]](/_next/static/media/star-bottom.7253800d.svg)
Unlock your academic potential
Copyright © 2020–2026 A2Z Services. All Rights Reserved. Developed and managed by ZUCOL.