Macroeconomics: Business Cycles, Economic Trends, and Australia

Verified

Added on  2023/06/10

|6
|906
|344
Report
AI Summary
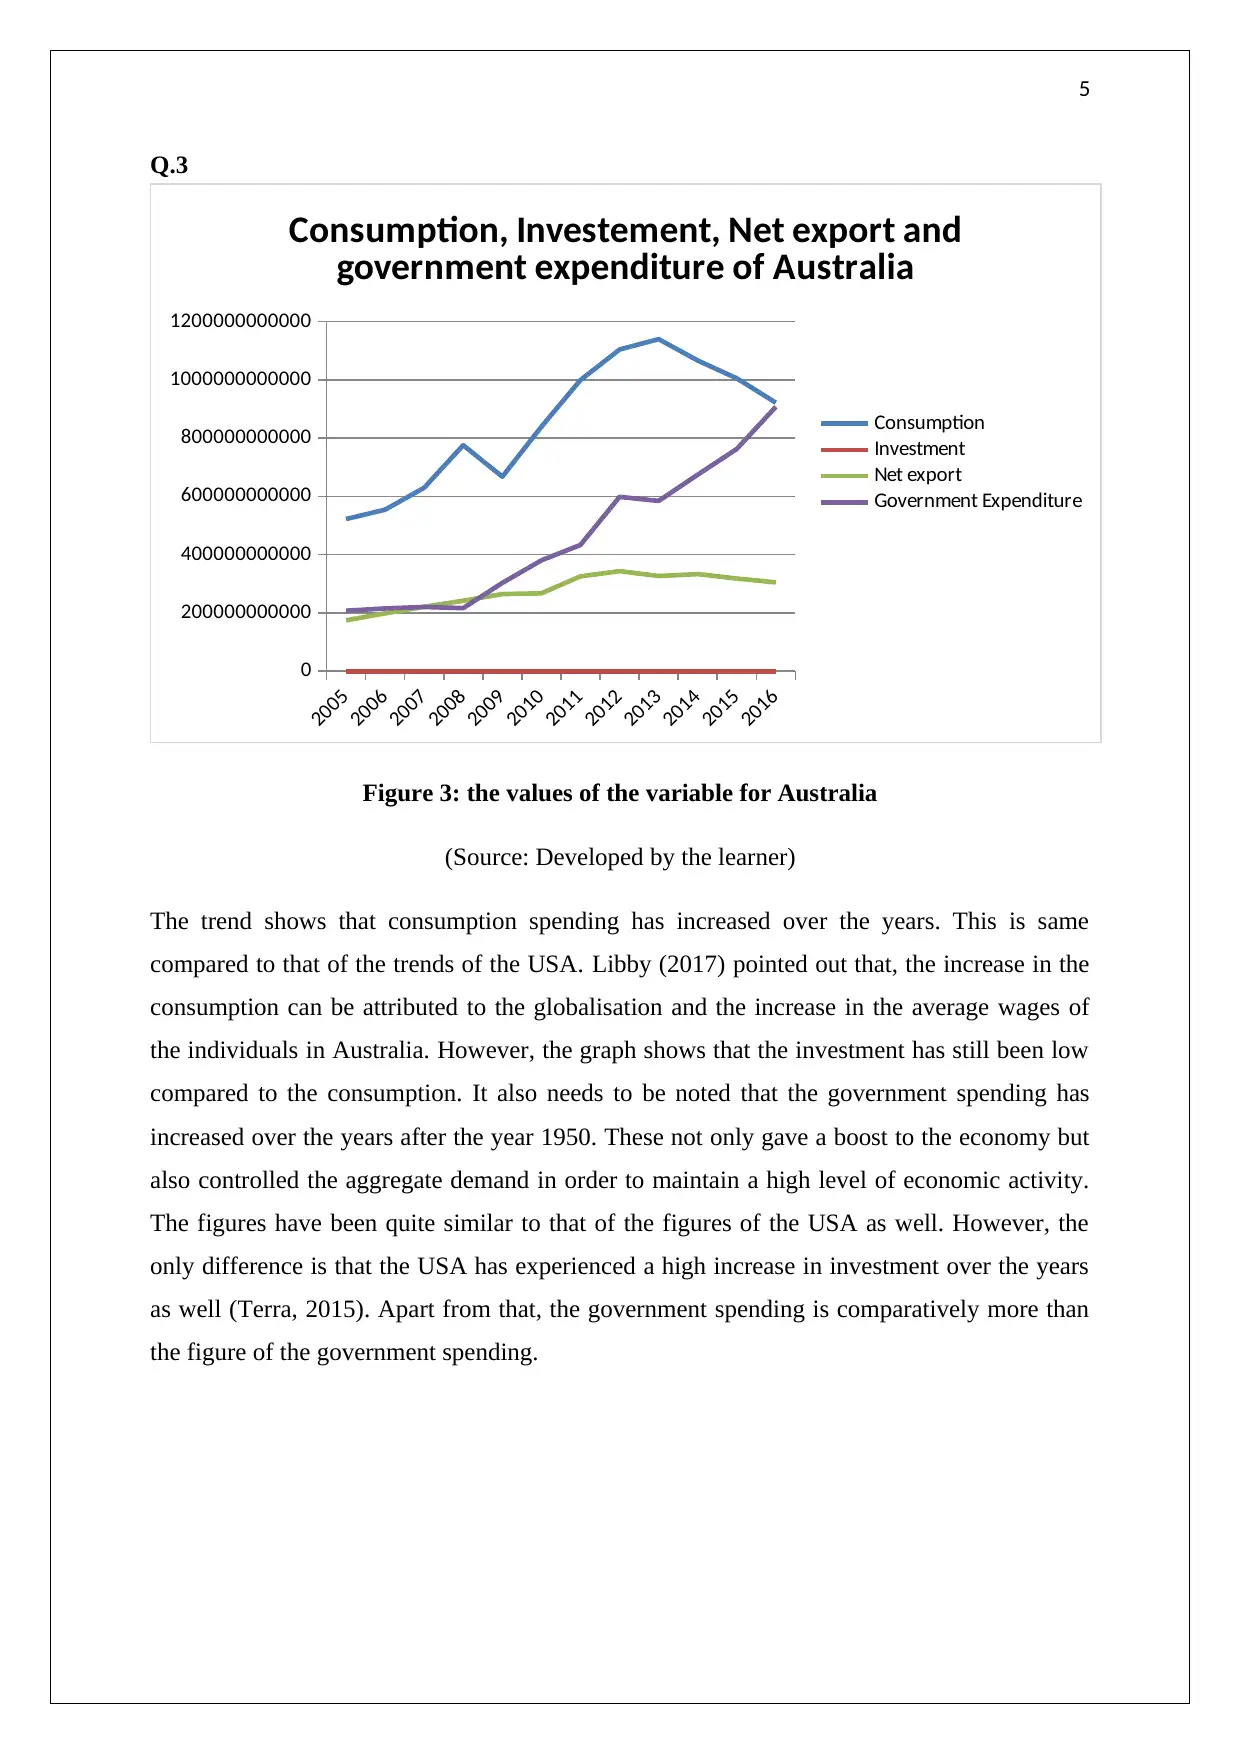
This report provides an analysis of macroeconomic trends, focusing on business cycles and their impact, particularly in Australia. It examines the length of peaks and troughs in business cycles, highlighting differences between pre- and post-World War periods. The report analyzes percentage changes in key economic variables, noting the increasing trends in exports and the role of consumption in recessions. It also assesses the impact of government spending on economic recovery. Furthermore, the report investigates consumption, investment, net exports, and government expenditure in Australia, comparing trends with those in the USA. The analysis attributes consumption increases to globalization and wage growth, while noting comparatively lower investment levels in Australia. Desklib provides this and many other solved assignments for students.
Document Page
1
MACROECONOMICS
tabler-icon-diamond-filled.svg

Paraphrase This Document

Need a fresh take? Get an instant paraphrase of this document with our AI Paraphraser
Document Page
2
Table of contents
Q 1..............................................................................................................................................3
Q.2..............................................................................................................................................4
Q.3..............................................................................................................................................5
Reference....................................................................................................................................6
Document Page
3
Q 1
June 1857(II)
April 1865(I)
October 1873(III)
March 1887(II)
January 1893(I)
June 1899(III)
May 1907(II)
January 1913(I)
January 1920(I)
October 1926(III)
May 1937(II)
November 1948(IV)
August 1957(III)
December 1969(IV)
January 1980(I)
July 1990(III)
0
20
40
60
80
100
120
140
Length of the peaks and trough
Contraction Peak to Trough --
Expansion Previous trough to
this peak --
Figure 1: The length of the peaks and the trough
(Source: Developed by the learner)
The blue bars of the diagram shows the length of the contraction and the red bars depicts the
length of the expansions of the business cycle. As per the, there has been a difference
between the pre and post world war period. The gap between the length of expansion and
contraction phase of the business cycle in pre-world war situation was minimum (Boyle, &
Goffe,2018). However, after the world war was over the length of expansion phase is more
than that of the contraction. The current expansion that started in June 2009 has a long
expansion length compared to the previous contraction length. This is following the trends of
the post world war era. However, compared to the pre-world war era, the length of the
contraction phase of the business cycle is smaller than the expansion in the newest business
cycle expansion as well.
Document Page
4
Q.2
Figure 2: The percentage change graph of the selected variable
(Source: Developed by the learner)
The main trend that can be seen from the graph is that the value of all the selected variable is
increasing over the years. It can also be noted that the increase in the value of some of the
variables has also been exponentially in nature. For example, the exports of goods and
services have increased exponentially since the year 1950.
The consumption sector is the primary cause of the recession as the lack of demand for the
goods and services resulted in an excess supply of goods in the economy. According to the
graph, the real consumption over the years has been very low compared to the values of the
other variables (Chiang, 2016). The sector of government spending worked as the driver to
bring the economy out of the great depression. The above graph depicts that, government
spending has increased over the years as the economy started to grow.
tabler-icon-diamond-filled.svg

Paraphrase This Document

Need a fresh take? Get an instant paraphrase of this document with our AI Paraphraser
Document Page
5
Q.3
2005
2006
2007
2008
2009
2010
2011
2012
2013
2014
2015
2016
0
200000000000
400000000000
600000000000
800000000000
1000000000000
1200000000000
Consumption, Investement, Net export and
government expenditure of Australia
Consumption
Investment
Net export
Government Expenditure
Figure 3: the values of the variable for Australia
(Source: Developed by the learner)
The trend shows that consumption spending has increased over the years. This is same
compared to that of the trends of the USA. Libby (2017) pointed out that, the increase in the
consumption can be attributed to the globalisation and the increase in the average wages of
the individuals in Australia. However, the graph shows that the investment has still been low
compared to the consumption. It also needs to be noted that the government spending has
increased over the years after the year 1950. These not only gave a boost to the economy but
also controlled the aggregate demand in order to maintain a high level of economic activity.
The figures have been quite similar to that of the figures of the USA as well. However, the
only difference is that the USA has experienced a high increase in investment over the years
as well (Terra, 2015). Apart from that, the government spending is comparatively more than
the figure of the government spending.
Document Page
6
Reference
Boyle, A., & Goffe, W. L. (2018). Beyond the Flipped Class: The Impact of Research-Based
Teaching Methods in a Macroeconomics Principles Class. In AEA Papers and
Proceedings (Vol. 108, pp. 297-301)
Chiang, E. P. (2016). Macroeconomics: Principles for a Changing World. Worth Pub.
Libby, J. D. (2017). Principles of Macroeconomics.
Terra, C. (2015). Principles of International Finance and Open Economy Macroeconomics:
Theories, Applications, and Policies. Academic Press.
chevron_up_icon
1 out of 6
circle_padding
hide_on_mobile
zoom_out_icon
[object Object]