Macroeconomics Assignment: Economic Equilibrium, Policies, and Impacts

Verified

Added on  2022/10/01

|14
|1088
|18
Homework Assignment
AI Summary
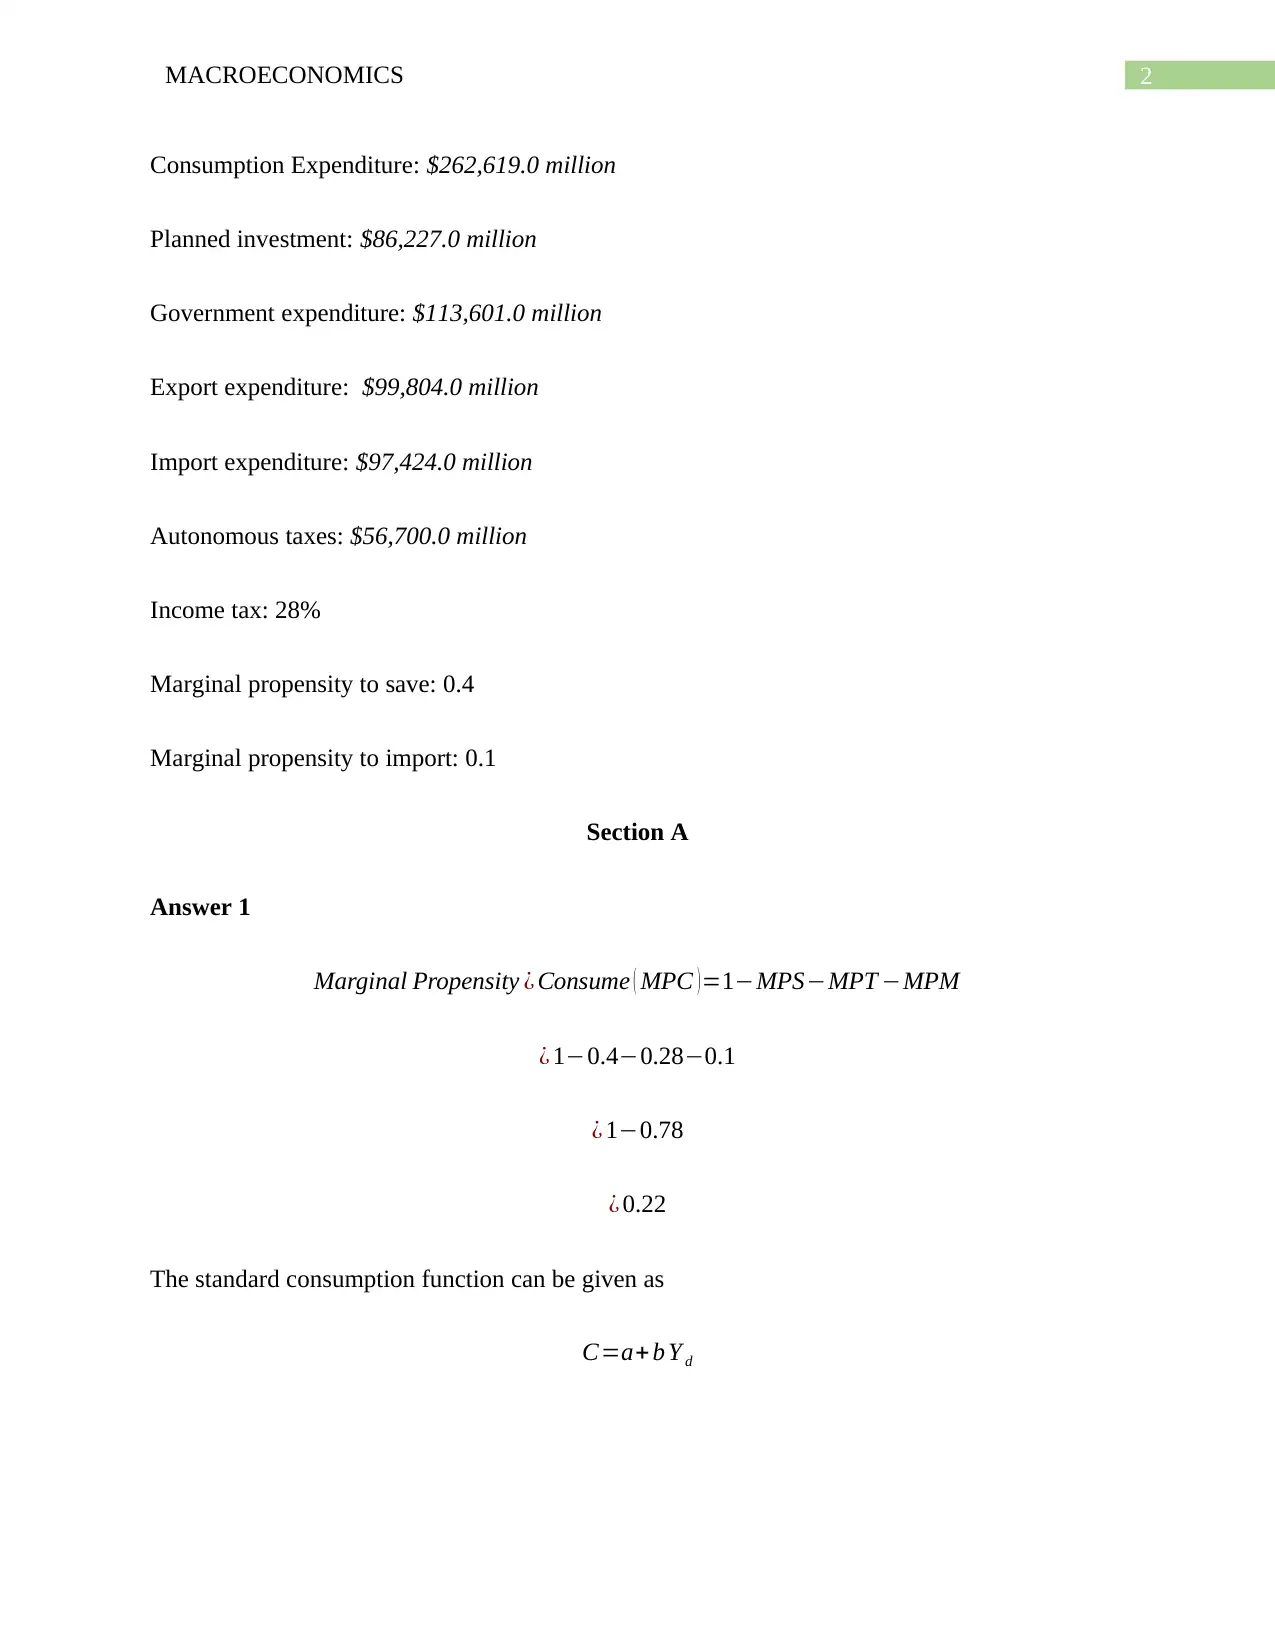
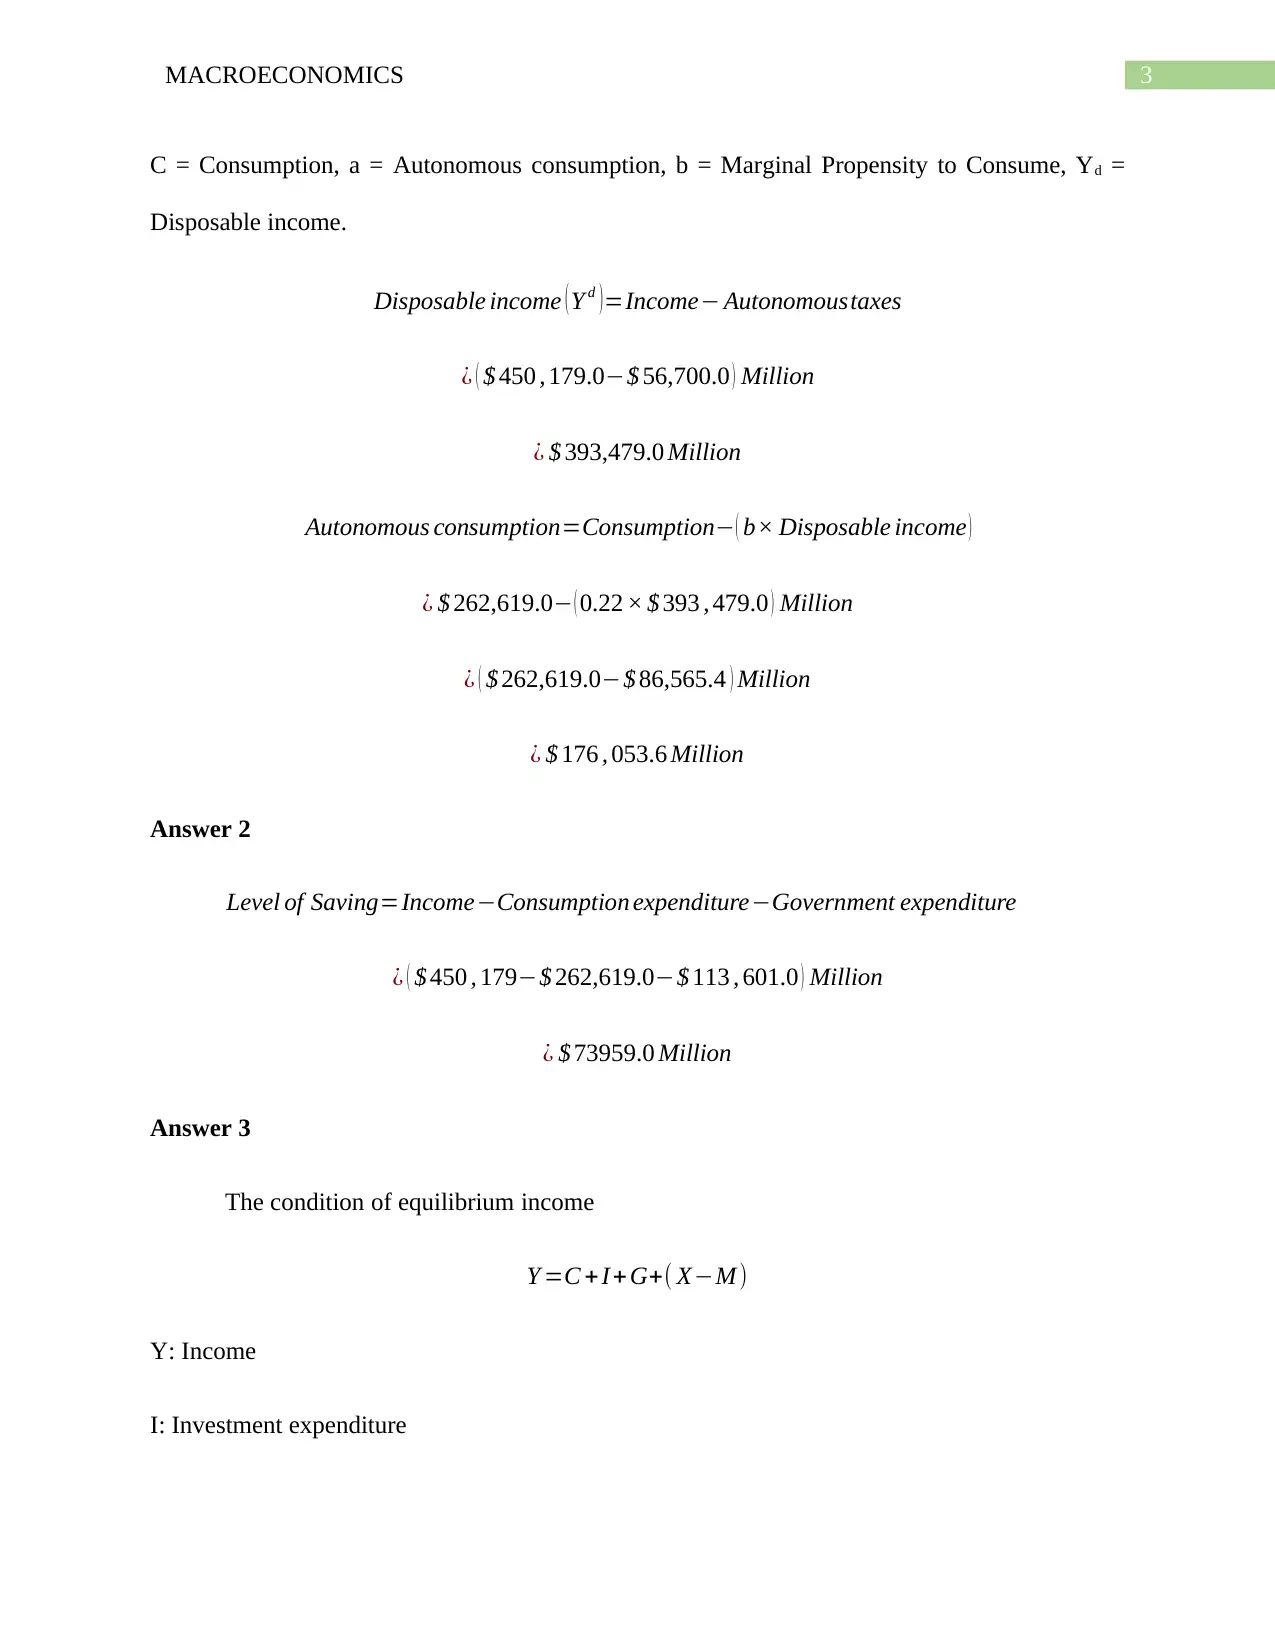
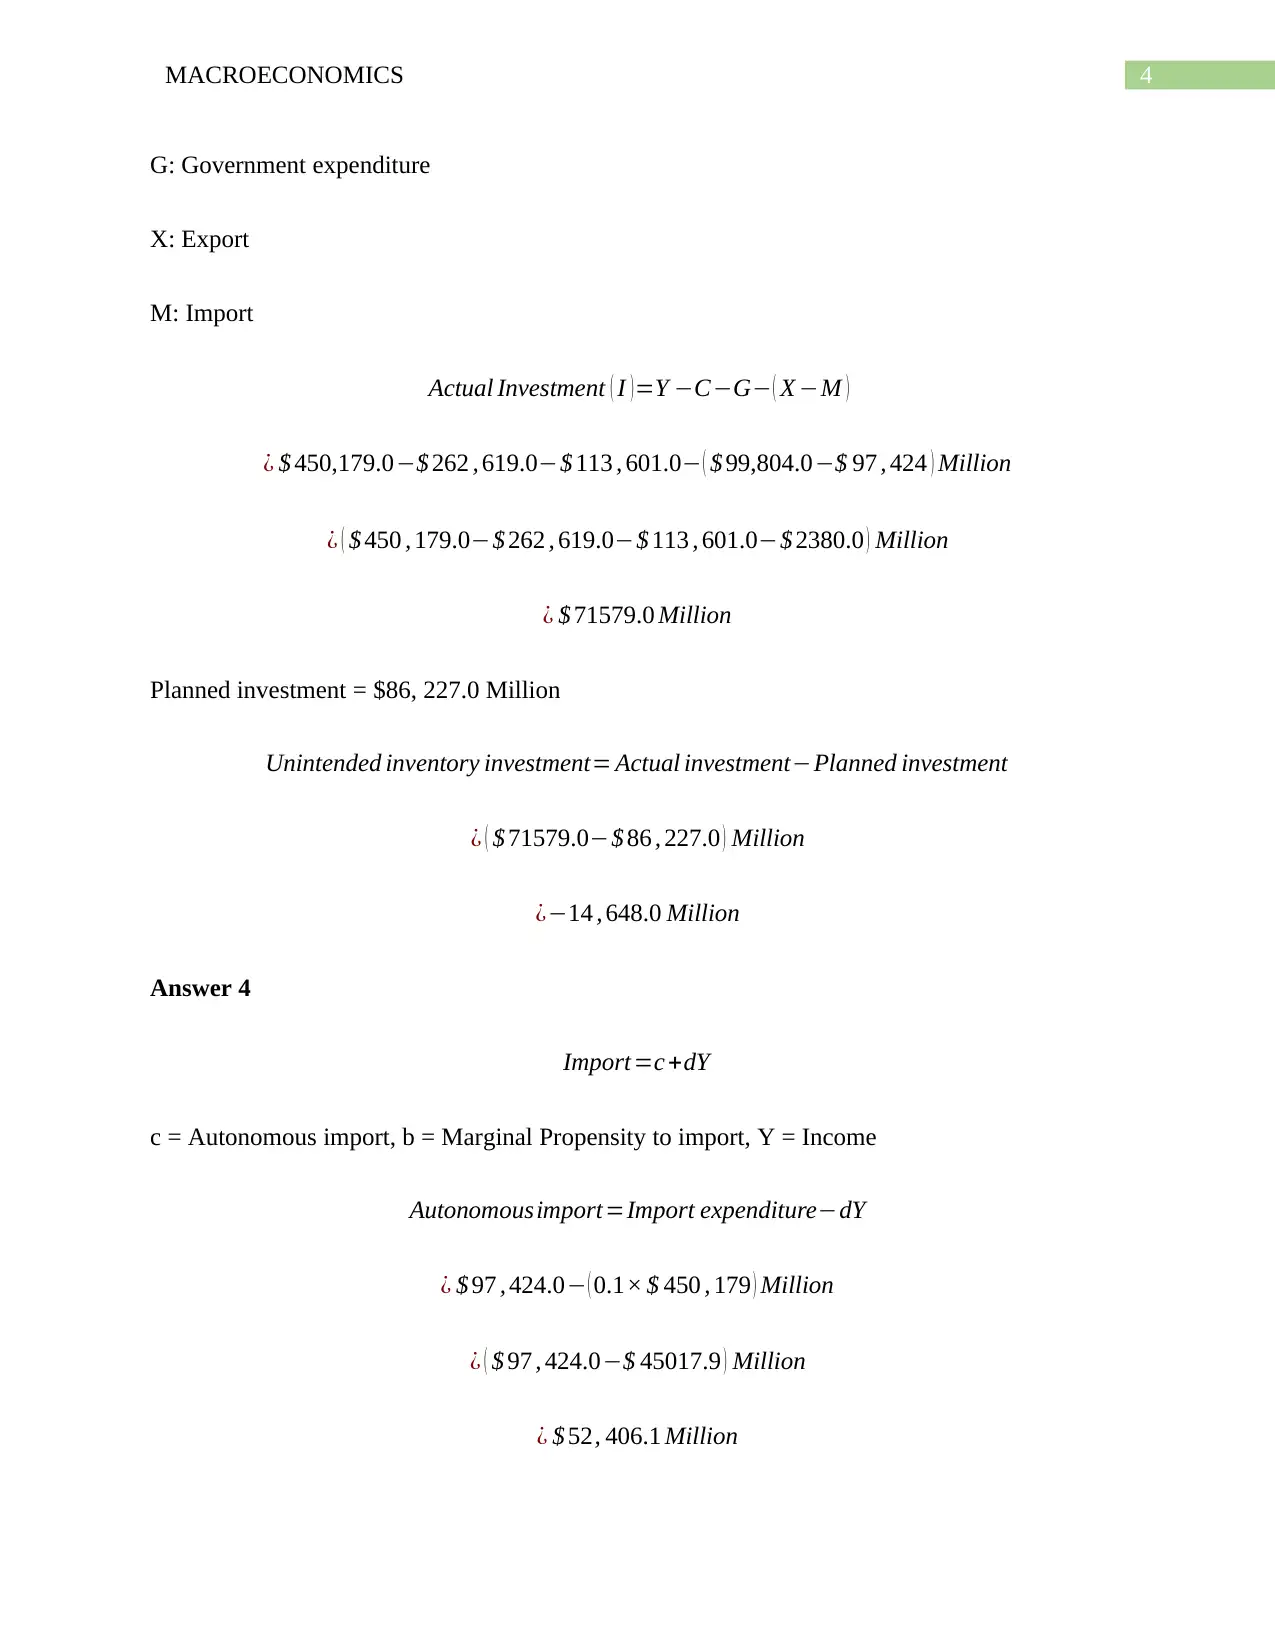
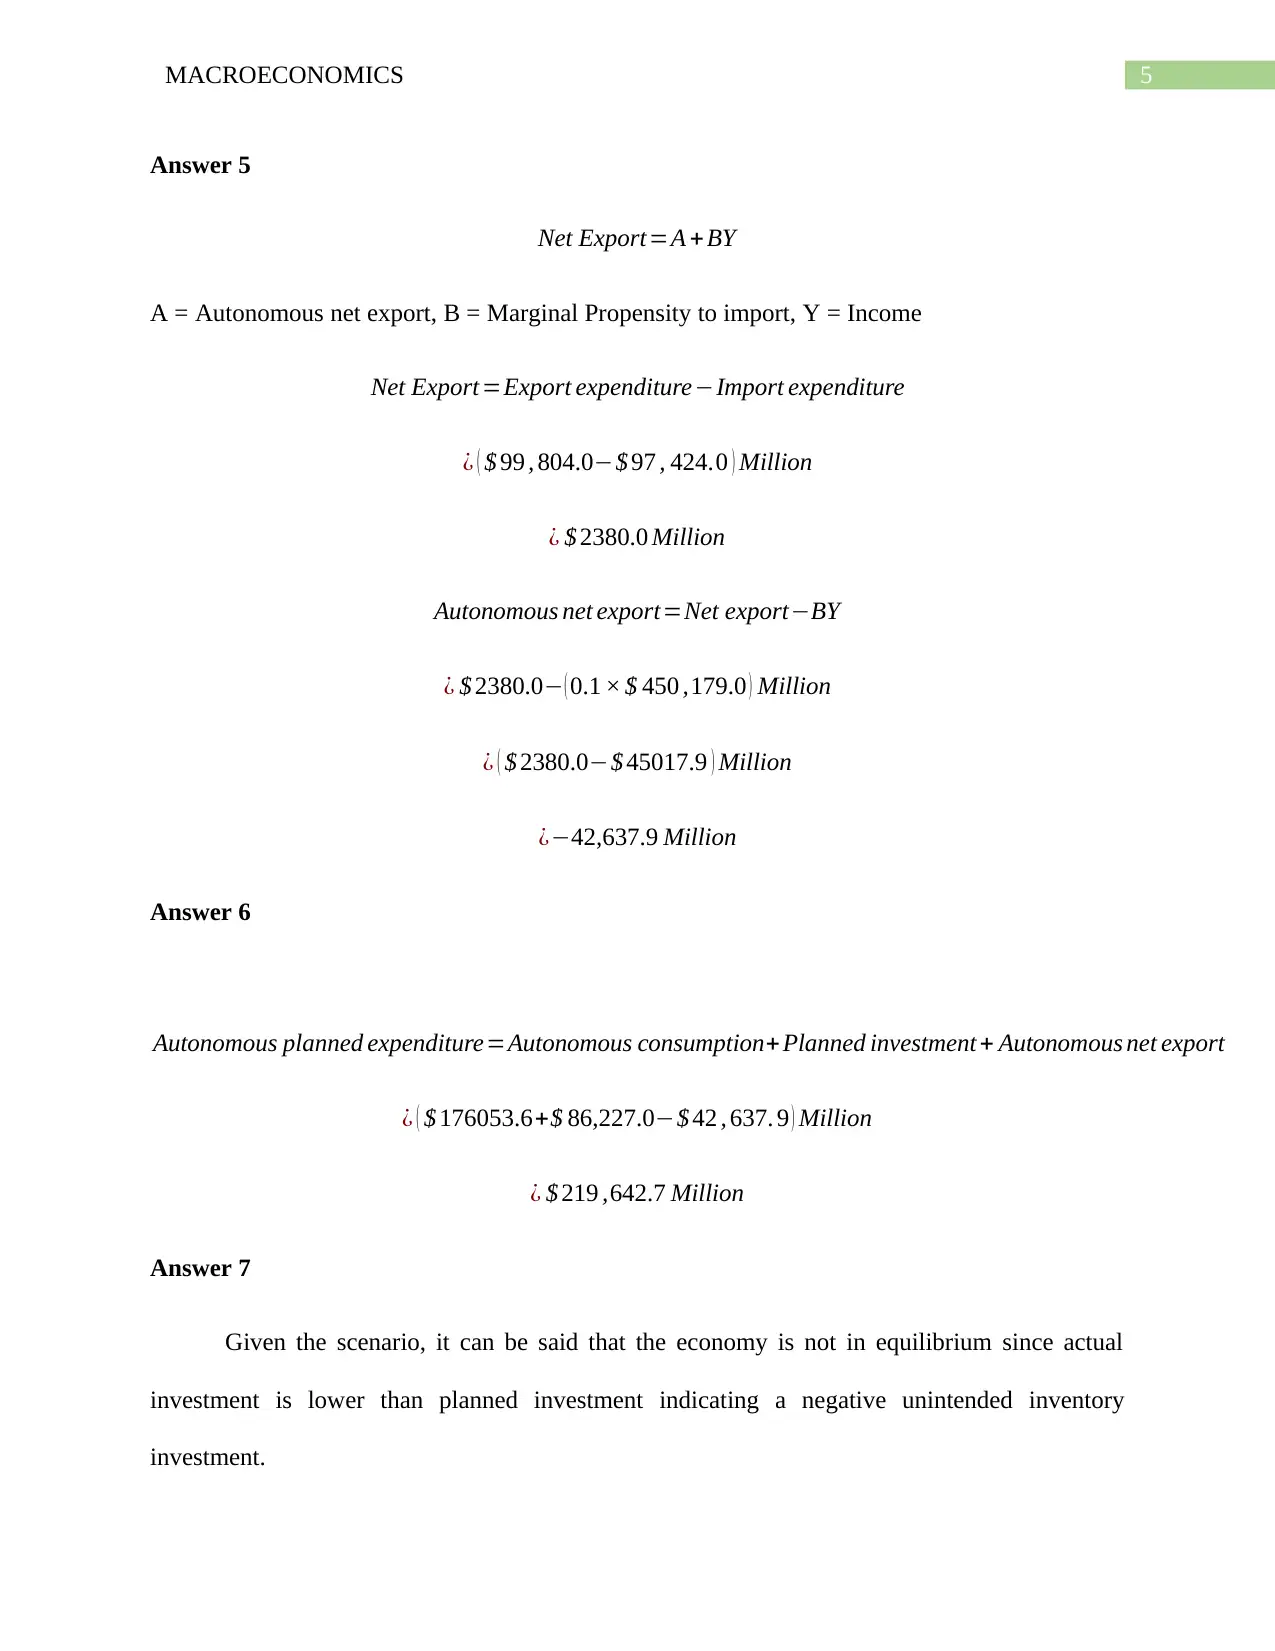
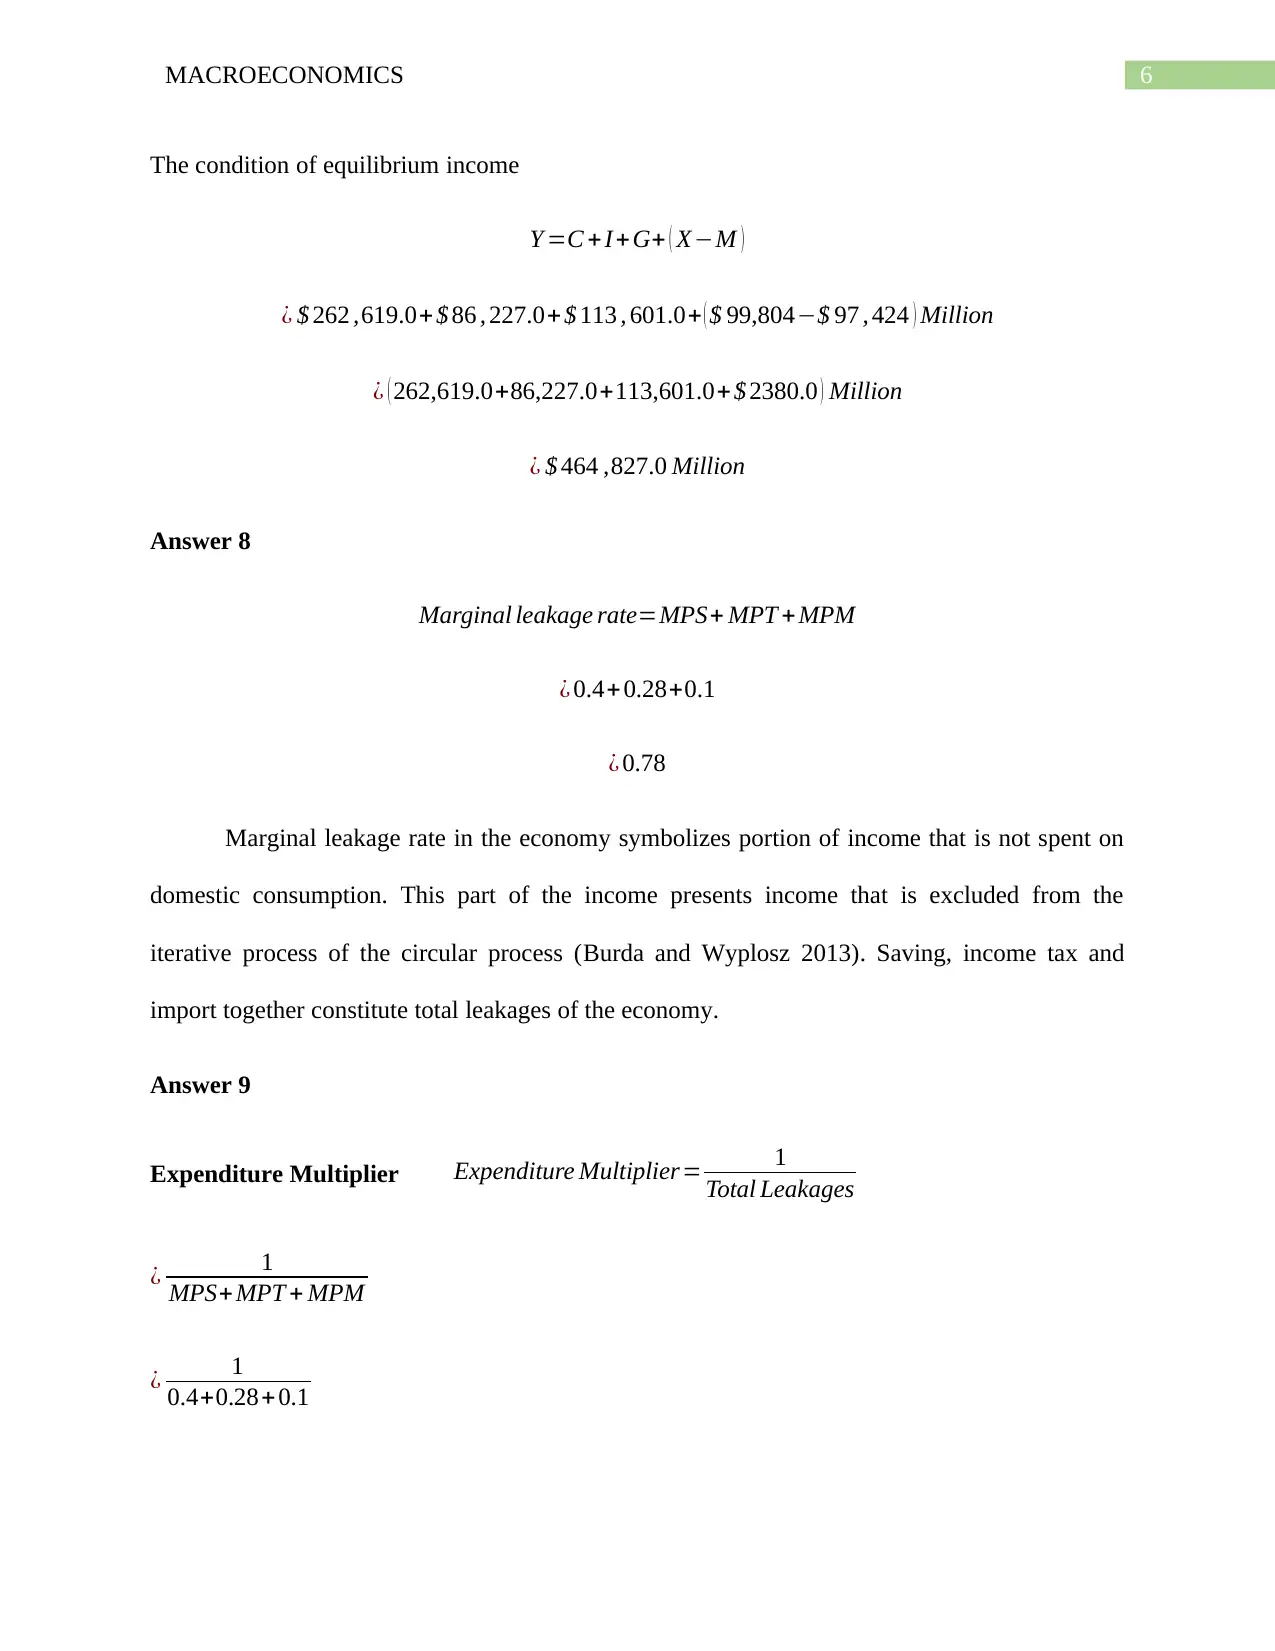
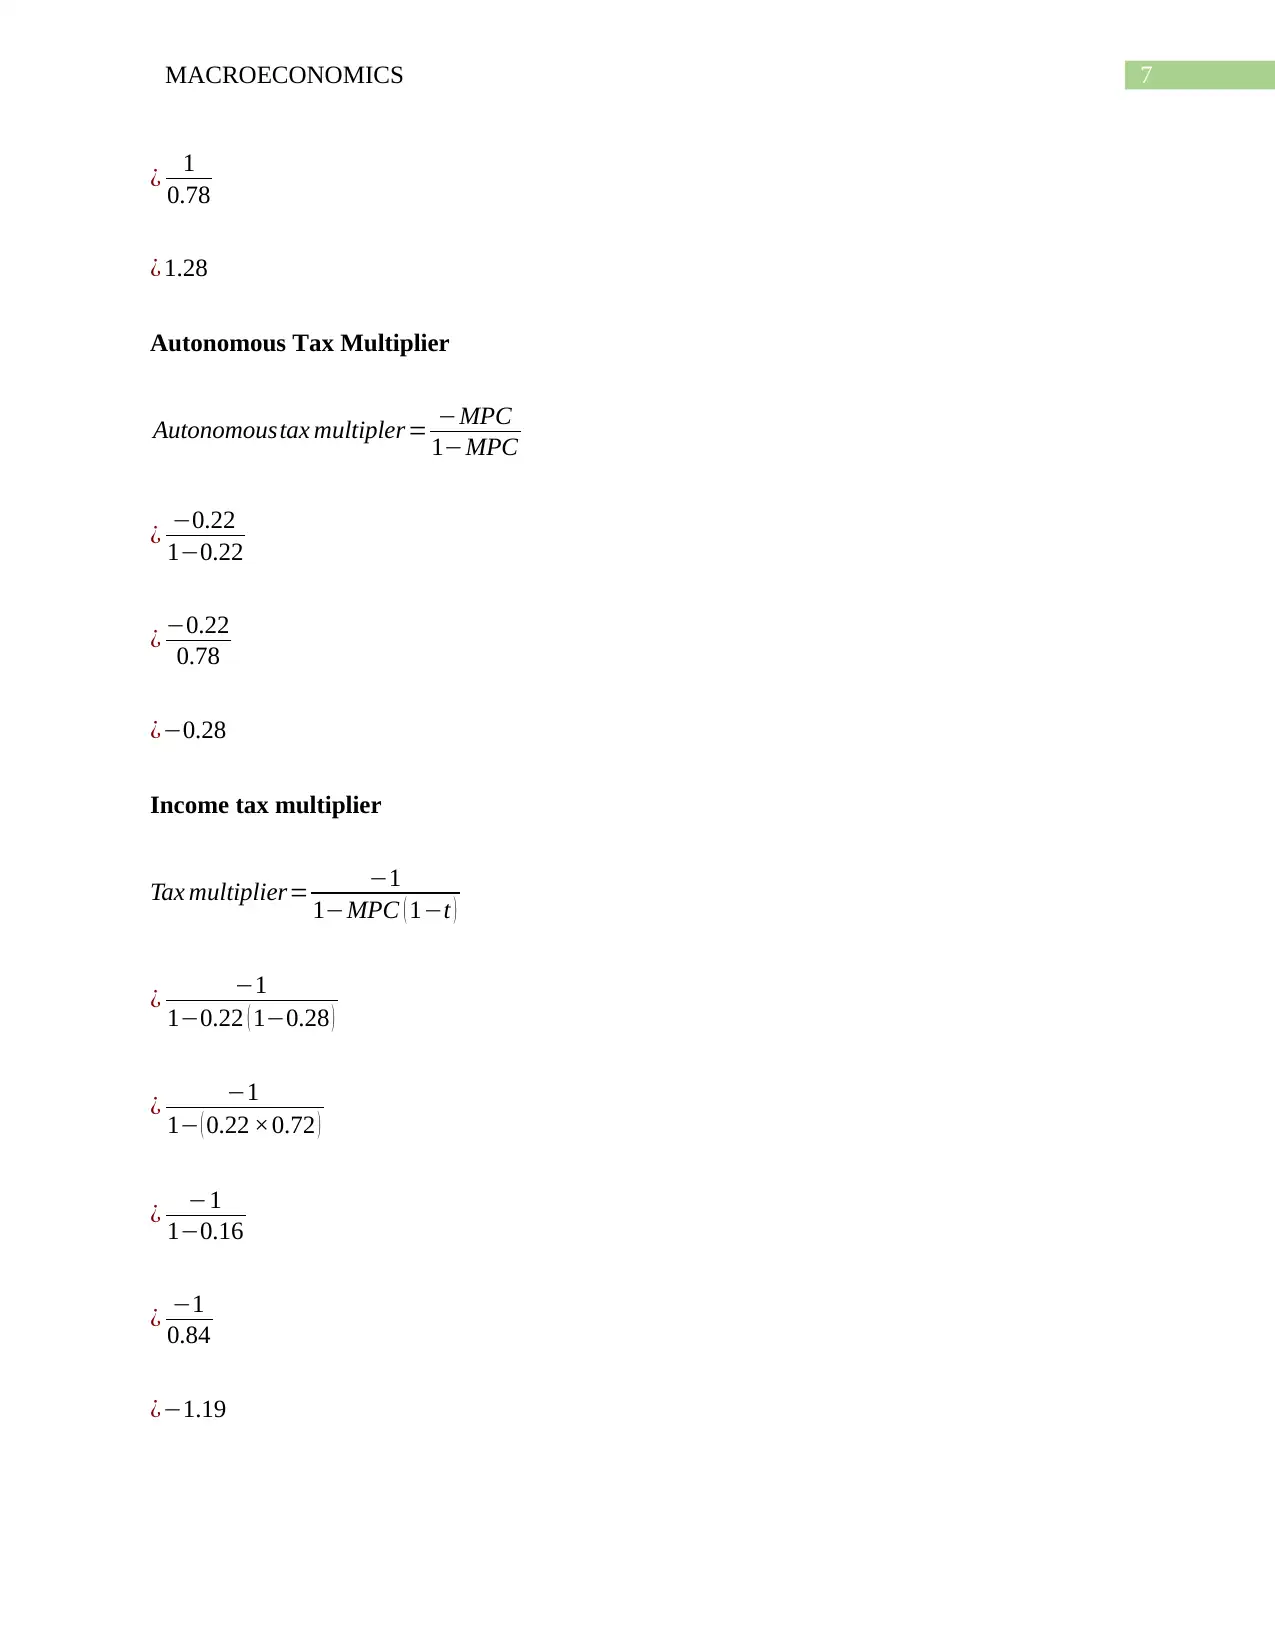
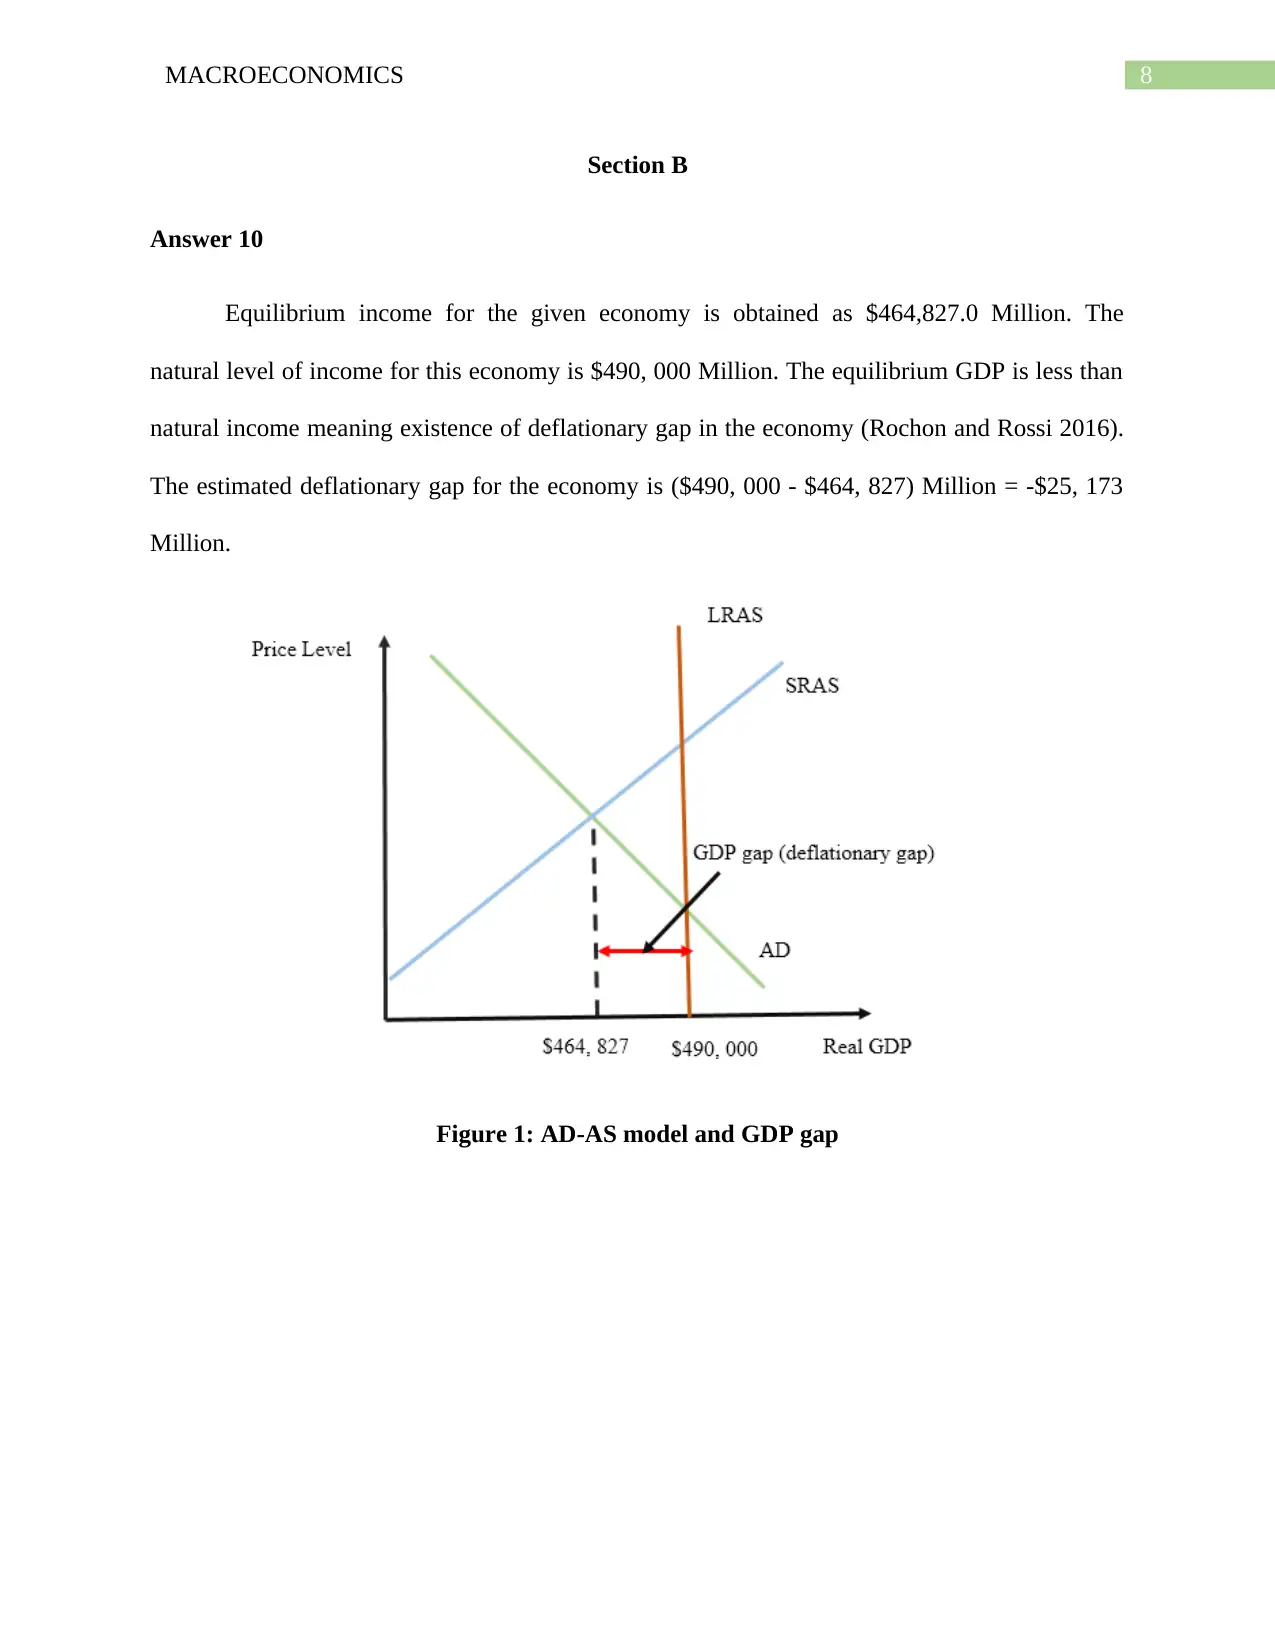
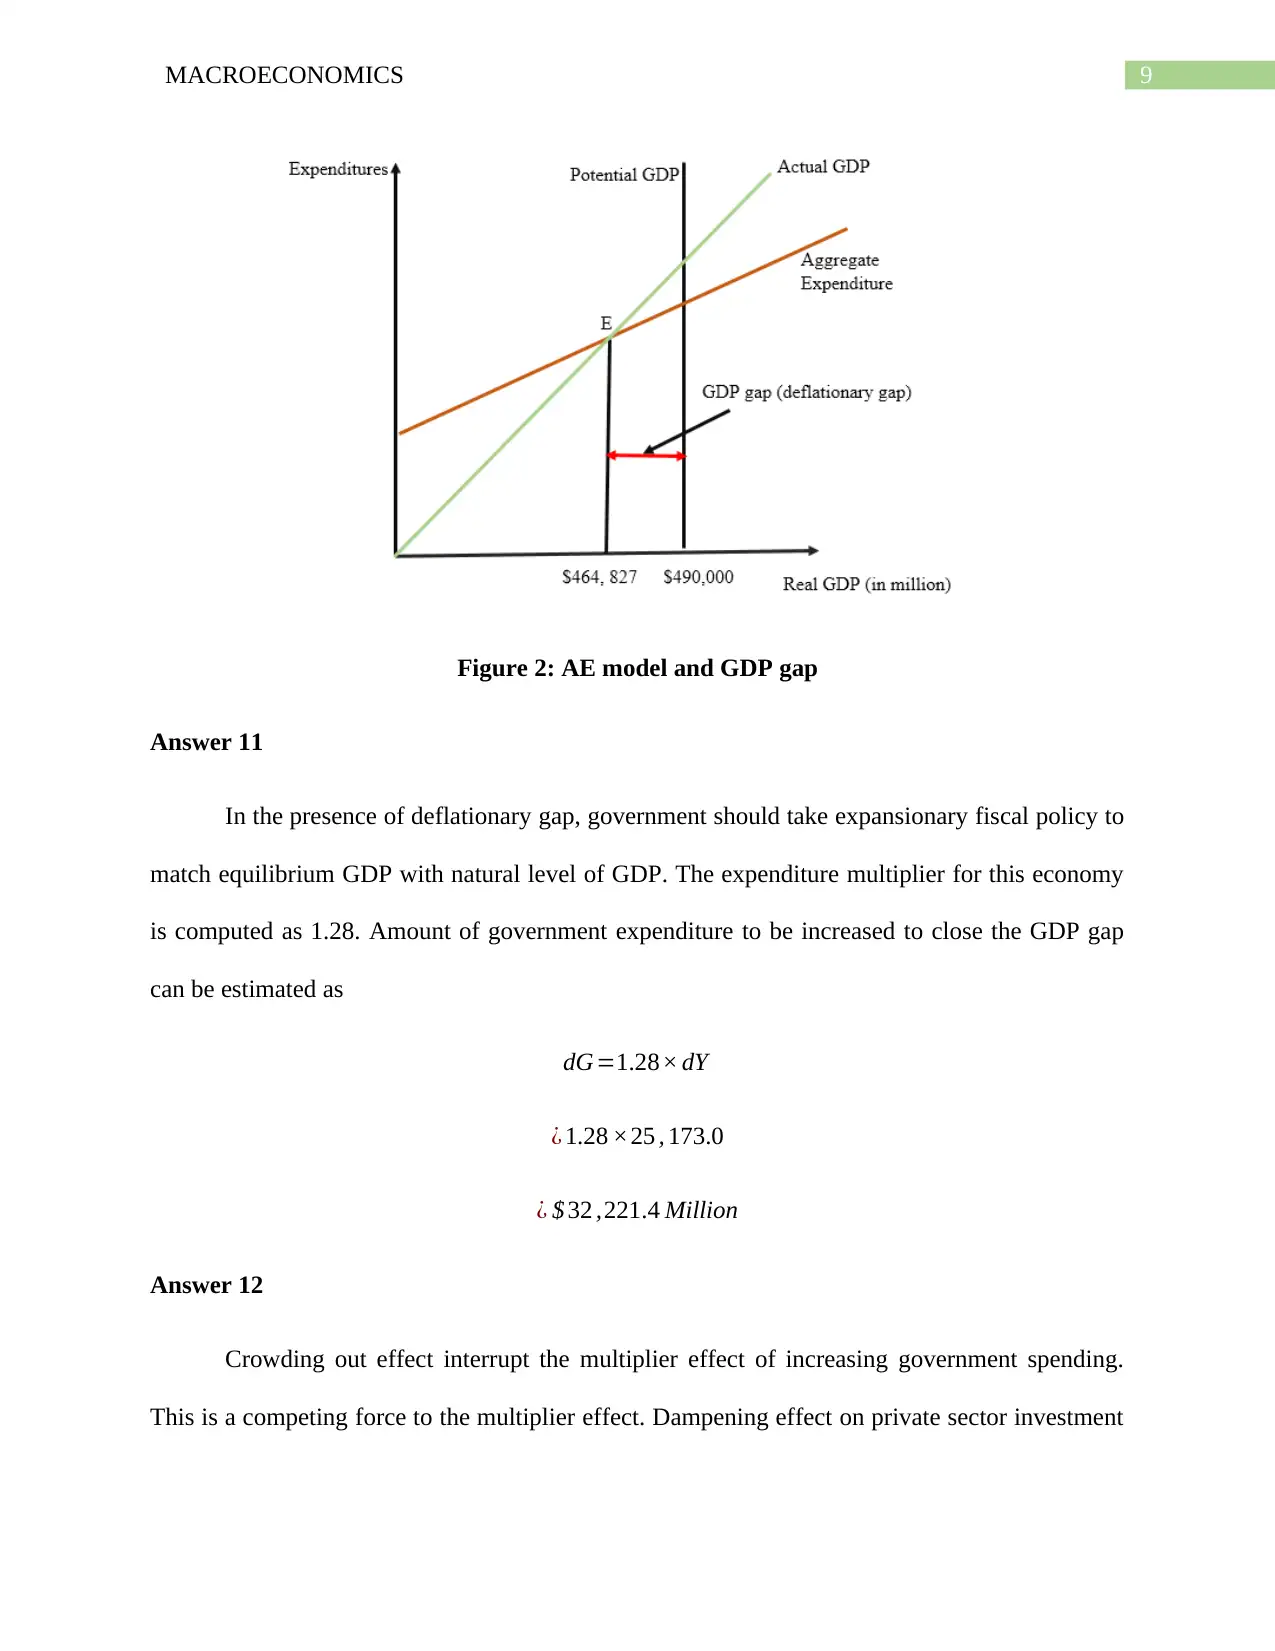
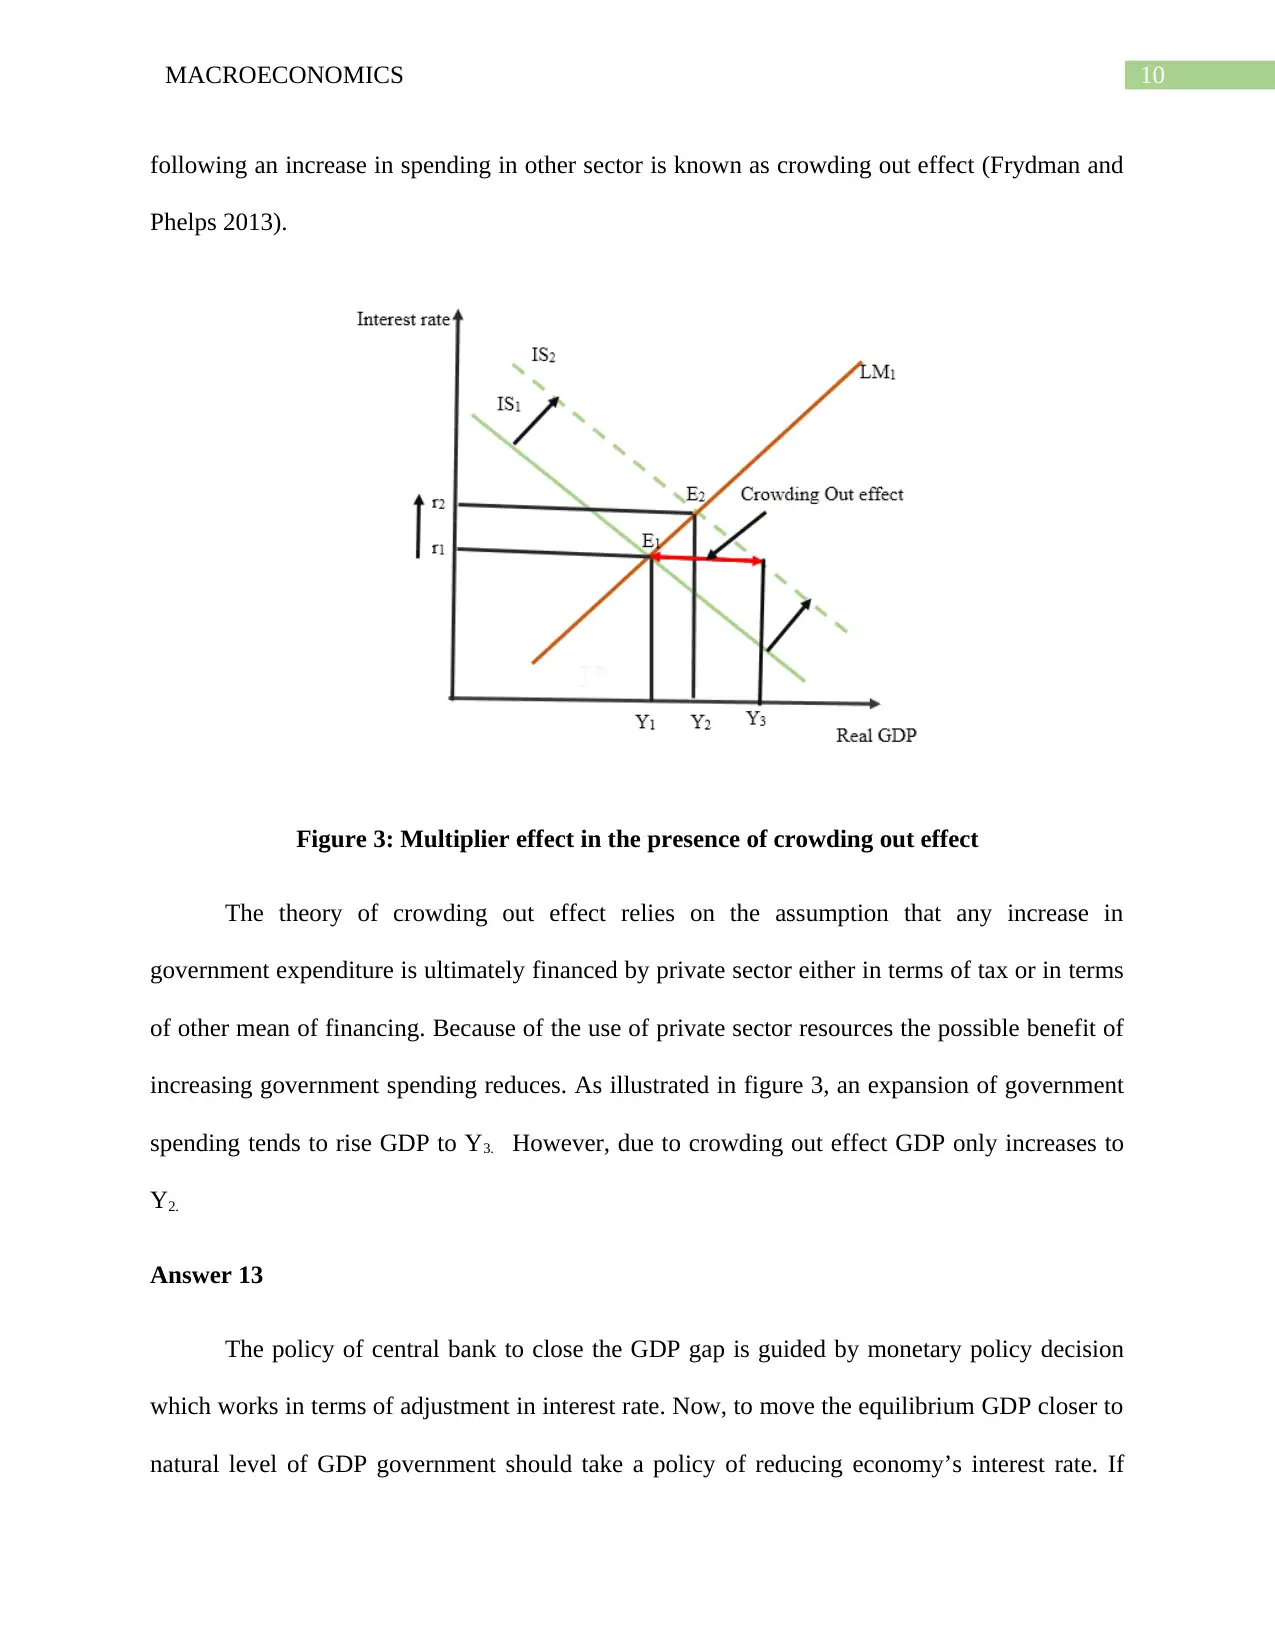
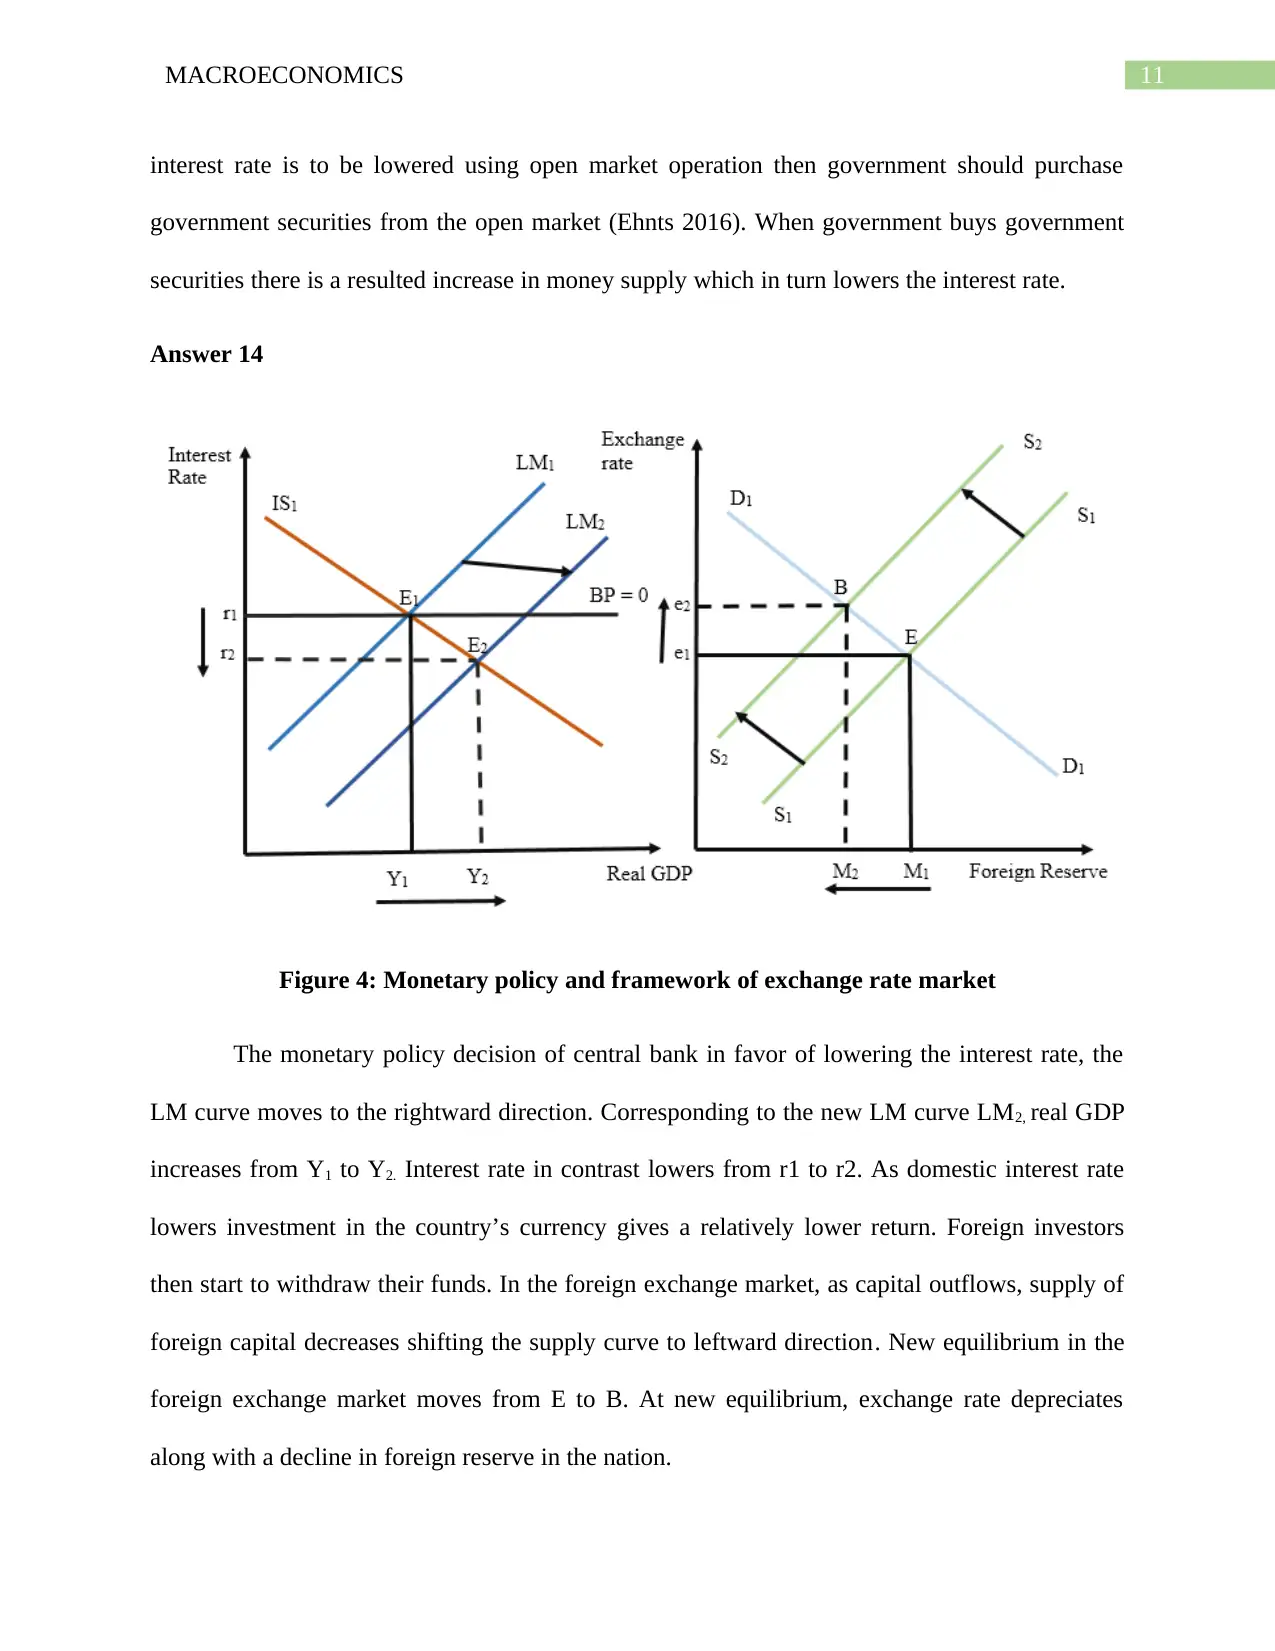
This macroeconomics assignment analyzes various economic concepts and policies. Section A covers the consumption function, equilibrium income, investment, and import functions. It also delves into the conditions for equilibrium income, the concept of marginal leakage rate, and different multipliers. Section B focuses on calculating equilibrium income, identifying a deflationary gap, and discussing expansionary fiscal policy. It further explores the crowding out effect and how monetary policy, including interest rate adjustments and open market operations, can address the GDP gap. The assignment also examines the impact of monetary policy on exchange rates and the effects of currency depreciation on net exports, GDP, and employment. The document concludes with a list of relevant references for further study and research.
Document Page
Running head: MACROECONOMICS
Macroeconomics
Name of the Student
Name of the University
Author note
tabler-icon-diamond-filled.svg

Paraphrase This Document

Need a fresh take? Get an instant paraphrase of this document with our AI Paraphraser
Document Page
1MACROECONOMICS
Table of Contents
Section A.........................................................................................................................................2
Answer 1......................................................................................................................................2
Answer 2......................................................................................................................................3
Answer 3......................................................................................................................................3
Answer 4......................................................................................................................................4
Answer 5......................................................................................................................................5
Answer 6......................................................................................................................................5
Answer 7......................................................................................................................................5
Answer 8......................................................................................................................................6
Answer 9......................................................................................................................................6
Section B..........................................................................................................................................8
Answer 10....................................................................................................................................8
Answer 11....................................................................................................................................9
Answer 12....................................................................................................................................9
Answer 13..................................................................................................................................10
Answer 14..................................................................................................................................11
Answer 15..................................................................................................................................12
List of References..........................................................................................................................13
Document Page
2MACROECONOMICS
Consumption Expenditure: $262,619.0 million
Planned investment: $86,227.0 million
Government expenditure: $113,601.0 million
Export expenditure: $99,804.0 million
Import expenditure: $97,424.0 million
Autonomous taxes: $56,700.0 million
Income tax: 28%
Marginal propensity to save: 0.4
Marginal propensity to import: 0.1
Section A
Answer 1
Marginal Propensity ¿ Consume ( MPC )=1MPSMPT MPM
¿ 10.40.280.1
¿ 10.78
¿ 0.22
The standard consumption function can be given as
C=a+ b Y d
Document Page
3MACROECONOMICS
C = Consumption, a = Autonomous consumption, b = Marginal Propensity to Consume, Yd =
Disposable income.
Disposable income ( Y d ) =Income Autonomoustaxes
¿ ( $ 450 , 179.0$ 56,700.0 ) Million
¿ $ 393,479.0 Million
Autonomous consumption=Consumption ( b× Disposable income )
¿ $ 262,619.0 ( 0.22 × $ 393 , 479.0 ) Million
¿ ( $ 262,619.0$ 86,565.4 ) Million
¿ $ 176 , 053.6 Million
Answer 2
Level of Saving=IncomeConsumption expenditureGovernment expenditure
¿ ( $ 450 , 179$ 262,619.0$ 113 , 601.0 ) Million
¿ $ 73959.0 Million
Answer 3
The condition of equilibrium income
Y =C + I+ G+( XM )
Y: Income
I: Investment expenditure
tabler-icon-diamond-filled.svg

Paraphrase This Document

Need a fresh take? Get an instant paraphrase of this document with our AI Paraphraser
Document Page
4MACROECONOMICS
G: Government expenditure
X: Export
M: Import
Actual Investment ( I )=Y CG ( X M )
¿ $ 450,179.0$ 262 , 619.0$ 113 , 601.0 ( $ 99,804.0$ 97 , 424 ) Million
¿ ( $ 450 , 179.0$ 262 , 619.0$ 113 , 601.0$ 2380.0 ) Million
¿ $ 71579.0 Million
Planned investment = $86, 227.0 Million
Unintended inventory investment= Actual investmentPlanned investment
¿ ( $ 71579.0$ 86 , 227.0 ) Million
¿14 , 648.0 Million
Answer 4
Import=c +dY
c = Autonomous import, b = Marginal Propensity to import, Y = Income
Autonomousimport=Import expendituredY
¿ $ 97 , 424.0 ( 0.1× $ 450 , 179 ) Million
¿ ( $ 97 , 424.0$ 45017.9 ) Million
¿ $ 52, 406.1 Million
Document Page
5MACROECONOMICS
Answer 5
Net Export=A + BY
A = Autonomous net export, B = Marginal Propensity to import, Y = Income
Net Export =Export expenditureImport expenditure
¿ ( $ 99 , 804.0$ 97 , 424.0 ) Million
¿ $ 2380.0 Million
Autonomous net export=Net exportBY
¿ $ 2380.0 ( 0.1 × $ 450 ,179.0 ) Million
¿ ( $ 2380.0$ 45017.9 ) Million
¿42,637.9 Million
Answer 6
Autonomous planned expenditure=Autonomous consumption+ Planned investment + Autonomous net export
¿ ( $ 176053.6+$ 86,227.0$ 42 , 637. 9 ) Million
¿ $ 219 ,642.7 Million
Answer 7
Given the scenario, it can be said that the economy is not in equilibrium since actual
investment is lower than planned investment indicating a negative unintended inventory
investment.
Document Page
6MACROECONOMICS
The condition of equilibrium income
Y =C + I +G+ ( XM )
¿ $ 262 ,619.0+ $ 86 , 227.0+ $ 113 , 601.0+ ( $ 99,804$ 97 , 424 ) Million
¿ ( 262,619.0+86,227.0+113,601.0+ $ 2380.0 ) Million
¿ $ 464 ,827.0 Million
Answer 8
Marginal leakage rate=MPS+ MPT +MPM
¿ 0.4+ 0.28+0.1
¿ 0.78
Marginal leakage rate in the economy symbolizes portion of income that is not spent on
domestic consumption. This part of the income presents income that is excluded from the
iterative process of the circular process (Burda and Wyplosz 2013). Saving, income tax and
import together constitute total leakages of the economy.
Answer 9
Expenditure Multiplier Expenditure Multiplier= 1
Total Leakages
¿ 1
MPS+MPT + MPM
¿ 1
0.4+0.28+ 0.1
tabler-icon-diamond-filled.svg

Paraphrase This Document

Need a fresh take? Get an instant paraphrase of this document with our AI Paraphraser
Document Page
7MACROECONOMICS
¿ 1
0.78
¿ 1.28
Autonomous Tax Multiplier
Autonomoustax multipler = MPC
1MPC
¿ 0.22
10.22
¿ 0.22
0.78
¿0.28
Income tax multiplier
Tax multiplier= 1
1MPC ( 1t )
¿ 1
10.22 ( 10.28 )
¿ 1
1 ( 0.22 ×0.72 )
¿ 1
10.16
¿ 1
0.84
¿1.19
Document Page
8MACROECONOMICS
Section B
Answer 10
Equilibrium income for the given economy is obtained as $464,827.0 Million. The
natural level of income for this economy is $490, 000 Million. The equilibrium GDP is less than
natural income meaning existence of deflationary gap in the economy (Rochon and Rossi 2016).
The estimated deflationary gap for the economy is ($490, 000 - $464, 827) Million = -$25, 173
Million.
Figure 1: AD-AS model and GDP gap
Document Page
9MACROECONOMICS
Figure 2: AE model and GDP gap
Answer 11
In the presence of deflationary gap, government should take expansionary fiscal policy to
match equilibrium GDP with natural level of GDP. The expenditure multiplier for this economy
is computed as 1.28. Amount of government expenditure to be increased to close the GDP gap
can be estimated as
dG=1.28× dY
¿ 1.28 ×25 , 173.0
¿ $ 32 ,221.4 Million
Answer 12
Crowding out effect interrupt the multiplier effect of increasing government spending.
This is a competing force to the multiplier effect. Dampening effect on private sector investment
tabler-icon-diamond-filled.svg

Paraphrase This Document

Need a fresh take? Get an instant paraphrase of this document with our AI Paraphraser
Document Page
10MACROECONOMICS
following an increase in spending in other sector is known as crowding out effect (Frydman and
Phelps 2013).
Figure 3: Multiplier effect in the presence of crowding out effect
The theory of crowding out effect relies on the assumption that any increase in
government expenditure is ultimately financed by private sector either in terms of tax or in terms
of other mean of financing. Because of the use of private sector resources the possible benefit of
increasing government spending reduces. As illustrated in figure 3, an expansion of government
spending tends to rise GDP to Y3. However, due to crowding out effect GDP only increases to
Y2.
Answer 13
The policy of central bank to close the GDP gap is guided by monetary policy decision
which works in terms of adjustment in interest rate. Now, to move the equilibrium GDP closer to
natural level of GDP government should take a policy of reducing economy’s interest rate. If
Document Page
11MACROECONOMICS
interest rate is to be lowered using open market operation then government should purchase
government securities from the open market (Ehnts 2016). When government buys government
securities there is a resulted increase in money supply which in turn lowers the interest rate.
Answer 14
Figure 4: Monetary policy and framework of exchange rate market
The monetary policy decision of central bank in favor of lowering the interest rate, the
LM curve moves to the rightward direction. Corresponding to the new LM curve LM2, real GDP
increases from Y1 to Y2. Interest rate in contrast lowers from r1 to r2. As domestic interest rate
lowers investment in the country’s currency gives a relatively lower return. Foreign investors
then start to withdraw their funds. In the foreign exchange market, as capital outflows, supply of
foreign capital decreases shifting the supply curve to leftward direction. New equilibrium in the
foreign exchange market moves from E to B. At new equilibrium, exchange rate depreciates
along with a decline in foreign reserve in the nation.
chevron_up_icon
1 out of 14
circle_padding
hide_on_mobile
zoom_out_icon
[object Object]