Macroeconomics: GDP, Inflation, and Global Economy Report
VerifiedAdded on 2020/06/03
|15
|2472
|27
Report
AI Summary
This report provides a comprehensive overview of macroeconomic principles, focusing on key concepts such as GDP calculation, economic growth, inflation, unemployment, and international trade. It examines the measurement of GDP using expenditure and income approaches, analyzes nominal and real GDP, and discusses the limitations of GDP as a measure of economic welfare, including the challenges of incorporating factors like the Human Development Index (HDI). The report delves into labor market dynamics, calculating labor force participation, employment, and unemployment rates, and explores the causes of unemployment. It also analyzes the effects of monetary policy, specifically the expansion of the euro currency on money supply, interest rates, and economic growth. Furthermore, it examines the US current account, exchange rates, and balance of payments, discussing the implications of trade deficits and currency fluctuations. The report concludes with an analysis of Australia's ranking in the HDI, indicating its high level of health and education relative to other nations.

Introduction to
Macroeconomics
Macroeconomics
Paraphrase This Document
Need a fresh take? Get an instant paraphrase of this document with our AI Paraphraser

TABLE OF CONTENTS
INTRODUCTION...........................................................................................................................1
QUESTION 1...................................................................................................................................1
Measuring GDP and Economic growth:.....................................................................................1
QUESTION 2...................................................................................................................................3
Jobs and Inflation........................................................................................................................3
Quantities Expansion of money in EU........................................................................................6
QUESTION 3...................................................................................................................................6
Global saving and US current account........................................................................................6
Exchange rate .............................................................................................................................7
Balance of payment.....................................................................................................................8
CONCLUSION................................................................................................................................9
REFERENCES................................................................................................................................9
⊘ This is a preview!⊘
Do you want full access?
Subscribe today to unlock all pages.
Trusted by 1+ million students worldwide
INTRODUCTION
How the economy as whole is performing in international market what is its structure and
decision making process on national and international level is known as macroeconomic. This
will be helping to study economy as on aggregate bases and including phenomenon like that of
inflation, unemployment, growth rates, national income, GDP and poverty. The present report
will be including all these phenomena which are the very basic concepts of macroeconomic like
what is ranking of Australia in HDI indicating and what are the reason behind unemployment.
QUESTION 1
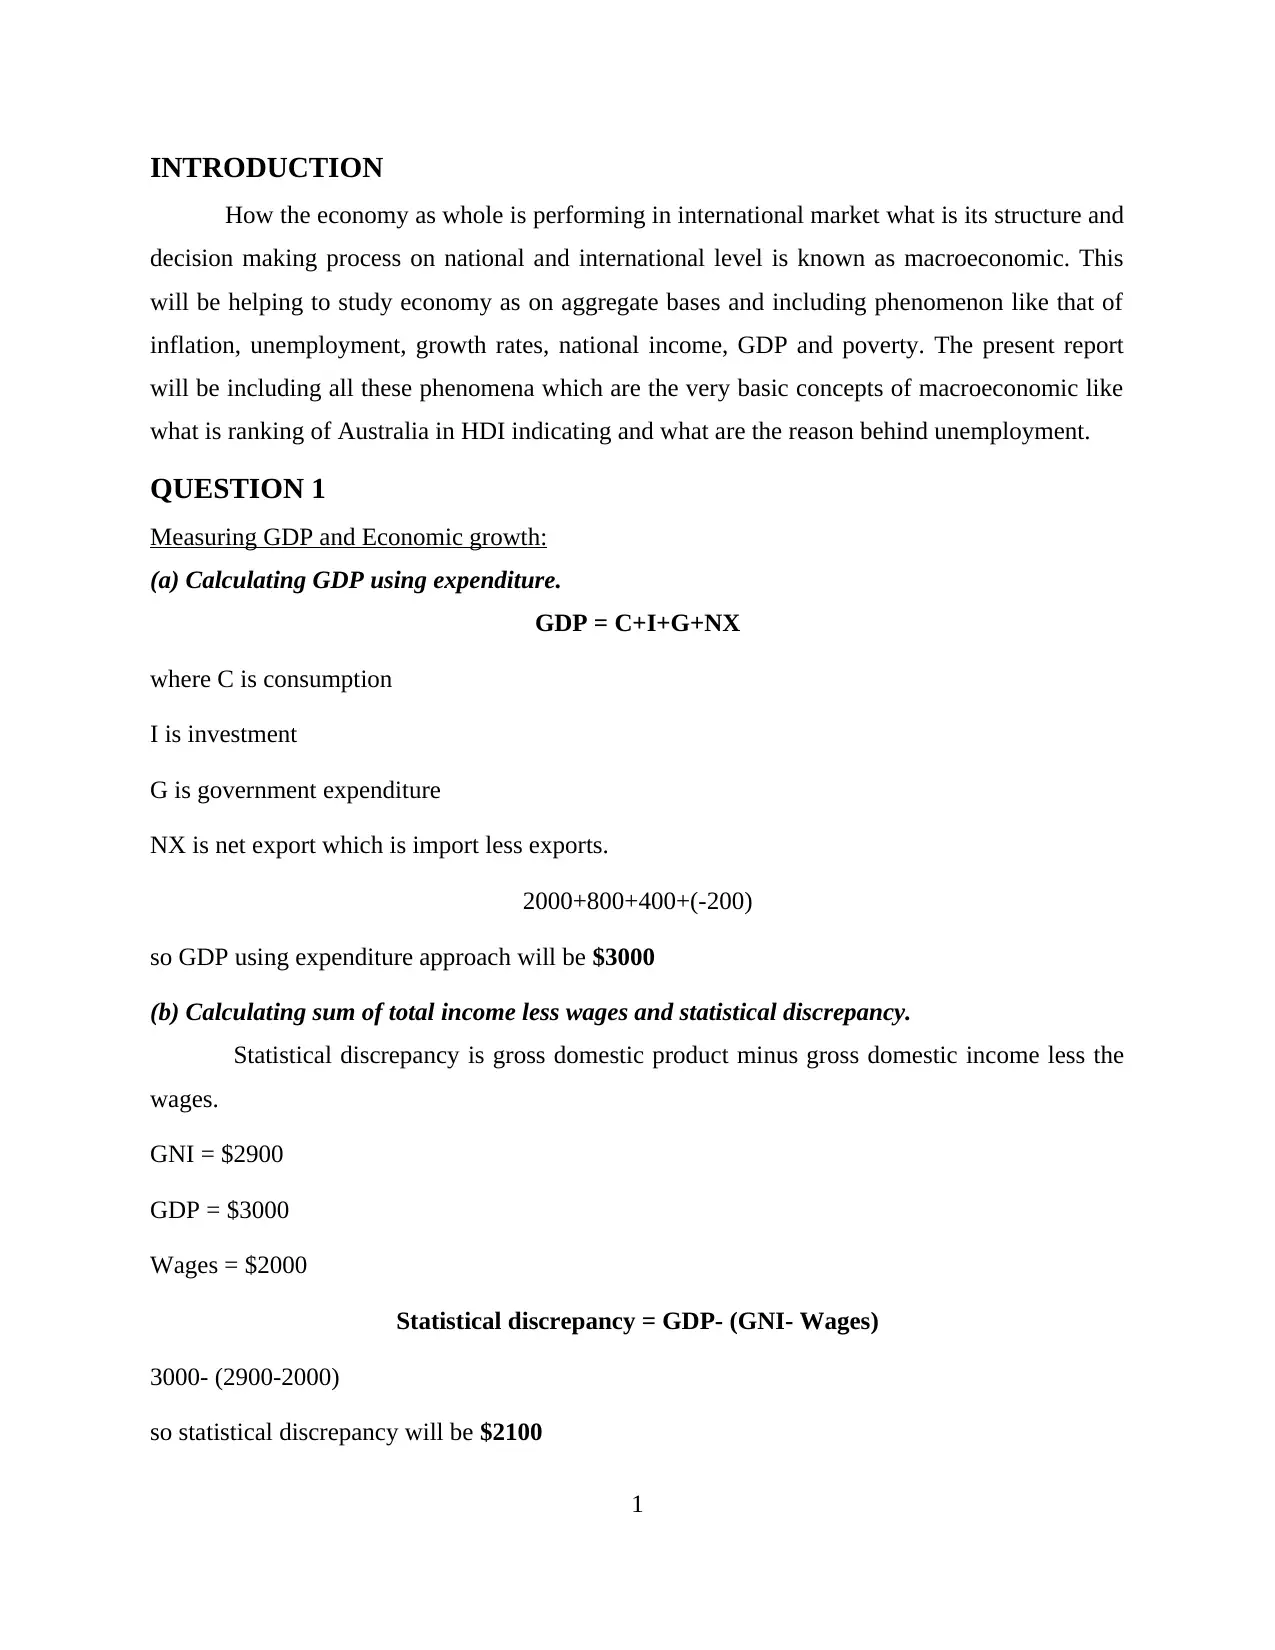
Measuring GDP and Economic growth:
(a) Calculating GDP using expenditure.
GDP = C+I+G+NX
where C is consumption
I is investment
G is government expenditure
NX is net export which is import less exports.
2000+800+400+(-200)
so GDP using expenditure approach will be $3000
(b) Calculating sum of total income less wages and statistical discrepancy.
Statistical discrepancy is gross domestic product minus gross domestic income less the
wages.
GNI = $2900
GDP = $3000
Wages = $2000
Statistical discrepancy = GDP- (GNI- Wages)
3000- (2900-2000)
so statistical discrepancy will be $2100
1
How the economy as whole is performing in international market what is its structure and
decision making process on national and international level is known as macroeconomic. This
will be helping to study economy as on aggregate bases and including phenomenon like that of
inflation, unemployment, growth rates, national income, GDP and poverty. The present report
will be including all these phenomena which are the very basic concepts of macroeconomic like
what is ranking of Australia in HDI indicating and what are the reason behind unemployment.
QUESTION 1
Measuring GDP and Economic growth:
(a) Calculating GDP using expenditure.
GDP = C+I+G+NX
where C is consumption
I is investment
G is government expenditure
NX is net export which is import less exports.
2000+800+400+(-200)
so GDP using expenditure approach will be $3000
(b) Calculating sum of total income less wages and statistical discrepancy.
Statistical discrepancy is gross domestic product minus gross domestic income less the
wages.
GNI = $2900
GDP = $3000
Wages = $2000
Statistical discrepancy = GDP- (GNI- Wages)
3000- (2900-2000)
so statistical discrepancy will be $2100
1
Paraphrase This Document
Need a fresh take? Get an instant paraphrase of this document with our AI Paraphraser
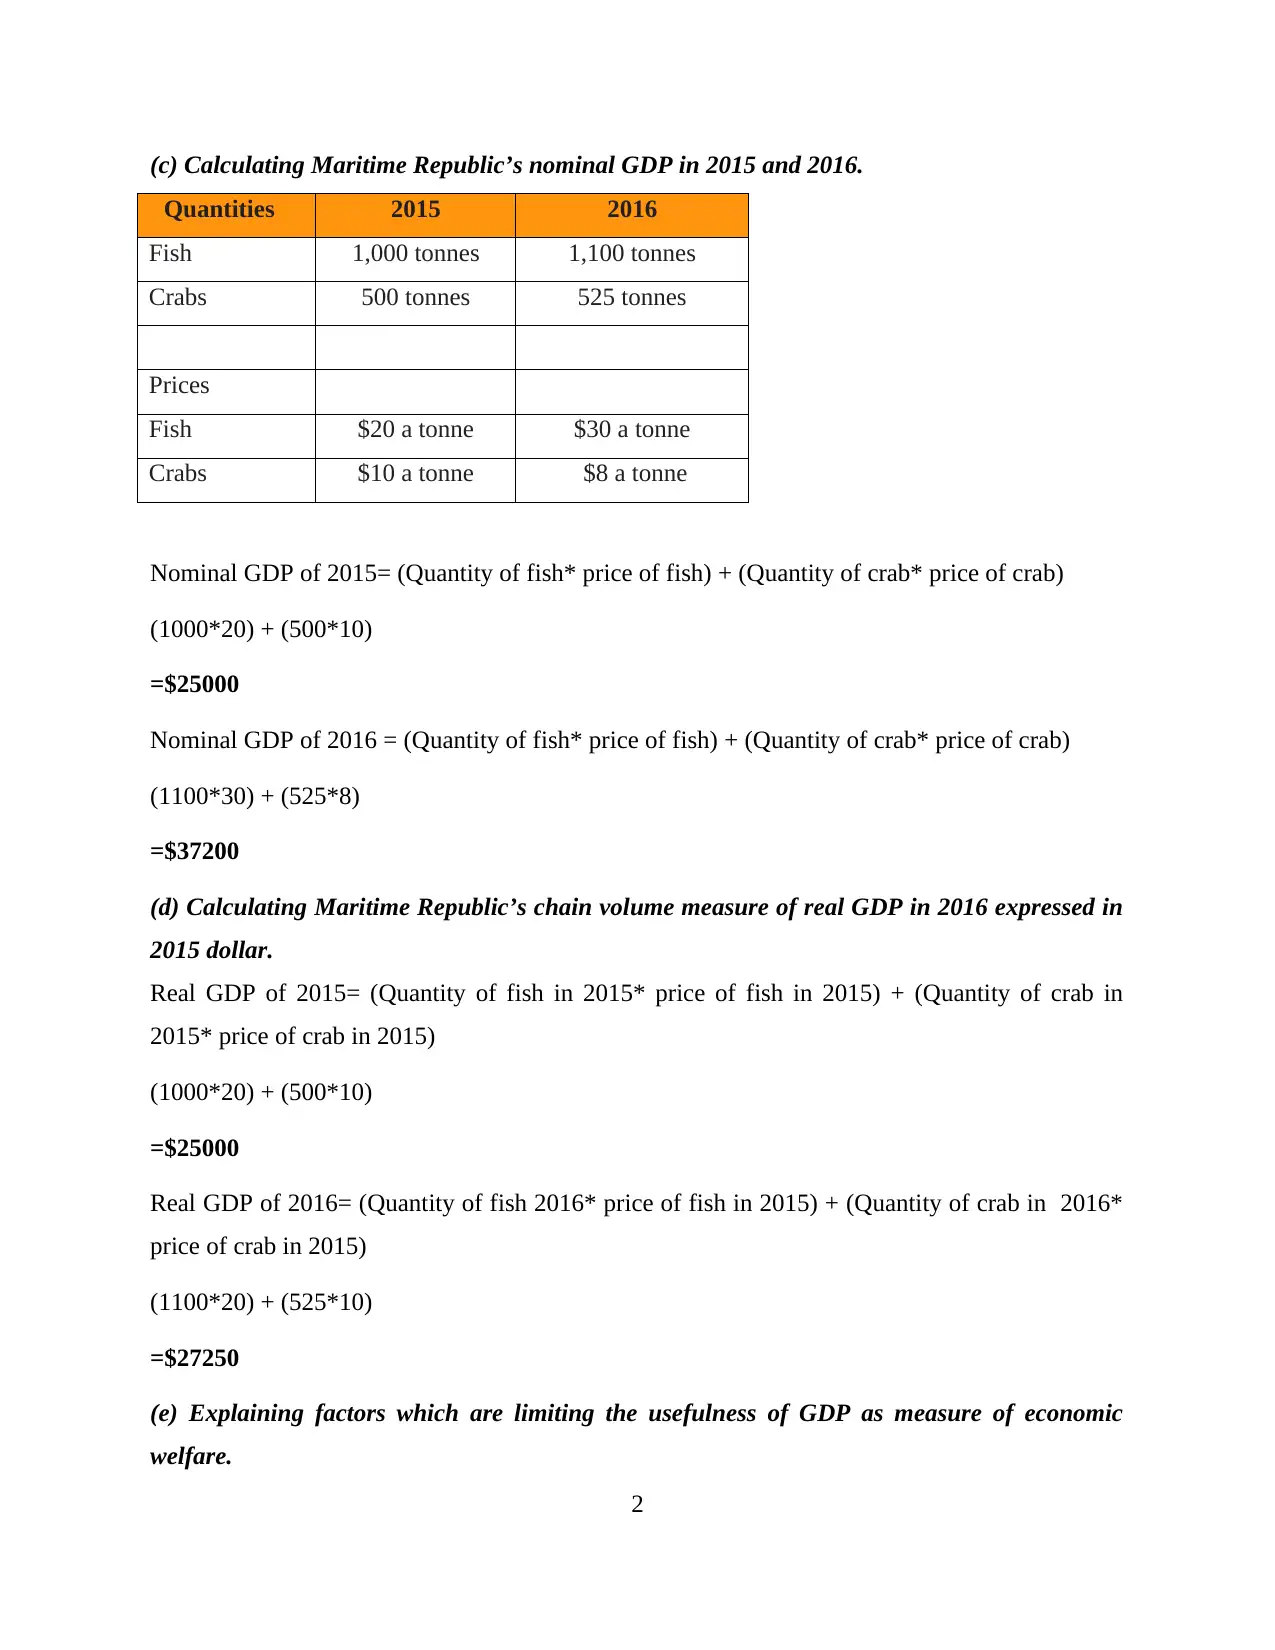
(c) Calculating Maritime Republic’s nominal GDP in 2015 and 2016.
Quantities 2015 2016
Fish 1,000 tonnes 1,100 tonnes
Crabs 500 tonnes 525 tonnes
Prices
Fish $20 a tonne $30 a tonne
Crabs $10 a tonne $8 a tonne
Nominal GDP of 2015= (Quantity of fish* price of fish) + (Quantity of crab* price of crab)
(1000*20) + (500*10)
=$25000
Nominal GDP of 2016 = (Quantity of fish* price of fish) + (Quantity of crab* price of crab)
(1100*30) + (525*8)
=$37200
(d) Calculating Maritime Republic’s chain volume measure of real GDP in 2016 expressed in
2015 dollar.
Real GDP of 2015= (Quantity of fish in 2015* price of fish in 2015) + (Quantity of crab in
2015* price of crab in 2015)
(1000*20) + (500*10)
=$25000
Real GDP of 2016= (Quantity of fish 2016* price of fish in 2015) + (Quantity of crab in 2016*
price of crab in 2015)
(1100*20) + (525*10)
=$27250
(e) Explaining factors which are limiting the usefulness of GDP as measure of economic
welfare.
2
GDP is the indicator of all the activities which are taking place in economy during the
current year and also measuring social welfare of people (Dosi and Roventini, 2017). But there
are also some factors which are limiting the importance of GDP as the measure of economic
welfare:
GDP is not taking social welfare into account while calculating and only amount of goods
produced and sold and taken into account.
It is also not describing wealth distribution which is there into country as most of the people are
not able to afford goods and services.
(f) What are the challenges involved in trying to incorporate measurements of these factors to
measure economic welfare?
To overcome above stated limitations there are various others measured which are
undertaken like that of Human Development Index and Social progress index (Stiglitz, 2018).
They will be measuring social well being and welfare into account so that actual GDP of nation
is calculated. But there are some challenges in these two measure as well which are as follows:
It is very difficult to measure the gross national happiness index which will be calculating
number of people who are happy in country or which nation is the happiest.
They are not accurate if the index of life expectancy or education is been taken out and
then calculated. Level of education is not eventually spread within any countries of world as this is only
limited to certain group of people.
(g) What does the ranking of Australia in Human Development Index (HDI) indicate about
the level of health and education relative to other nations?
The ranking of any country in the HDI will be indicating level of health and that of
education in comparison to other countries of world. Australia is been ranked amongst the most
reputed and developed country of world level of health and sanitation, education ratio, living
standards of people are very much high compared to others. The rank of Australia in HDI which
is 2nd in 2017 with the index of 0.939 (Hendry and Muellbauer, 2018). This tells that life
expectancy at birth rate of Australia is 82.5 and expected year of schooling in years is 20.4 which
is very good.
3
⊘ This is a preview!⊘
Do you want full access?
Subscribe today to unlock all pages.
Trusted by 1+ million students worldwide
QUESTION 2
Jobs and Inflation
(a) Calculating labour force.
Labour Force Participation rate= labour force/total working population
let the labour force be “X” in the above equation so
69.6%= X/18,429,726
X= 69.6%*18,429,726
=12827089.296 (which is employed and unemployed population both)
(b) Calculating employment
Employment-to-population ratio: labour force employed/ total population
let the labour force employed be “X” in the above equation so
65.2= X/18,429,726
X= 65.2*18,429,726
=1201618135.2
(c) Calculating unemployment rate in November 2015.
Employed in October 2015=3602700
Unemployed in October 2015= 200,500
Labour force was 3,803,200
Employed in November 2015=3605600
Unemployed in November 2015= 197300
Labour force was November =3802900
so rate of unemployment in November 2015= number of unemployed/total labour force
=197300/3802900
=5.18
(d) Calculating CPI in current year
4
Paraphrase This Document
Need a fresh take? Get an instant paraphrase of this document with our AI Paraphraser
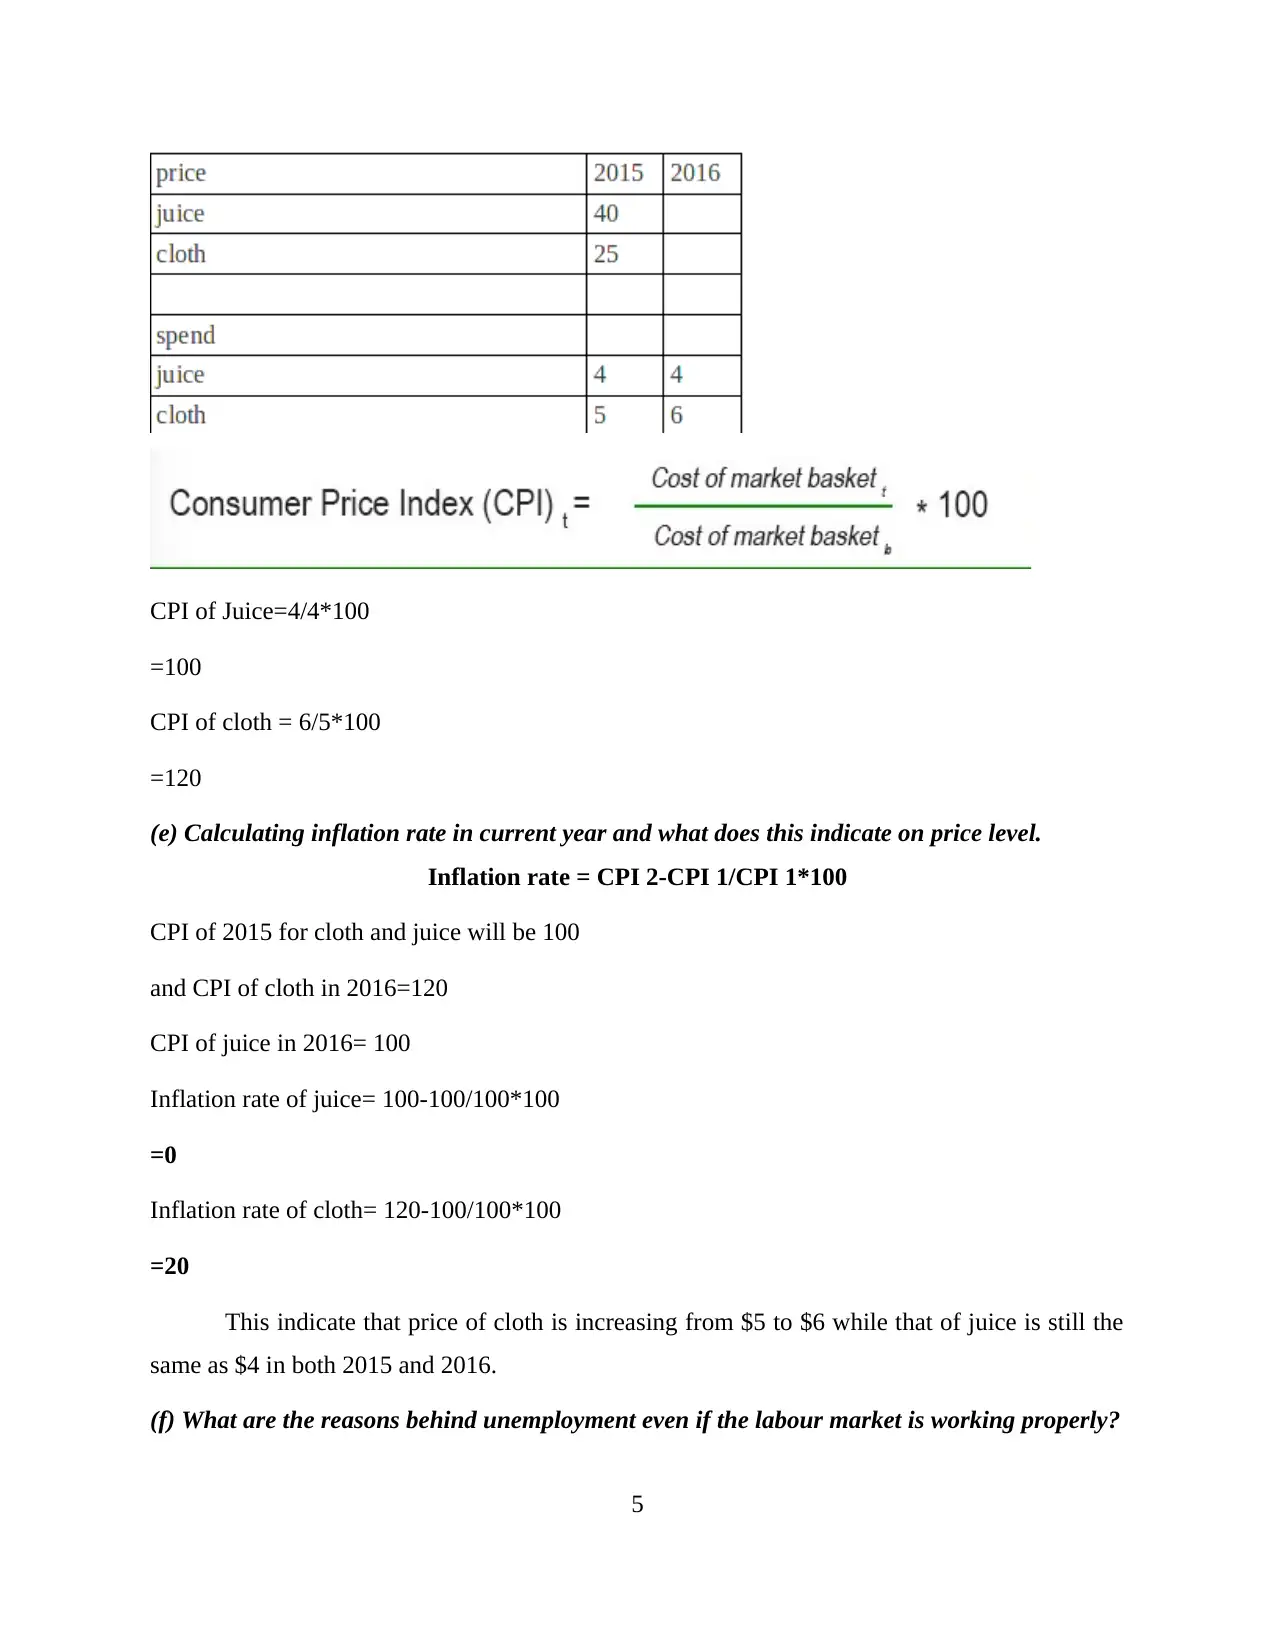
CPI of Juice=4/4*100
=100
CPI of cloth = 6/5*100
=120
(e) Calculating inflation rate in current year and what does this indicate on price level.
Inflation rate = CPI 2-CPI 1/CPI 1*100
CPI of 2015 for cloth and juice will be 100
and CPI of cloth in 2016=120
CPI of juice in 2016= 100
Inflation rate of juice= 100-100/100*100
=0
Inflation rate of cloth= 120-100/100*100
=20
This indicate that price of cloth is increasing from $5 to $6 while that of juice is still the
same as $4 in both 2015 and 2016.
(f) What are the reasons behind unemployment even if the labour market is working properly?
5
Even if labour market is doing good and working properly there could be reasons as to
why there is unemployed force still within Australia (Perez-Quiros, 2018). The main will be the
lack of skilled labours as the skill which company need is not there within the labour who is
qualified to get one. The other reason could the person who is in search of job may be expecting
something more which employer is not ready to give.
(g) Who are the part of structural or cyclical unemployment?
The additional workers who are not been able to get the jobs are surely a part of structural
unemployment in the three months of August. As they are not having those skills which are been
required by job vacancy at that time or in those employment areas. Cyclical unemployment is
that type of unemployment under which the skilled and qualified workers are not getting the job
over specified period of each year (Wright, 2018).
Quantities Expansion of money in EU.
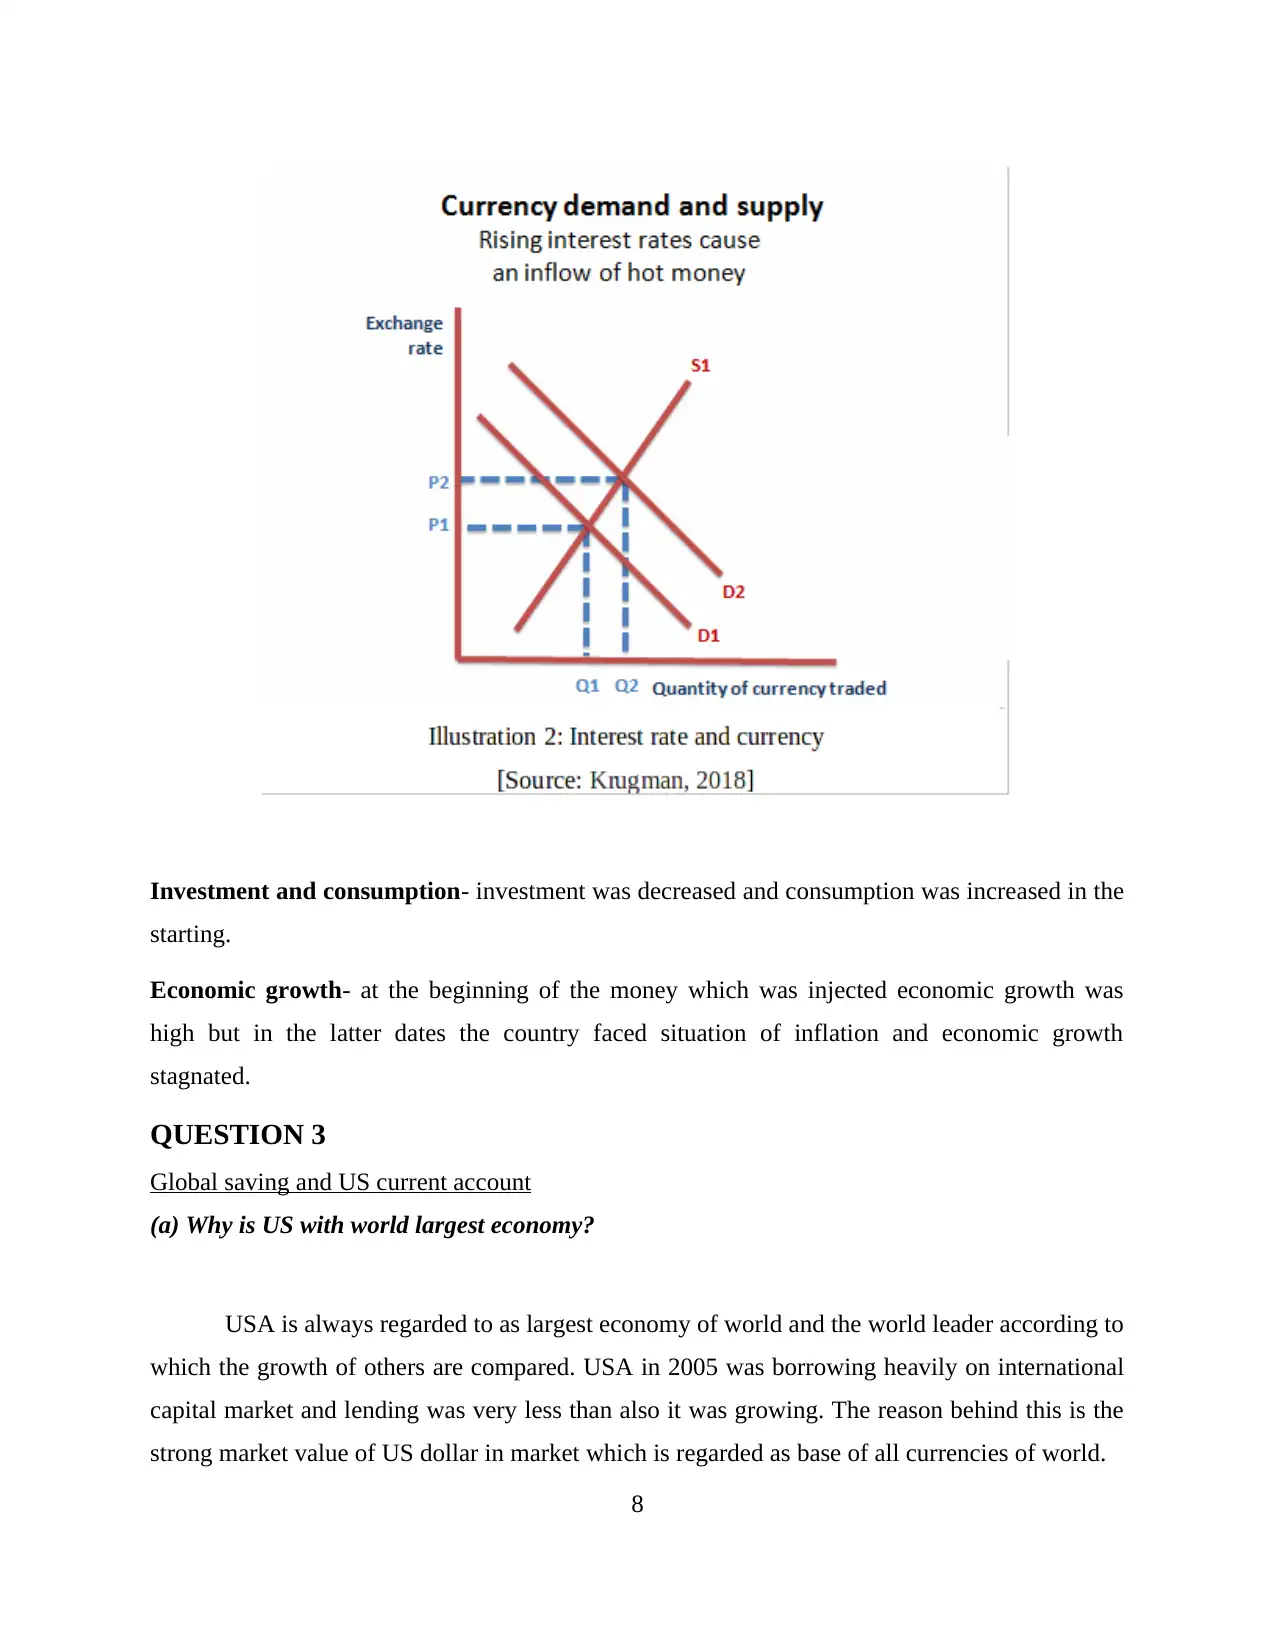
(h) How quantity expansion of euro currency likely ot affect money supply, interest rate,
investment, consumption and economic growth?
European Central bank increased the quantities of money by 60 million euro every month
in the open market on March 2015 which was done to help EU countries (Proietti, 2018). This
effected money supply, interest rate, investment and consumption and economic growth of EU in
following manners:
Money supply- this was increased as there were lots of money injected in the economy.
6
why there is unemployed force still within Australia (Perez-Quiros, 2018). The main will be the
lack of skilled labours as the skill which company need is not there within the labour who is
qualified to get one. The other reason could the person who is in search of job may be expecting
something more which employer is not ready to give.
(g) Who are the part of structural or cyclical unemployment?
The additional workers who are not been able to get the jobs are surely a part of structural
unemployment in the three months of August. As they are not having those skills which are been
required by job vacancy at that time or in those employment areas. Cyclical unemployment is
that type of unemployment under which the skilled and qualified workers are not getting the job
over specified period of each year (Wright, 2018).
Quantities Expansion of money in EU.
(h) How quantity expansion of euro currency likely ot affect money supply, interest rate,
investment, consumption and economic growth?
European Central bank increased the quantities of money by 60 million euro every month
in the open market on March 2015 which was done to help EU countries (Proietti, 2018). This
effected money supply, interest rate, investment and consumption and economic growth of EU in
following manners:
Money supply- this was increased as there were lots of money injected in the economy.
6
⊘ This is a preview!⊘
Do you want full access?
Subscribe today to unlock all pages.
Trusted by 1+ million students worldwide
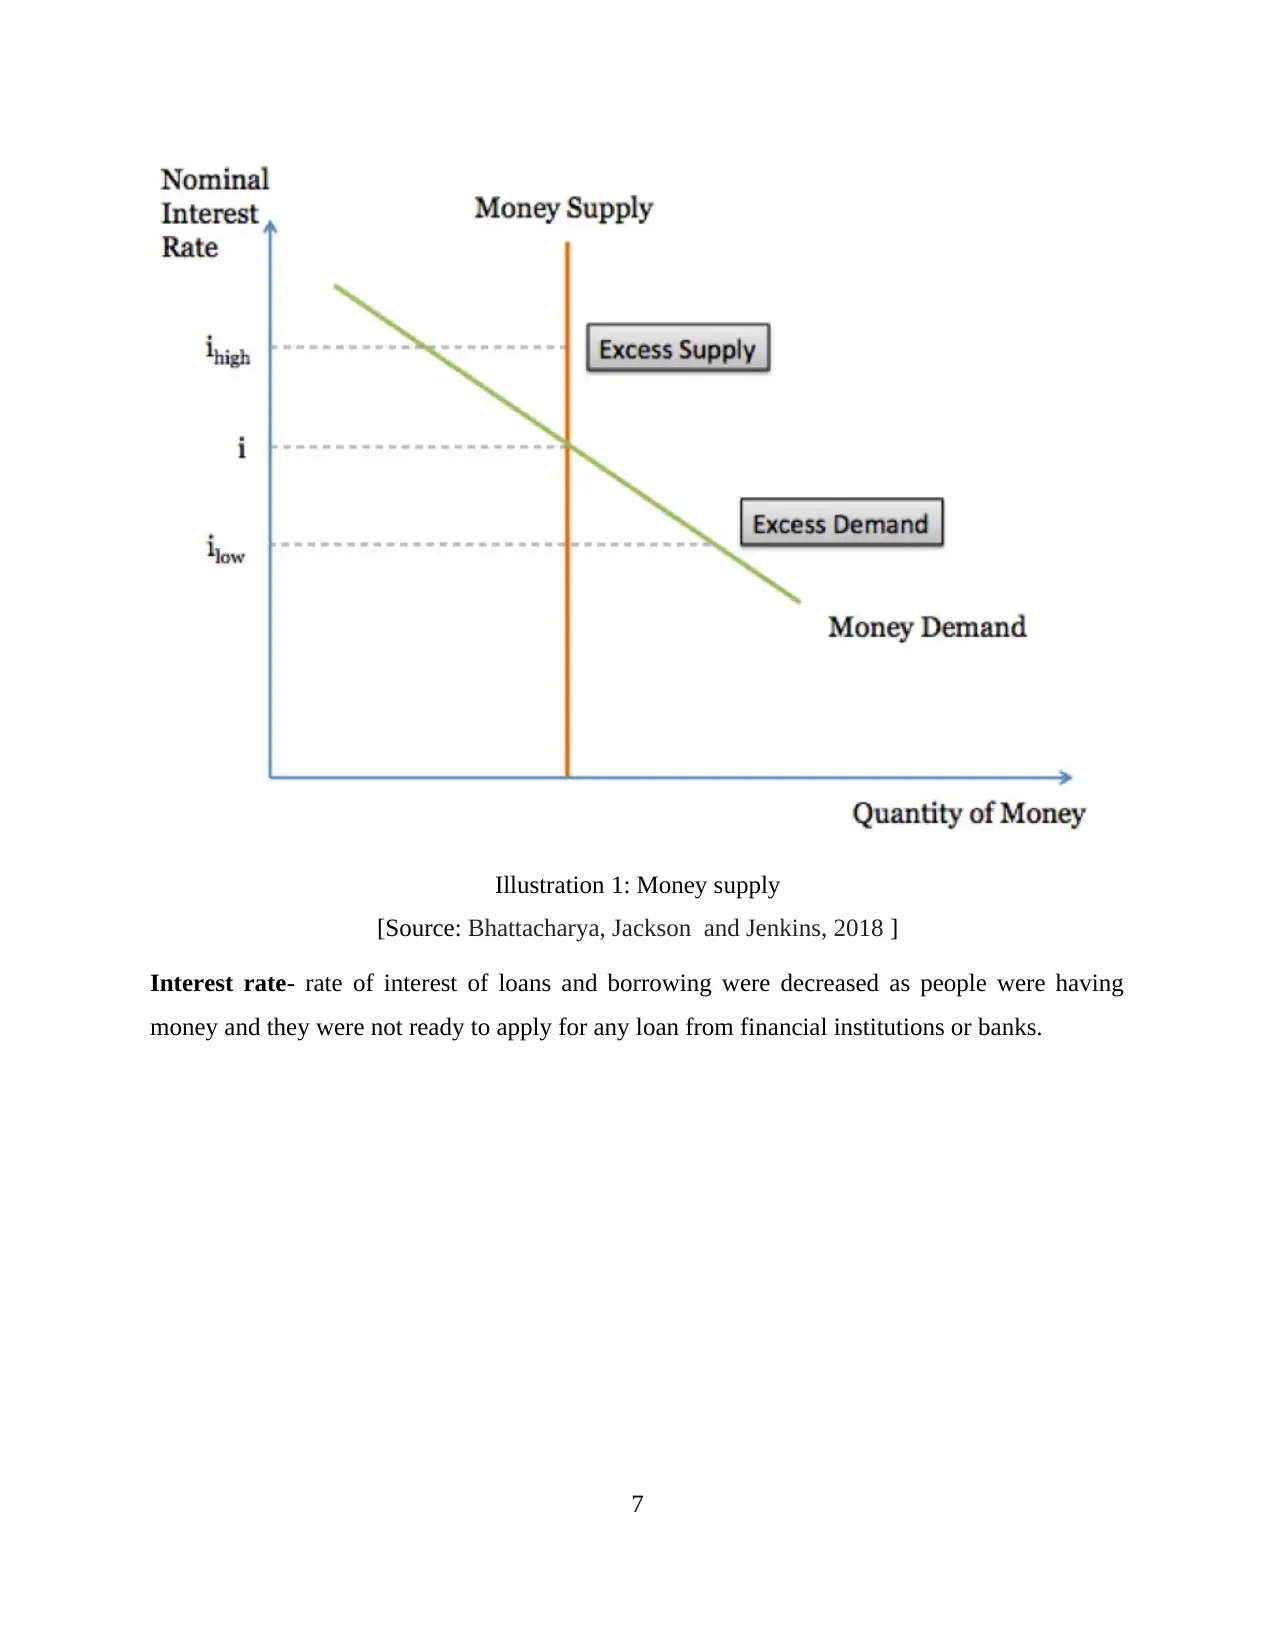
Illustration 1: Money supply
[Source: Bhattacharya, Jackson and Jenkins, 2018 ]
Interest rate- rate of interest of loans and borrowing were decreased as people were having
money and they were not ready to apply for any loan from financial institutions or banks.
7
[Source: Bhattacharya, Jackson and Jenkins, 2018 ]
Interest rate- rate of interest of loans and borrowing were decreased as people were having
money and they were not ready to apply for any loan from financial institutions or banks.
7
Paraphrase This Document
Need a fresh take? Get an instant paraphrase of this document with our AI Paraphraser
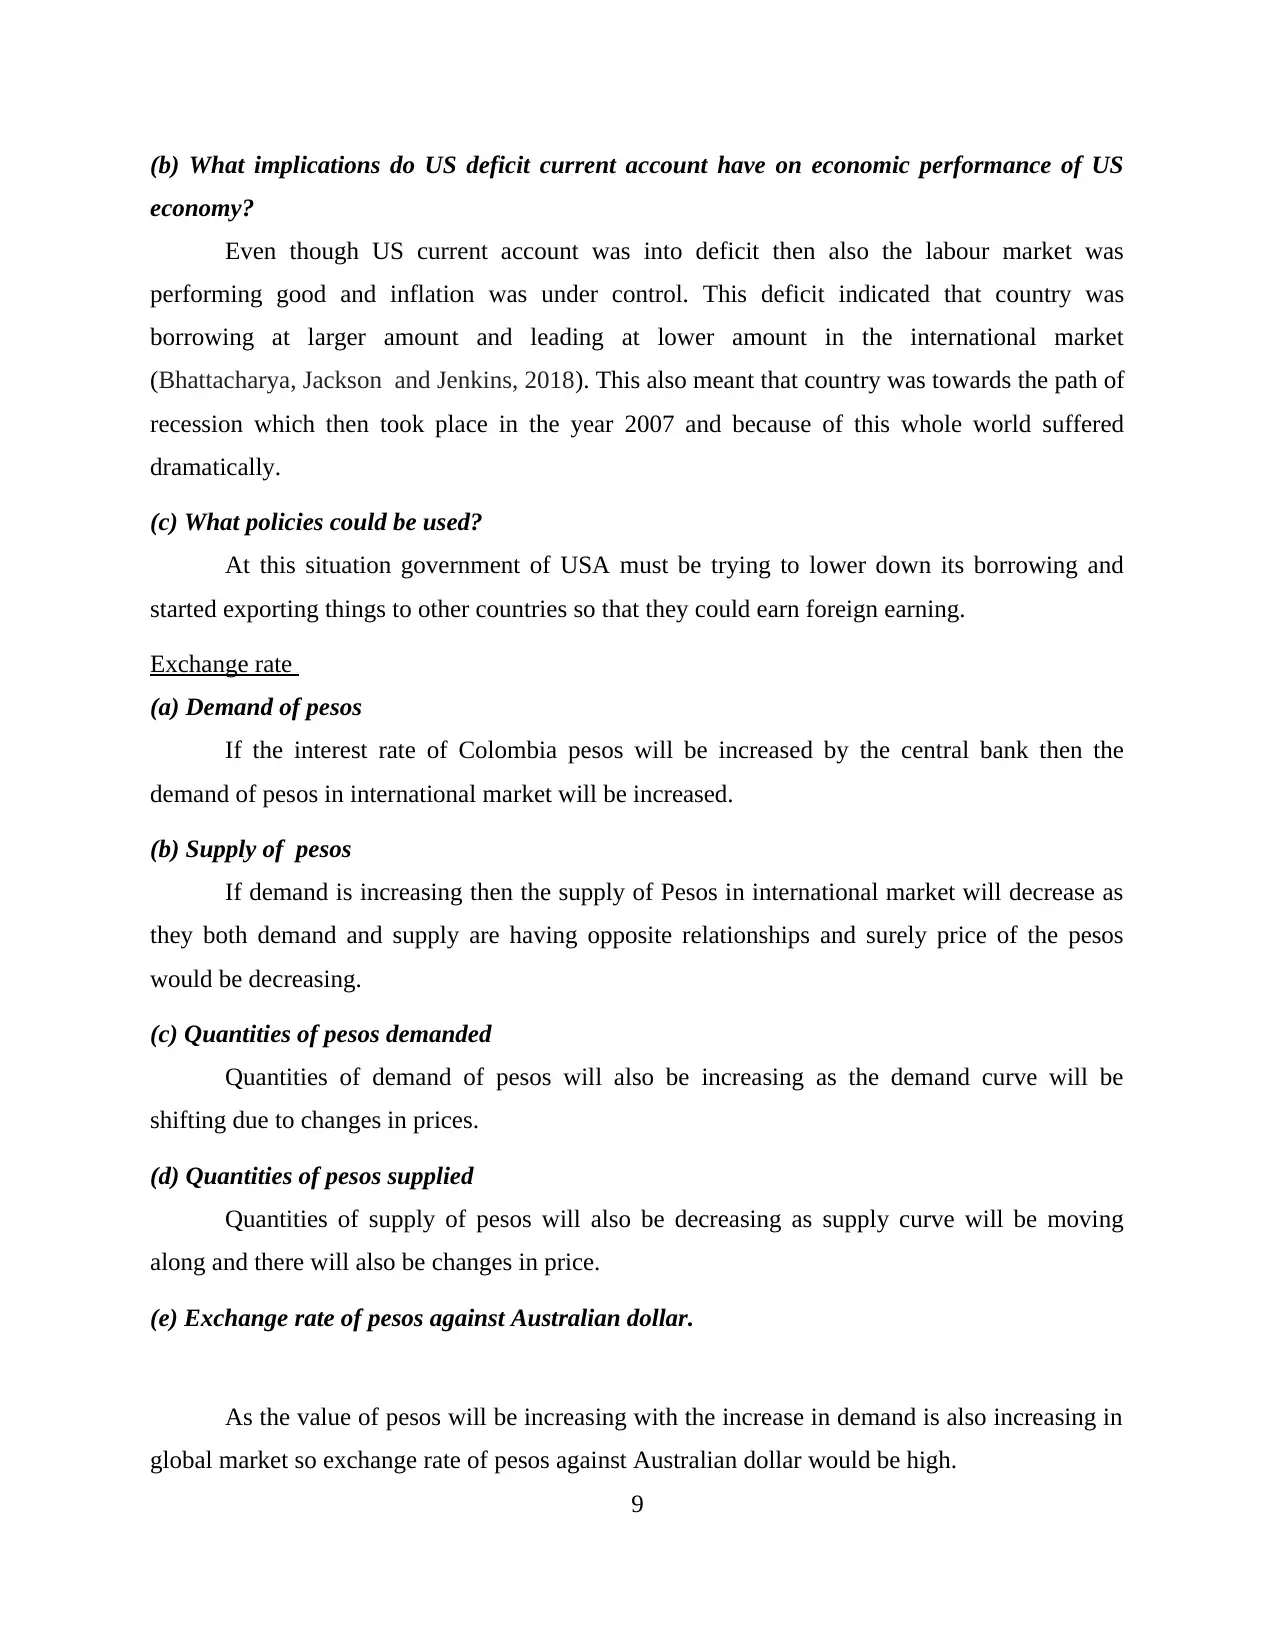
Investment and consumption- investment was decreased and consumption was increased in the
starting.
Economic growth- at the beginning of the money which was injected economic growth was
high but in the latter dates the country faced situation of inflation and economic growth
stagnated.
QUESTION 3
Global saving and US current account
(a) Why is US with world largest economy?
USA is always regarded to as largest economy of world and the world leader according to
which the growth of others are compared. USA in 2005 was borrowing heavily on international
capital market and lending was very less than also it was growing. The reason behind this is the
strong market value of US dollar in market which is regarded as base of all currencies of world.
8
(b) What implications do US deficit current account have on economic performance of US
economy?
Even though US current account was into deficit then also the labour market was
performing good and inflation was under control. This deficit indicated that country was
borrowing at larger amount and leading at lower amount in the international market
(Bhattacharya, Jackson and Jenkins, 2018). This also meant that country was towards the path of
recession which then took place in the year 2007 and because of this whole world suffered
dramatically.
(c) What policies could be used?
At this situation government of USA must be trying to lower down its borrowing and
started exporting things to other countries so that they could earn foreign earning.
Exchange rate
(a) Demand of pesos
If the interest rate of Colombia pesos will be increased by the central bank then the
demand of pesos in international market will be increased.
(b) Supply of pesos
If demand is increasing then the supply of Pesos in international market will decrease as
they both demand and supply are having opposite relationships and surely price of the pesos
would be decreasing.
(c) Quantities of pesos demanded
Quantities of demand of pesos will also be increasing as the demand curve will be
shifting due to changes in prices.
(d) Quantities of pesos supplied
Quantities of supply of pesos will also be decreasing as supply curve will be moving
along and there will also be changes in price.
(e) Exchange rate of pesos against Australian dollar.
As the value of pesos will be increasing with the increase in demand is also increasing in
global market so exchange rate of pesos against Australian dollar would be high.
9
⊘ This is a preview!⊘
Do you want full access?
Subscribe today to unlock all pages.
Trusted by 1+ million students worldwide
1 out of 15


Your All-in-One AI-Powered Toolkit for Academic Success.
+13062052269
info@desklib.com
Available 24*7 on WhatsApp / Email
![[object Object]](/_next/static/media/star-bottom.7253800d.svg)
Unlock your academic potential
Copyright © 2020–2026 A2Z Services. All Rights Reserved. Developed and managed by ZUCOL.