Macroeconomics Assignment: IS-LM Model, Policy Effects, and Yen/USD
VerifiedAdded on 2023/04/05
|5
|1686
|227
Homework Assignment
AI Summary
This macroeconomics assignment covers the IS-LM model, fiscal policy, and exchange rate dynamics. It includes multiple-choice questions and problem sets that analyze the equilibrium output and interest rates using the IS-LM model, the impact of changes in money supply, and the effects of government spending. The assignment also discusses the effectiveness of monetary policy in a globalized world with and without capital controls, and provides an analysis of the Yen/USD exchange rate fluctuations over time, identifying periods of appreciation and depreciation with explanations of the underlying economic factors. Desklib provides this and many other solved assignments to help students excel.

Module Title: MACROECONOMICS
Course Code:
STUDENT ID:
[Pick the date]
Course Code:
STUDENT ID:
[Pick the date]
Paraphrase This Document
Need a fresh take? Get an instant paraphrase of this document with our AI Paraphraser
PART A: Multiple Choice Questions
1) Option A
Explanation: For a closed economy, it is imperative that the public and private saving must be
equal to the investment. For the given scenario, both public and private saving amount to 100
each which implies that the investment is 200.
2) Option C
Explanation: In liquidity trap, people want to hold on to money rather than bonds. Also, the
monetary policy is ineffective since the demand is not spurred even at zero interest rates.
Fiscal policy proves to be effective in this scenario since it helps in increasing aggregate
demand through fiscal stimulus.
3) Option B
Explanation: It is apparent that there is a shifting of LM curve causing lowering rate and
higher GDP output. This is typical of increasing money supply. As a result, purchase of
securities from market would have been done by the central bank which would increase the
liquidity in the market and lead to lowering interest rate and higher output. No changes in the
tax has been done during movement from 3 to 1 since IS curve has not shifted.
4) Option C
Explanation: The current price of the bond is the present value of expected cash flows in the
future. If there is an increase in the interest rates, there would be a decrease in the present
value of future cash flows leading to declining bond prices. The other statements do not offer
explanation to the inverse relationship between bond prices and interest rates.
5) Option A
Explanation: Option C offers the definition for nominal exchange rate. Option D is incorrect
as it talks about trading of same goods. Option A is correct as real exchange rate compares
the amount of goods and services that can be bought in the domestic market compared to that
in international market using a common currency.
6) Option A
Explanation: This option is true since fiscal consolidation is not aimed at providing a stimulus
to the economy but rather ensuring that the tax revenue is increased along with more rational
conduct of expenditure especially on social welfare so as to ensure that wastage and leakages
are minimised.
PART B: PROBLEM SET
a) The IS relation is defined as follows.
Y = C+ I+G
Putting the respective values of C,I,G from the given relations, we obtain the following.
Y = 400 + 0.25(Y-400) + 300 + 0.25Y -1500i + 600
Y = 400 + 0.25Y – 100 + 300 + 0.25Y -1500i + 600
Y = 1200 + 0.5Y -1500 i
0.5Y = 1200 – 1500i
Y = 2400 – 3000i
b) The LM equation can be derived by equation the real money demand and real money
supply which is indicated below based on the available relations.
2Y-12000i = 3000
2Y = 3000 + 12000i
Y=1500 + 6000i
c) In order to find the equilibrium, the IS and LM equations need to be equated as shown
below.
2400 – 3000i = 1500+6000i
Solving the above, we get i = 0.1 or 10%
For i =0.1, Y= 1500 + 6000*0.1 = 2100
Hence, equilibrium output is 2100 million and equilibrium interest rate is 10%.
C = 400 + 0.25(2100-400) = 825 million
I = 300 + 0.25*2100 – 1500*0.1 = 675 million
d) If the interest rate is negative, then there would not be any incentive for the people to
invest in bond as the present value of the future cash flows available from the bond would
be negative. This is because there would be periodic interest outflow (instead of inflow) of
interest payment to the issuer from the holder. As a result, it makes sense that the people
would want to hold money rather than bonds.
e) The LM curve would change as indicated below.
2Y-12000i = 4320
2Y= 4320 + 12000i
Y = 2160 + 6000i
The new equilibrium values can be estimated by equating the revised LM curve with the
originally derived IS curve as shown below.
2400 – 3000i = 2160+6000i
Solving the above, we get i = 0.0267 or 2.67%
For i =0.0267, Y= 2160 + 6000*0.0267 = 2320 million
Hence, new equilibrium output is 2320 million and equilibrium interest rate is 2.67%.
⊘ This is a preview!⊘
Do you want full access?
Subscribe today to unlock all pages.
Trusted by 1+ million students worldwide
C = 400 + 0.25(2320-400) = 880 million
I = 300 + 0.25*2320 – 1500*0.0267 = 840 million
From the above computations, it is apparent that increased real money supply has led to lower
interest rate which has dropped from 10% to 2.67%. This has resulted in a boost to the
economy considering that consumption and investment have increased leading to higher
output at 2320 million.
f) In this scenario, there is an increase in the government spending. This would lead to an
alteration in the LS curve and hence an increase in the equilibrium interest rate. The higher
government spending would also provide a boost to the output which would also increase.
This would enable an increase in consumption and investment in the medium to long run
as the government spending would lead to an economic stimulus as highlighted in
Keynesian economics.
PART C
1) The given statement is true as the multiplier for government spending is greater than the
corresponding multiplier for tax. The impact on equilibrium output is highlighted below.
Change in equilibrium output = Multiplier factor * Change in factor value
With regards to government spending multiplier, it is equal to 1/(1-MPC) where MPC is the
marginal propensity to consumer. The tax multiplier has a value equal to MPC/(1-MPC). It is
evident that the tax multiple is lower considering the fact that MPC lies between 0 and 1. The
impact of government spending therefore is more profound on the aggregate demand as
captured through the IS curve in comparison to tax cuts.
2) In the globalised world, there is an increasing trend for government and companies to
borrow from abroad especially if the interest rates are lower. Typically the domestic
interest rates are determined by the demand and supply of money which is regulated by the
monetary policy. However, in order for the monetary policy to be effective, it is essential
to have capital controls in place. This is required in order to ensure that the central bank
can have reasonable control on the money demand and supply. One of the key tools used
by central banks globally is open market operations which are used to manage liquidity.
However, in absence of capital controls these would fail to have desired impact owing to
presence of foreign capital in abundance considering that it can be withdrawn at any time.
Hence, if there is limited money supply leading to higher interest, foreign money inflow
into the nation would increase to capitalise on higher interest earnings leading to increased
money supply and normalisation. An opposite effect could happen in case of excess
liquidity in the system. As a result, the true cost of financing is determined not by the
monetary policy but by the international financial markets.
The levying of capital controls is considered to be prudent to some extent as has been
highlighted the Asian financial crisis during 1997-1998. Capital controls ensure that there is
no sudden capital flight and ensures that the domestic economy is more resilient to global
shocks and related crisis. Capital controls ensure that domestic capital is readily available in
domestic markets rather than being invested in foreign assets or financial markets which
helps in keeping the interest rate low. Also, these controls allow for prudent macroeconomic
policy based on domestic needs.
3) The requisite time period plot for the nominal exchange rate of Yen/USD is shown below.
Paraphrase This Document
Need a fresh take? Get an instant paraphrase of this document with our AI Paraphraser
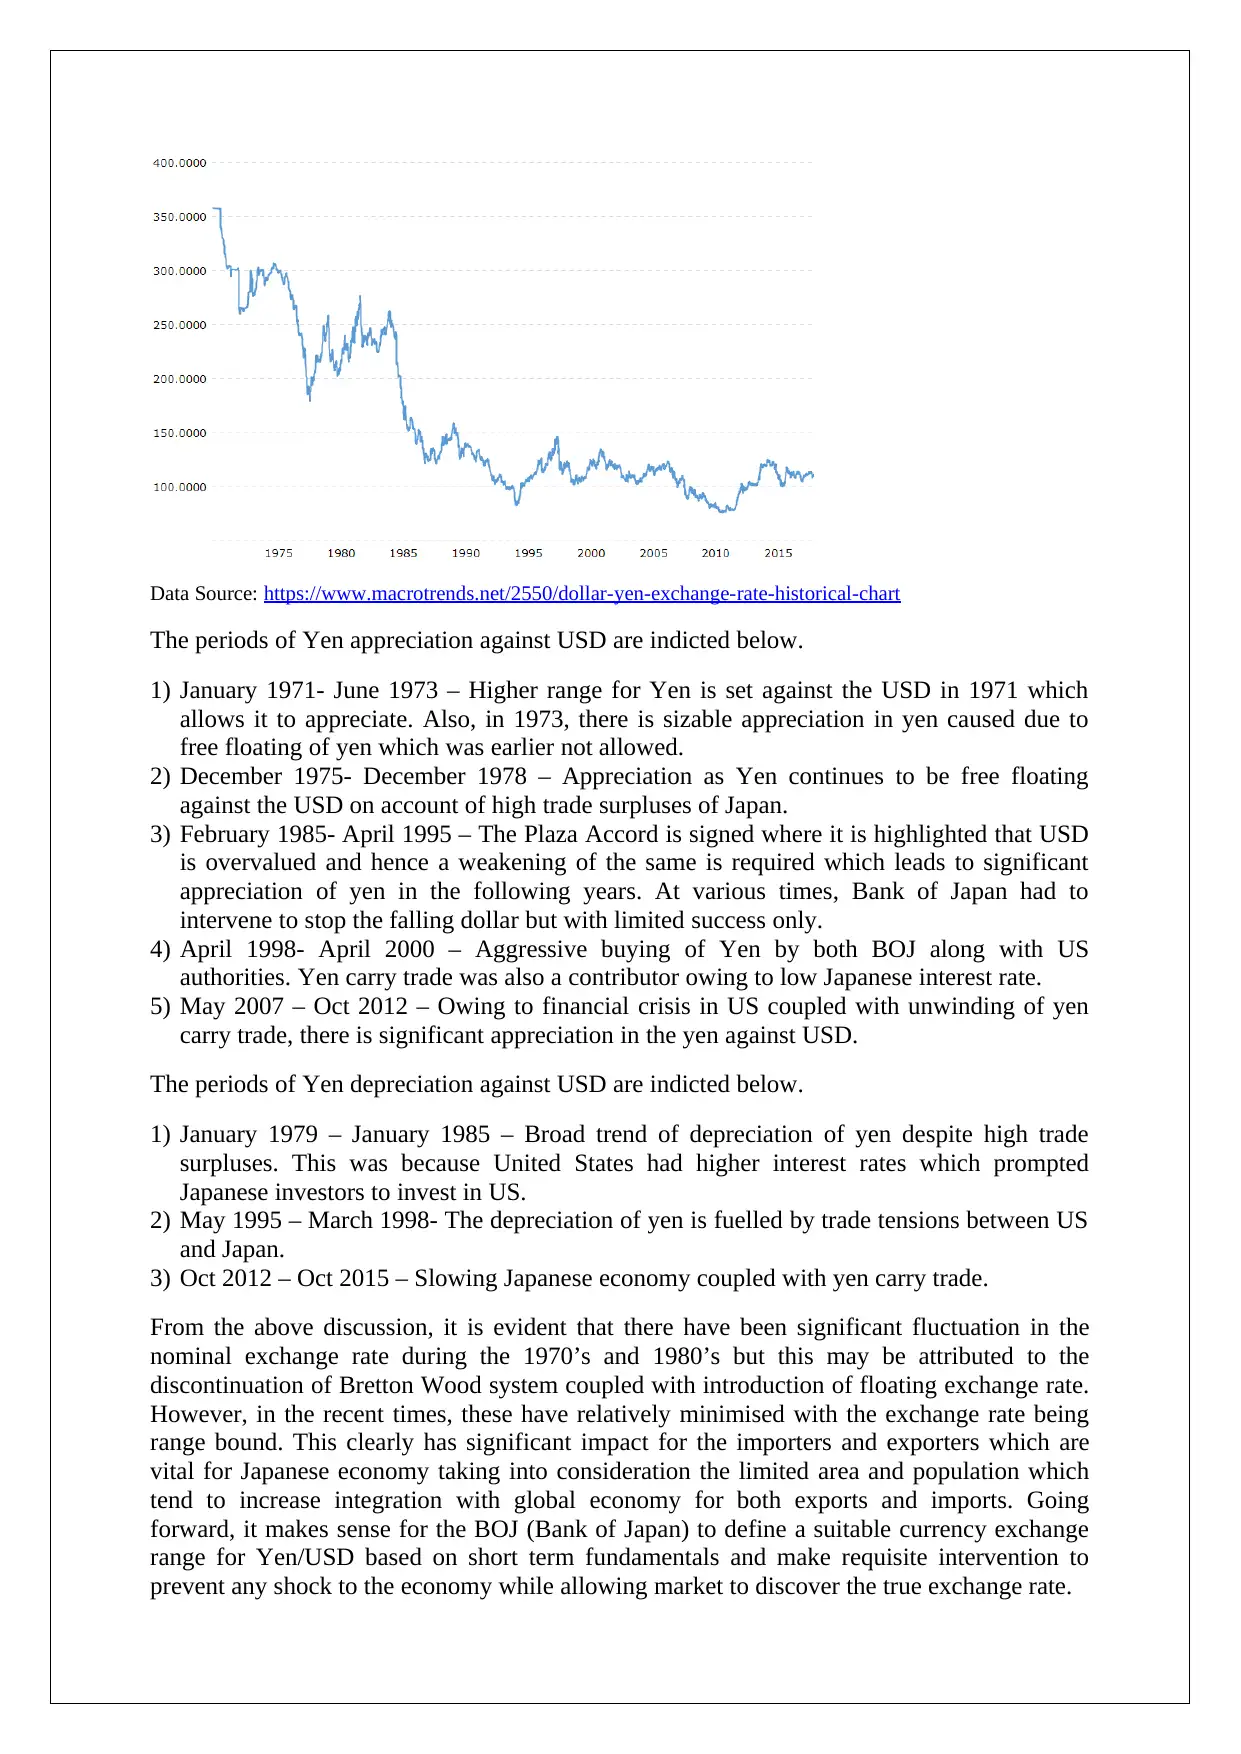
Data Source: https://www.macrotrends.net/2550/dollar-yen-exchange-rate-historical-chart
The periods of Yen appreciation against USD are indicted below.
1) January 1971- June 1973 – Higher range for Yen is set against the USD in 1971 which
allows it to appreciate. Also, in 1973, there is sizable appreciation in yen caused due to
free floating of yen which was earlier not allowed.
2) December 1975- December 1978 – Appreciation as Yen continues to be free floating
against the USD on account of high trade surpluses of Japan.
3) February 1985- April 1995 – The Plaza Accord is signed where it is highlighted that USD
is overvalued and hence a weakening of the same is required which leads to significant
appreciation of yen in the following years. At various times, Bank of Japan had to
intervene to stop the falling dollar but with limited success only.
4) April 1998- April 2000 – Aggressive buying of Yen by both BOJ along with US
authorities. Yen carry trade was also a contributor owing to low Japanese interest rate.
5) May 2007 – Oct 2012 – Owing to financial crisis in US coupled with unwinding of yen
carry trade, there is significant appreciation in the yen against USD.
The periods of Yen depreciation against USD are indicted below.
1) January 1979 – January 1985 – Broad trend of depreciation of yen despite high trade
surpluses. This was because United States had higher interest rates which prompted
Japanese investors to invest in US.
2) May 1995 – March 1998- The depreciation of yen is fuelled by trade tensions between US
and Japan.
3) Oct 2012 – Oct 2015 – Slowing Japanese economy coupled with yen carry trade.
From the above discussion, it is evident that there have been significant fluctuation in the
nominal exchange rate during the 1970’s and 1980’s but this may be attributed to the
discontinuation of Bretton Wood system coupled with introduction of floating exchange rate.
However, in the recent times, these have relatively minimised with the exchange rate being
range bound. This clearly has significant impact for the importers and exporters which are
vital for Japanese economy taking into consideration the limited area and population which
tend to increase integration with global economy for both exports and imports. Going
forward, it makes sense for the BOJ (Bank of Japan) to define a suitable currency exchange
range for Yen/USD based on short term fundamentals and make requisite intervention to
prevent any shock to the economy while allowing market to discover the true exchange rate.
1 out of 5

Your All-in-One AI-Powered Toolkit for Academic Success.
+13062052269
info@desklib.com
Available 24*7 on WhatsApp / Email
![[object Object]](/_next/static/media/star-bottom.7253800d.svg)
Unlock your academic potential
Copyright © 2020–2026 A2Z Services. All Rights Reserved. Developed and managed by ZUCOL.