Numerical Applications of Macroeconomics - Assignment 2, ECON 2103A

Verified

Added on  2022/11/14

|22
|2538
|305
Homework Assignment
AI Summary
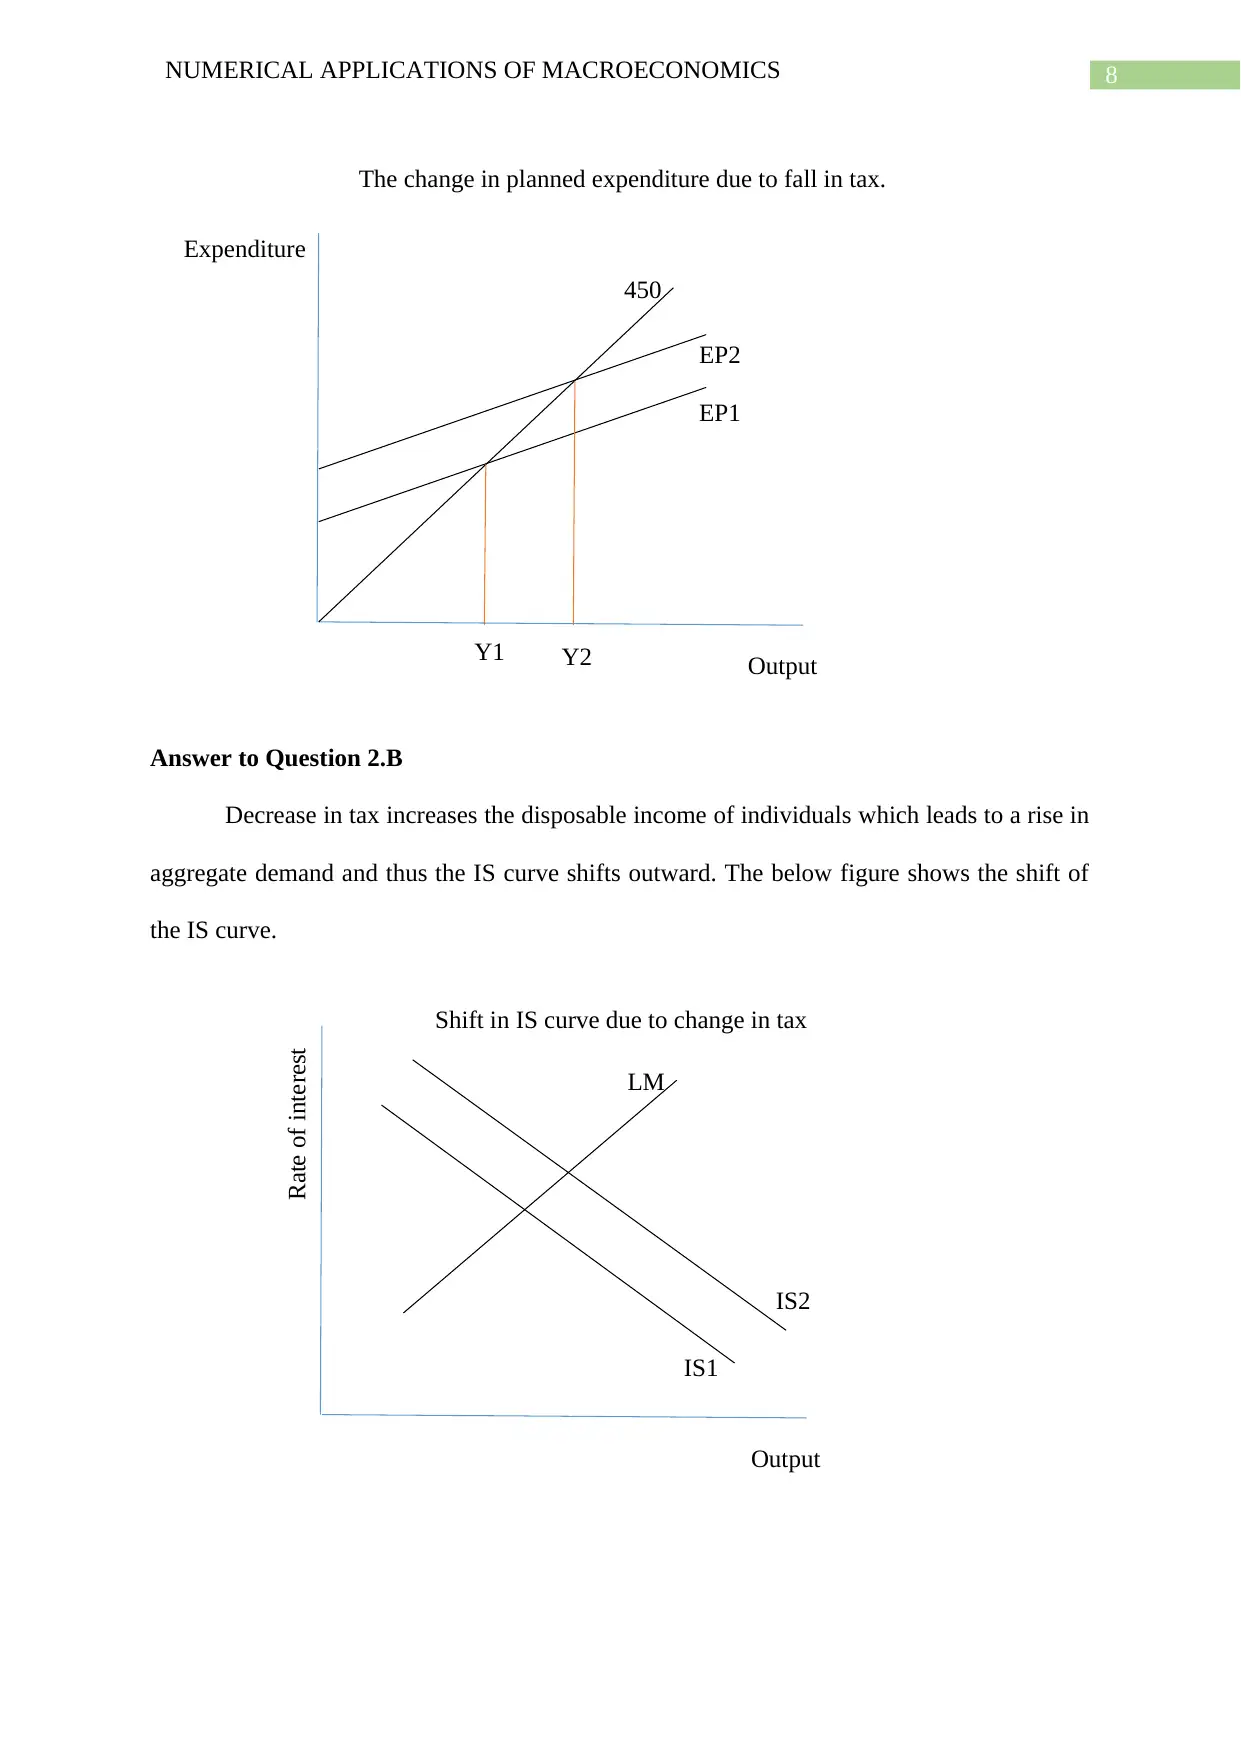
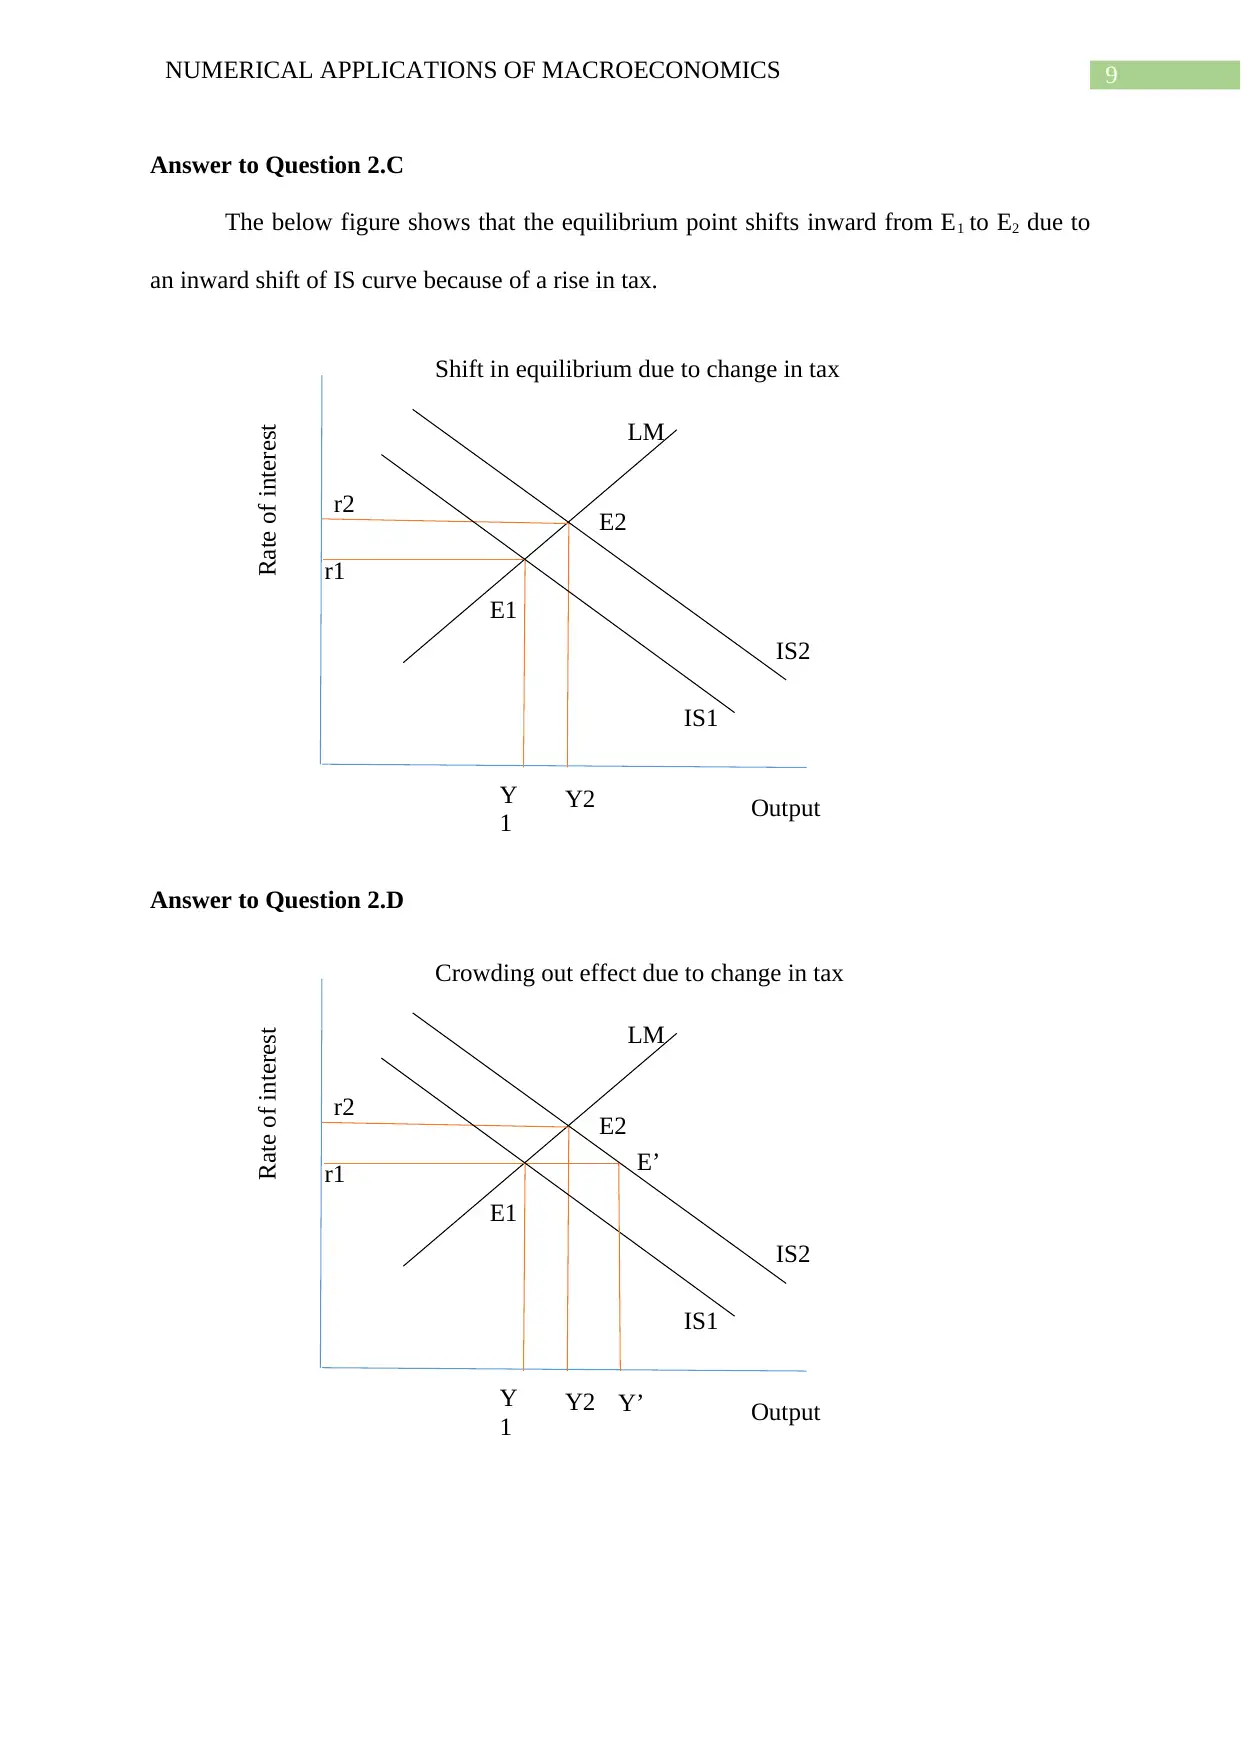
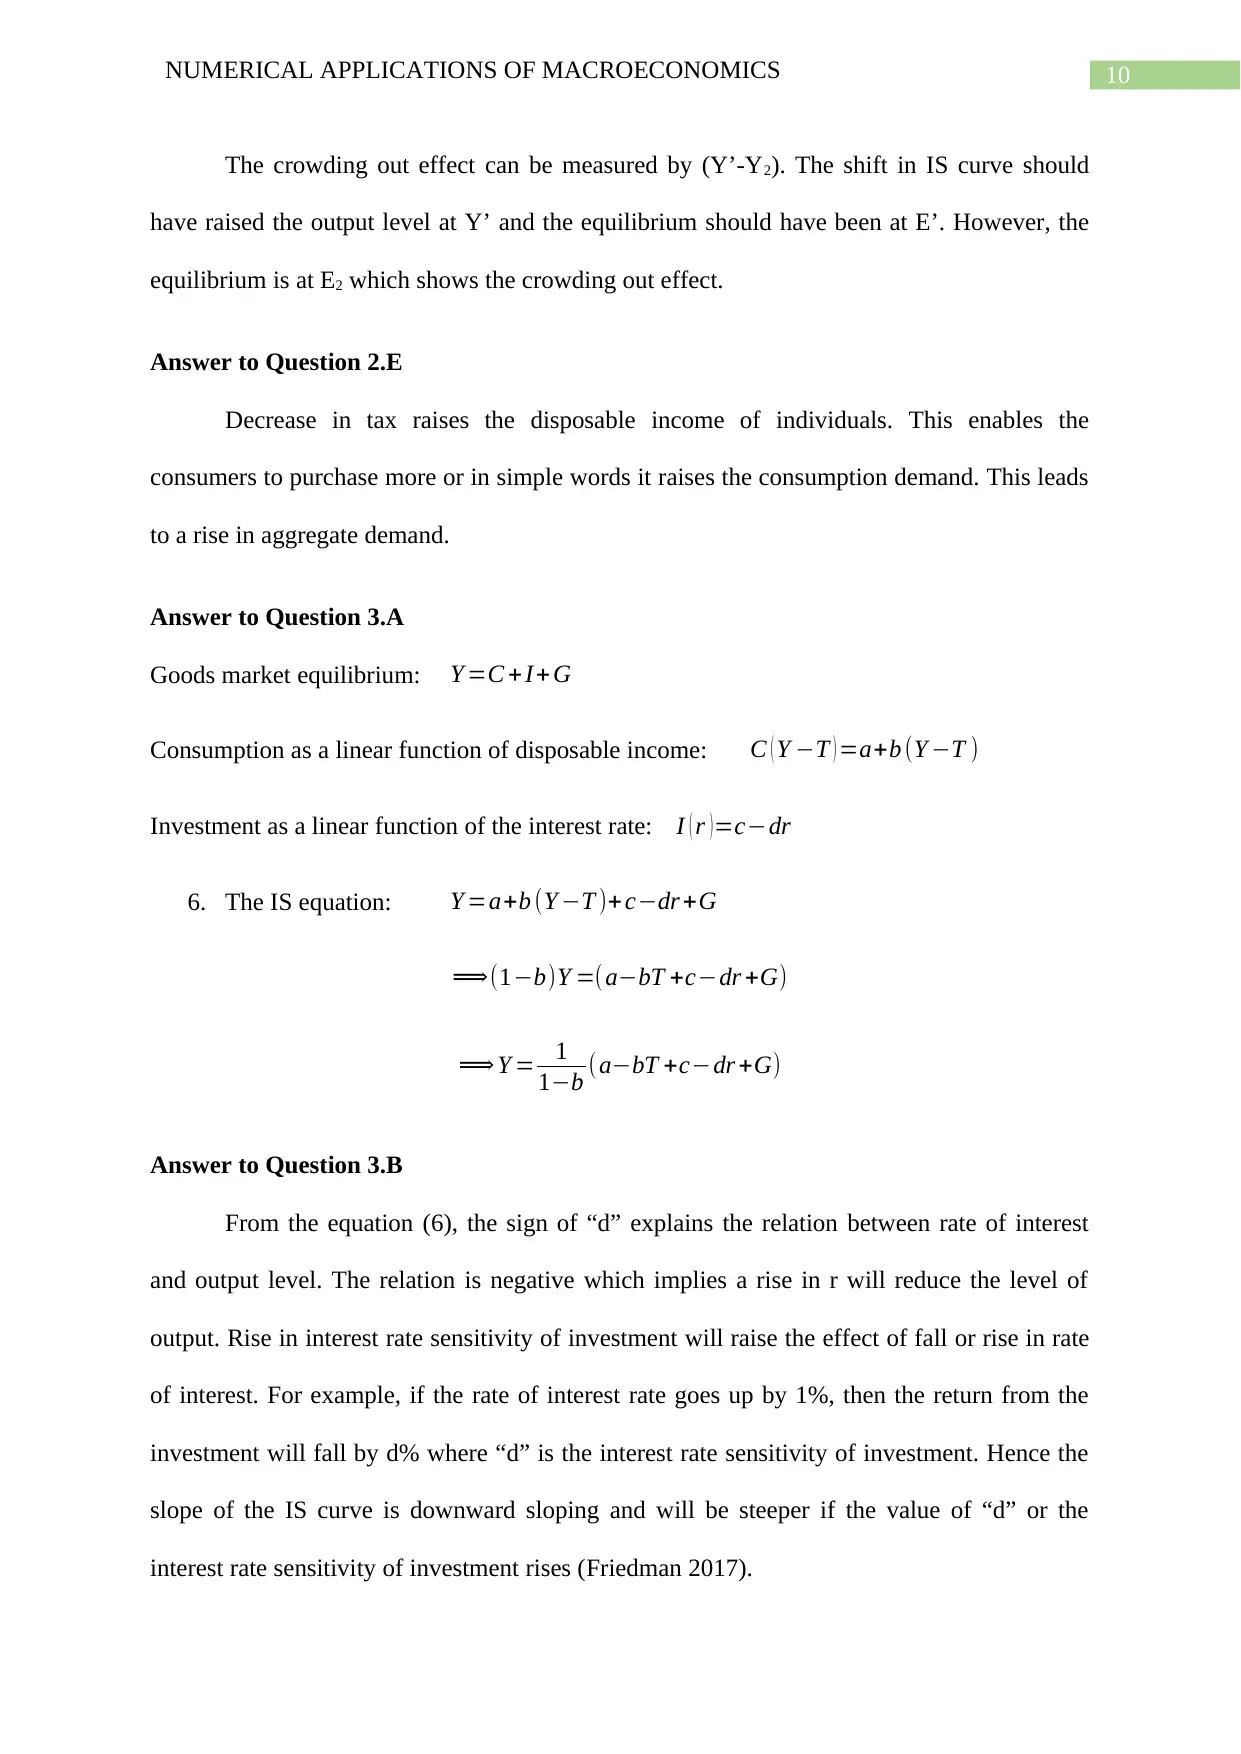
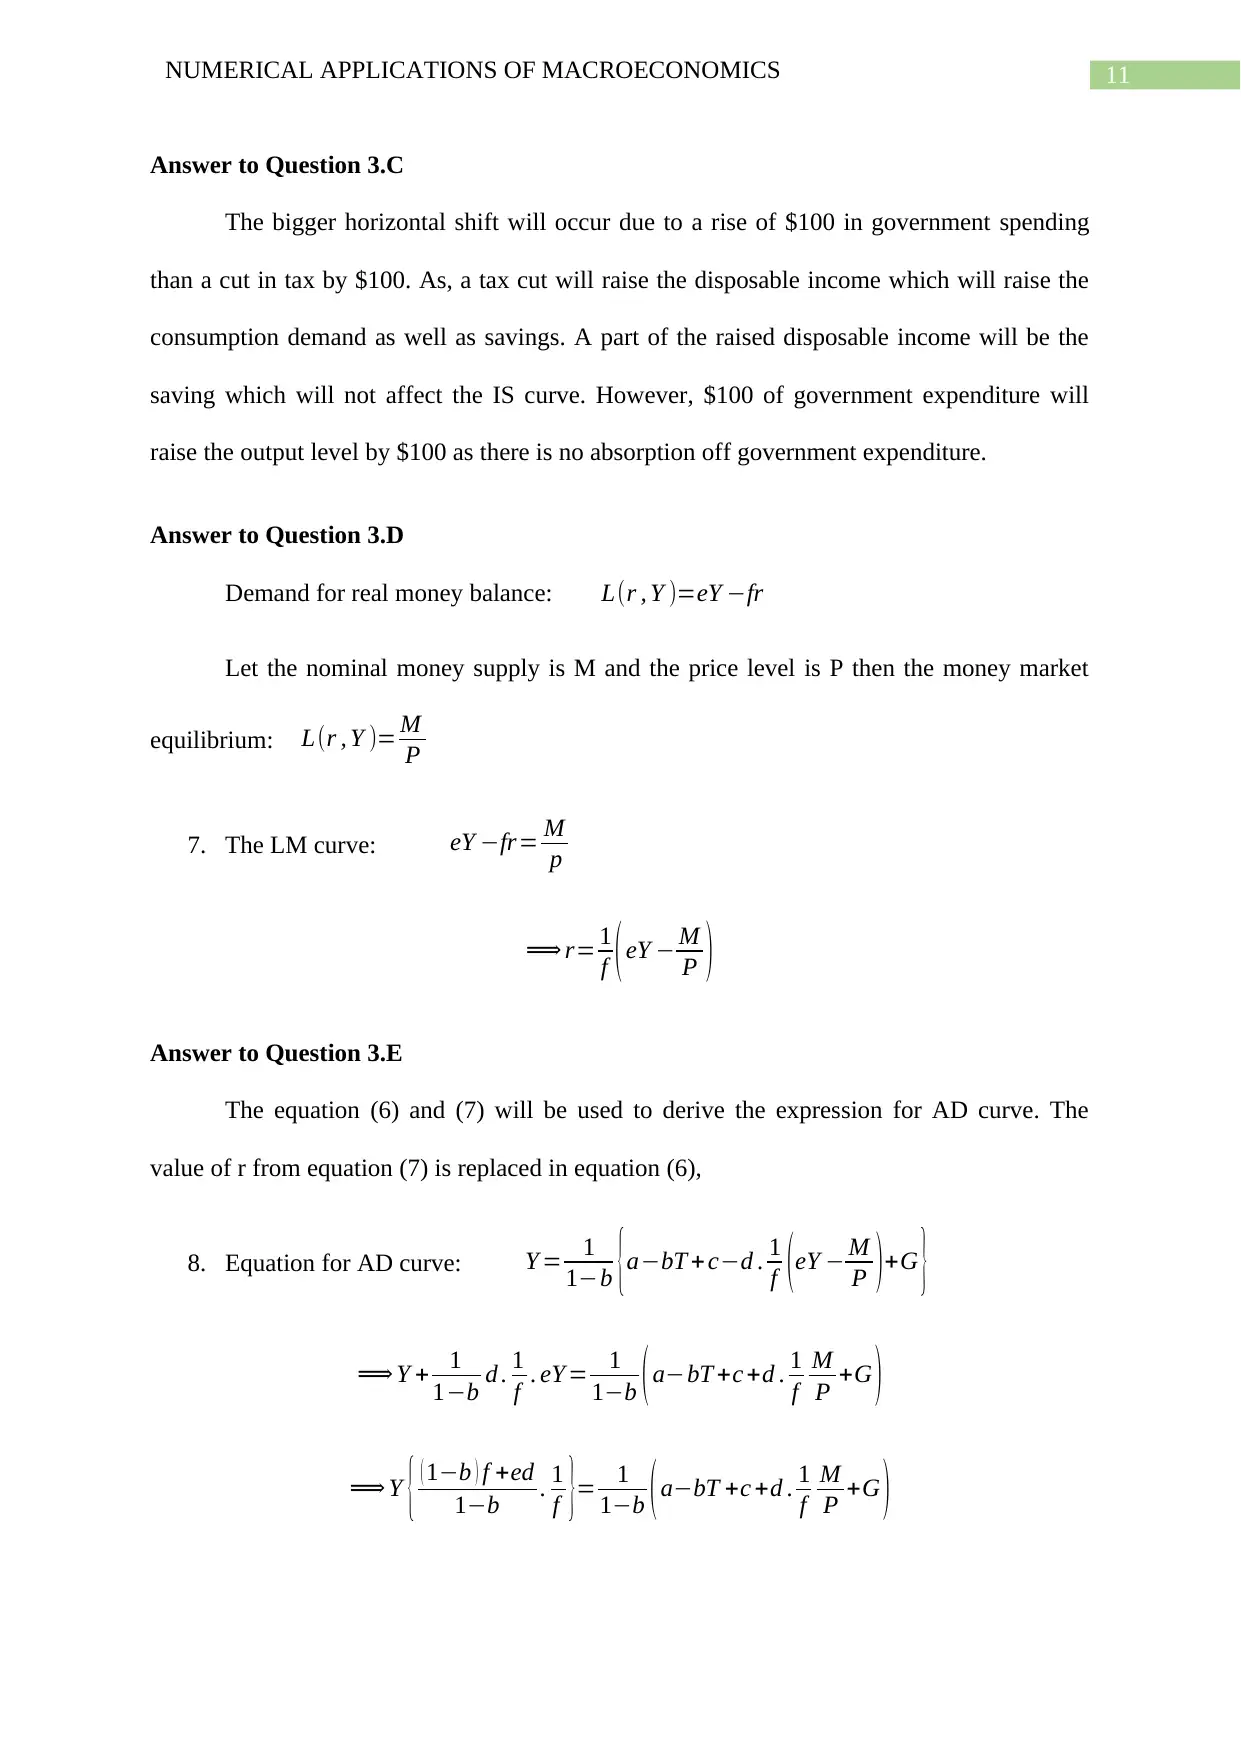
This document presents a comprehensive solution to a macroeconomics assignment (ECON 2103A), addressing key concepts in aggregate demand and supply, monetary and fiscal policy, and the application of IS-LM and Phillips curve models. The solution meticulously answers questions on topics including goods and money market equilibrium, the effects of tax changes on the IS curve, and the crowding-out effect. It further explores the relationship between interest rates, investment sensitivity, and output. The assignment delves into the effects of monetary policy, including the impact of central bank actions on money supply, interest rates, and the aggregate demand-aggregate supply model in both the short run and the long run. The solution provides detailed explanations, graphical representations, and numerical calculations to illustrate the economic principles discussed, offering a thorough understanding of macroeconomic concepts. The assignment also explores the effects of the Phillips curve, the relationship between inflation and unemployment, and the implications of policy changes on these economic variables.
Document Page
Running head: NUMERICAL APPLICATIONS OF MACROECONOMICS
Numerical Applications of Macroeconomics
Name of the Student:
Name of the University:
Author Note:
tabler-icon-diamond-filled.svg

Paraphrase This Document

Need a fresh take? Get an instant paraphrase of this document with our AI Paraphraser
Document Page
1NUMERICAL APPLICATIONS OF MACROECONOMICS
Table of Contents
Answer to Question 1.................................................................................................................3
Answer to Question 1.A.............................................................................................................3
Answer to Question 1.B.............................................................................................................4
Answer to Question 1.C.............................................................................................................6
Answer to Question 1.D.............................................................................................................7
Answer to Question 2.A.............................................................................................................7
Answer to Question 2.B.............................................................................................................8
Answer to Question 2.C.............................................................................................................9
Answer to Question 2.D.............................................................................................................9
Answer to Question 2.E...........................................................................................................10
Answer to Question 3.A...........................................................................................................10
Answer to Question 3.B...........................................................................................................10
Answer to Question 3.C...........................................................................................................11
Answer to Question 3.D...........................................................................................................11
Answer to Question 3.E...........................................................................................................11
Answer to Question 3.F............................................................................................................12
Answer to Question 4.A...........................................................................................................12
Answer to Question 4.B...........................................................................................................12
Answer to Question 4.C...........................................................................................................13
Answer to Question 4.D...........................................................................................................14
Answer to Question 5.A...........................................................................................................14
Document Page
2NUMERICAL APPLICATIONS OF MACROECONOMICS
Answer to Question 5.B...........................................................................................................16
Answer to Question 6...............................................................................................................17
Answer to Question 6.A...........................................................................................................18
Answer to Question 6.B...........................................................................................................19
Answer to Question 6.C...........................................................................................................19
Reference..................................................................................................................................21
Document Page
3NUMERICAL APPLICATIONS OF MACROECONOMICS
Answer to Question 1
The model of a closed economy:
C=250+0.75 (Y T )
I =60050 r
G=325
T =100
PE=C + I +G
M d
P =1.5 Y 60 r
M s=3000
P=1
Answer to Question 1.A
Goods market equilibrium: Y =PE
Y =C + I+G
Y =250+0.75(Y T )+60050 r +325
Y 0.75 Y =2500.75 (100)+60050 r +325
0.25 Y +50 r=1100
1. IS equation: Y +200 r=44 00
Money market equilibrium: Md
P = M s
P
tabler-icon-diamond-filled.svg

Paraphrase This Document

Need a fresh take? Get an instant paraphrase of this document with our AI Paraphraser
Document Page
4NUMERICAL APPLICATIONS OF MACROECONOMICS
1.5Y 60 r= 3000
1
2. LM equation: Y 40 r=20 00
Solving the IS and LM curve, the equilibrium output and rate of interest is obtained.
Replacing the value of Y from LM equation in to the IS equation,
40 r + 2000+ 200 r=44 00
r=1 0
Replacing the value of r in IS model:
Y +20010=44 00
Y =44 002000
Y =24 00
The equilibrium output, Y is 2400 and the rate of interest, r is 10.
Answer to Question 1.B
Goods market equilibrium: Y =PE
Y =C + I+G
Y =250+0.75(Y T )+60050 r +325
Y 0.75 Y =2500.75 (250)+60050 r +325
0.25 Y +50 r=987.5
3. IS equation: Y +200 r=3950
Money market equilibrium: Md
P = M s
P
Document Page
5NUMERICAL APPLICATIONS OF MACROECONOMICS
1.5Y 60 r= 3000
1
4. LM equation: Y 40 r=20 00
Solving the IS and LM curve, the equilibrium output and rate of interest is obtained.
Replacing the value of Y from LM equation in to the IS equation,
40 r + 2000+200 r=3950
r=8.125
Replacing the value of r in IS model:
Y +2008.125=3950
Y =39501625
Y =2325
The equilibrium output, Y is 2325 and the rate of interest, r is 8.125.
Increase in tax reduces the disposable income of individuals which leads to a
reduction in aggregate demand and thus the IS curve shifts inward (Fontana and Setterfield
2016). The below figure shows the shift of the IS curve.
Document Page
6NUMERICAL APPLICATIONS OF MACROECONOMICS
Answer to Question 1.C
The initial output, Y is 2400. Now, the rate of interest at this level of output can be
determined from the IS curve,
2400+200 r =3950
r= 1550
200 =7.75
The rate of interest will fall below than the initial rate of interest (r=10) and also the
below the rate of interest (r=8.125) before imposition of the monetary policy.
The monetary policy is taken to raise the money supply with the constant demand and
liquidity preference, the rate of interest rate will fall and the LM curve will shift rightward.
The increase in money supply, state of liquidity preference or demand for money
remaining unchanged, will lead to the fall in rate of interest.
tabler-icon-diamond-filled.svg

Paraphrase This Document

Need a fresh take? Get an instant paraphrase of this document with our AI Paraphraser
Document Page
7NUMERICAL APPLICATIONS OF MACROECONOMICS
Answer to Question 1.D
The new output level, Y is 2400 and rate of interest, r is 7.75. Now, the demand for
money is calculated which is equal to the money supply in the equilibrium.
M d
P =1.52400607.75=3135
M s
P =M s= M d
P =3135
Hence, the new money supply is 3135 and the previous money supply is 3000. Hence, the
increased money supply is 135.
Answer to Question 2.A
5. The planned expenditure can be explained by the following equation:
EP=C (Y T )+ I P +G+NX
EP =a+ b ( Y T )+ IP +G+ NX
EP =a+bY bT + IP +G+ NX
Now, MPC=b=0.75 and the present tax is reduced by 100 units:
EP=a+bY 0.75(T 100)+I P +G+ NX
The planned expenditure will rise by ( 0.75100 )=75 units.
The disposable income will rise by 100 units.
The change in planned expenditure is shown by the shift in planned expenditure curve
from EP1 to EP2 in the below diagram with the help of Keynesian Cross model:
Document Page
8NUMERICAL APPLICATIONS OF MACROECONOMICS
Output
Expenditure
EP2
450
EP1
Y1 Y2
The change in planned expenditure due to fall in tax.
Output
Rate of interest
IS2
LM
IS1
Shift in IS curve due to change in tax
Answer to Question 2.B
Decrease in tax increases the disposable income of individuals which leads to a rise in
aggregate demand and thus the IS curve shifts outward. The below figure shows the shift of
the IS curve.
Document Page
9NUMERICAL APPLICATIONS OF MACROECONOMICS
Output
Rate of interest
IS2
LM
IS1
Y
1 Y2
Shift in equilibrium due to change in tax
r1
r2
E1
E2
Output
Rate of interest
IS2
LM
IS1
Y
1 Y2
Crowding out effect due to change in tax
r1
r2
E1
E2
E’
Y’
Answer to Question 2.C
The below figure shows that the equilibrium point shifts inward from E1 to E2 due to
an inward shift of IS curve because of a rise in tax.
Answer to Question 2.D
tabler-icon-diamond-filled.svg

Paraphrase This Document

Need a fresh take? Get an instant paraphrase of this document with our AI Paraphraser
Document Page
10NUMERICAL APPLICATIONS OF MACROECONOMICS
The crowding out effect can be measured by (Y’-Y2). The shift in IS curve should
have raised the output level at Y’ and the equilibrium should have been at E’. However, the
equilibrium is at E2 which shows the crowding out effect.
Answer to Question 2.E
Decrease in tax raises the disposable income of individuals. This enables the
consumers to purchase more or in simple words it raises the consumption demand. This leads
to a rise in aggregate demand.
Answer to Question 3.A
Goods market equilibrium: Y =C +I+ G
Consumption as a linear function of disposable income: C ( Y T ) =a+b (Y T )
Investment as a linear function of the interest rate: I ( r )=cdr
6. The IS equation: Y =a+b (Y T )+ cdr +G
(1b)Y =(abT +cdr +G)
Y = 1
1b (abT +cdr +G)
Answer to Question 3.B
From the equation (6), the sign of “d” explains the relation between rate of interest
and output level. The relation is negative which implies a rise in r will reduce the level of
output. Rise in interest rate sensitivity of investment will raise the effect of fall or rise in rate
of interest. For example, if the rate of interest rate goes up by 1%, then the return from the
investment will fall by d% where “d” is the interest rate sensitivity of investment. Hence the
slope of the IS curve is downward sloping and will be steeper if the value of “d” or the
interest rate sensitivity of investment rises (Friedman 2017).
Document Page
11NUMERICAL APPLICATIONS OF MACROECONOMICS
Answer to Question 3.C
The bigger horizontal shift will occur due to a rise of $100 in government spending
than a cut in tax by $100. As, a tax cut will raise the disposable income which will raise the
consumption demand as well as savings. A part of the raised disposable income will be the
saving which will not affect the IS curve. However, $100 of government expenditure will
raise the output level by $100 as there is no absorption off government expenditure.
Answer to Question 3.D
Demand for real money balance: L(r , Y )=eY fr
Let the nominal money supply is M and the price level is P then the money market
equilibrium: L(r , Y )= M
P
7. The LM curve: eY fr= M
p
r= 1
f (eY M
P )
Answer to Question 3.E
The equation (6) and (7) will be used to derive the expression for AD curve. The
value of r from equation (7) is replaced in equation (6),
8. Equation for AD curve: Y = 1
1b {abT + cd . 1
f (eY M
P )+G }
Y + 1
1b d . 1
f . eY = 1
1b (abT +c +d . 1
f
M
P +G )
Y { ( 1b ) f +ed
1b . 1
f }= 1
1b (abT +c +d . 1
f
M
P +G )
chevron_up_icon
1 out of 22
circle_padding
hide_on_mobile
zoom_out_icon
[object Object]