University Economics Project 1: Macroeconomic Analysis and Evaluation

Verified

Added on  2020/07/23

|8
|1220
|27
Homework Assignment
AI Summary
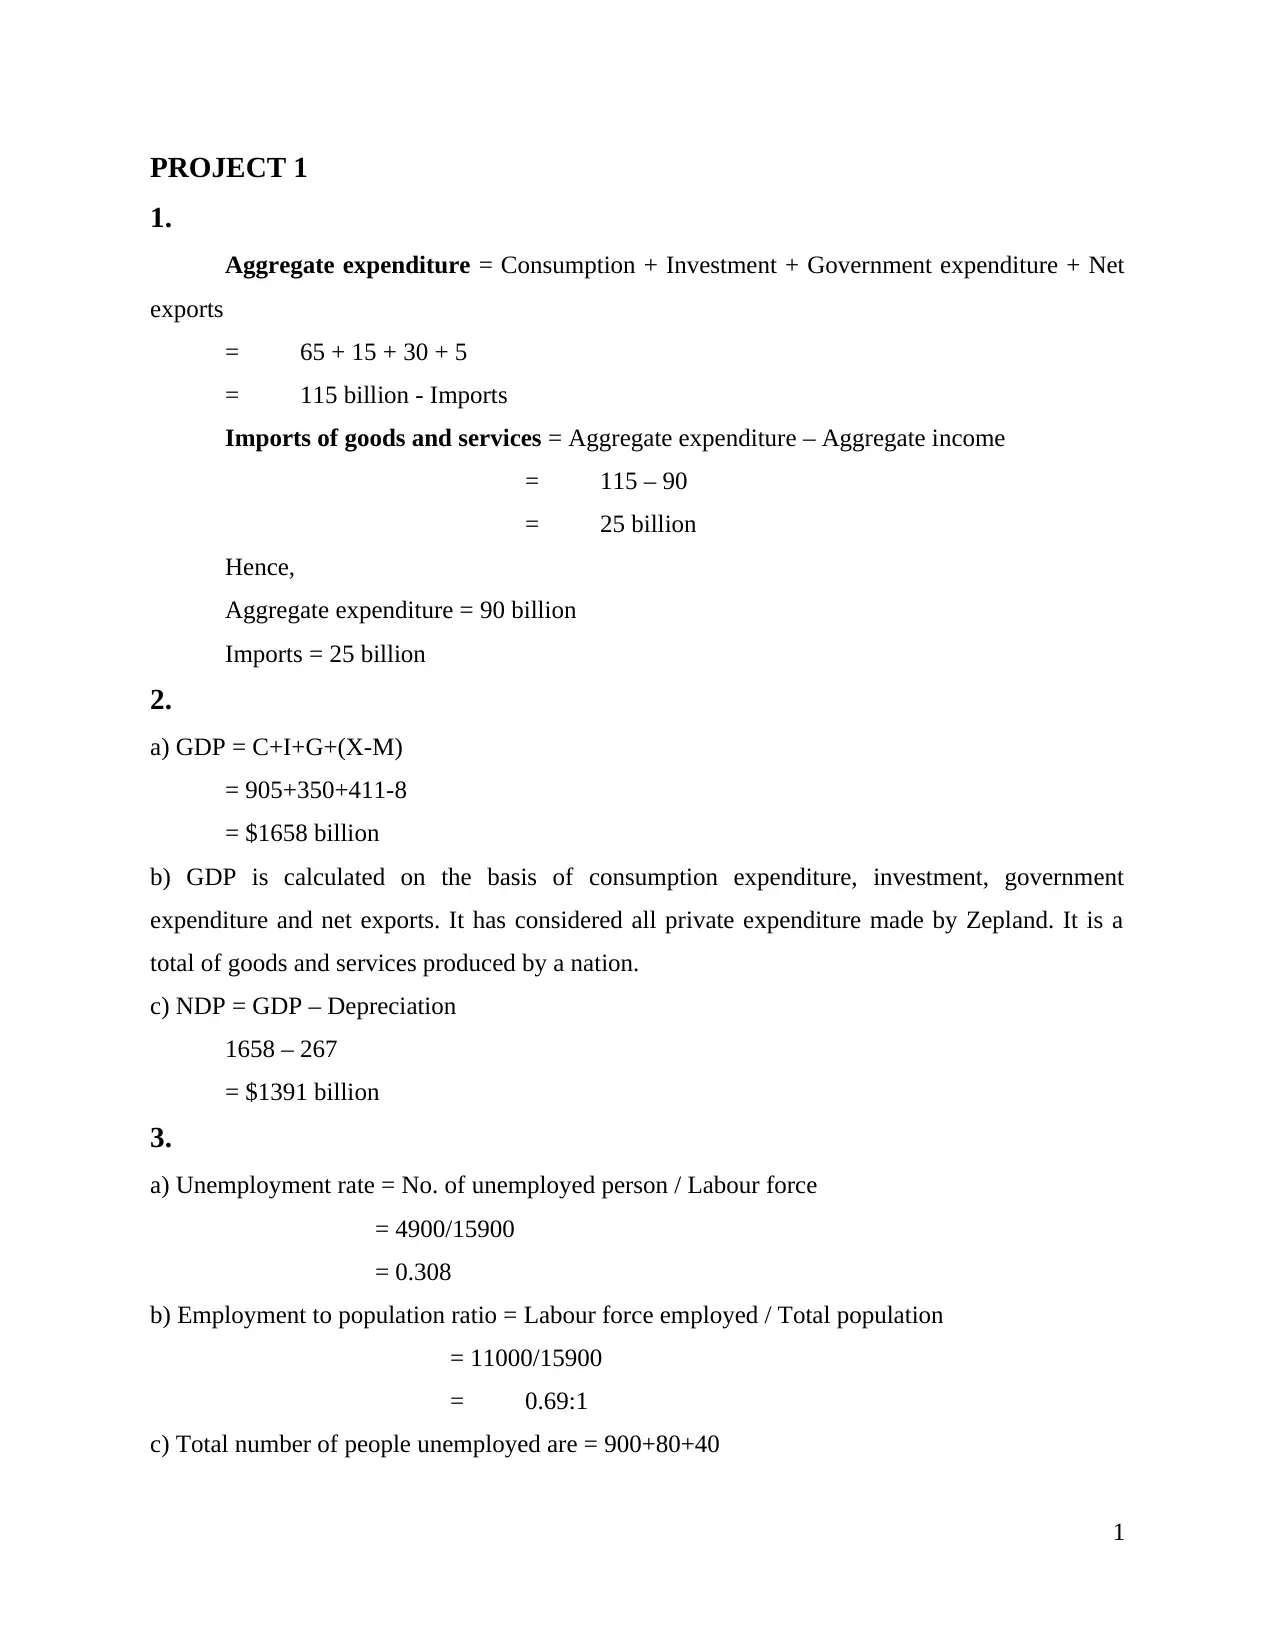
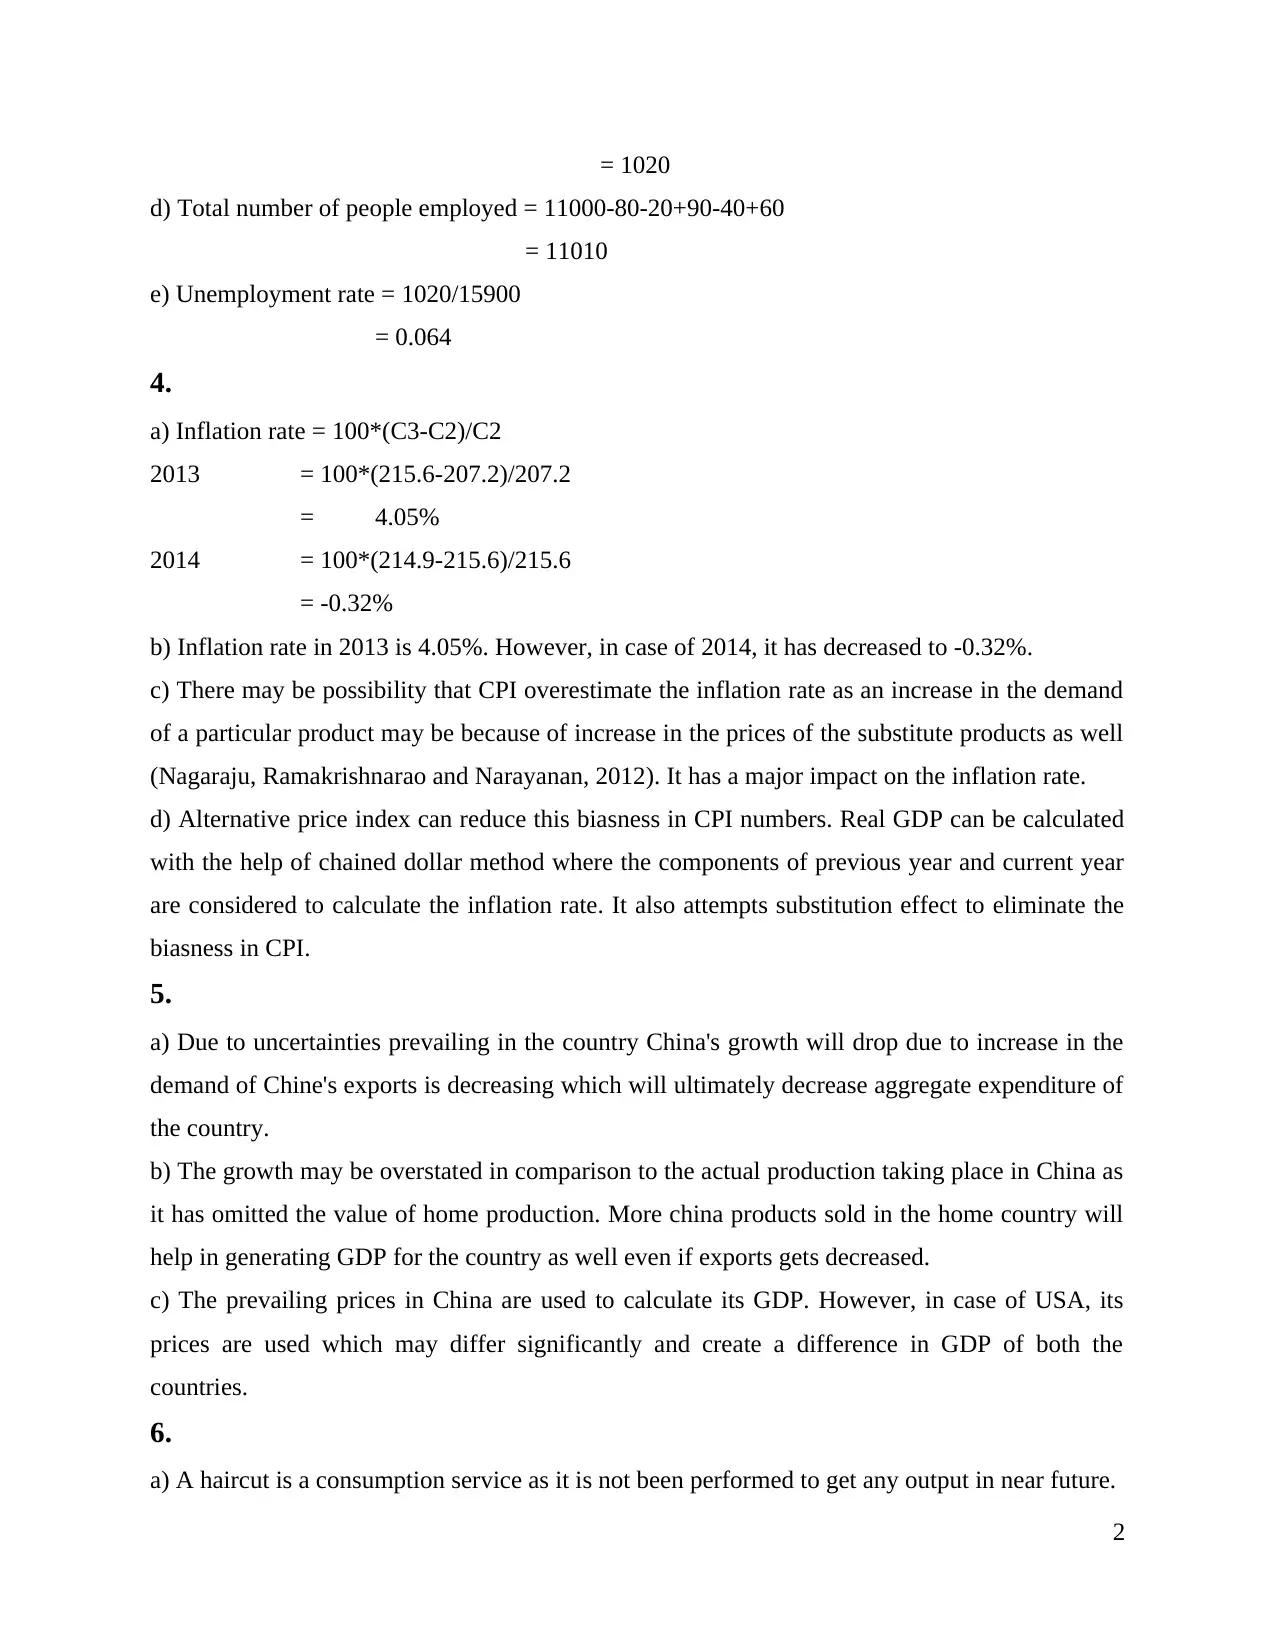
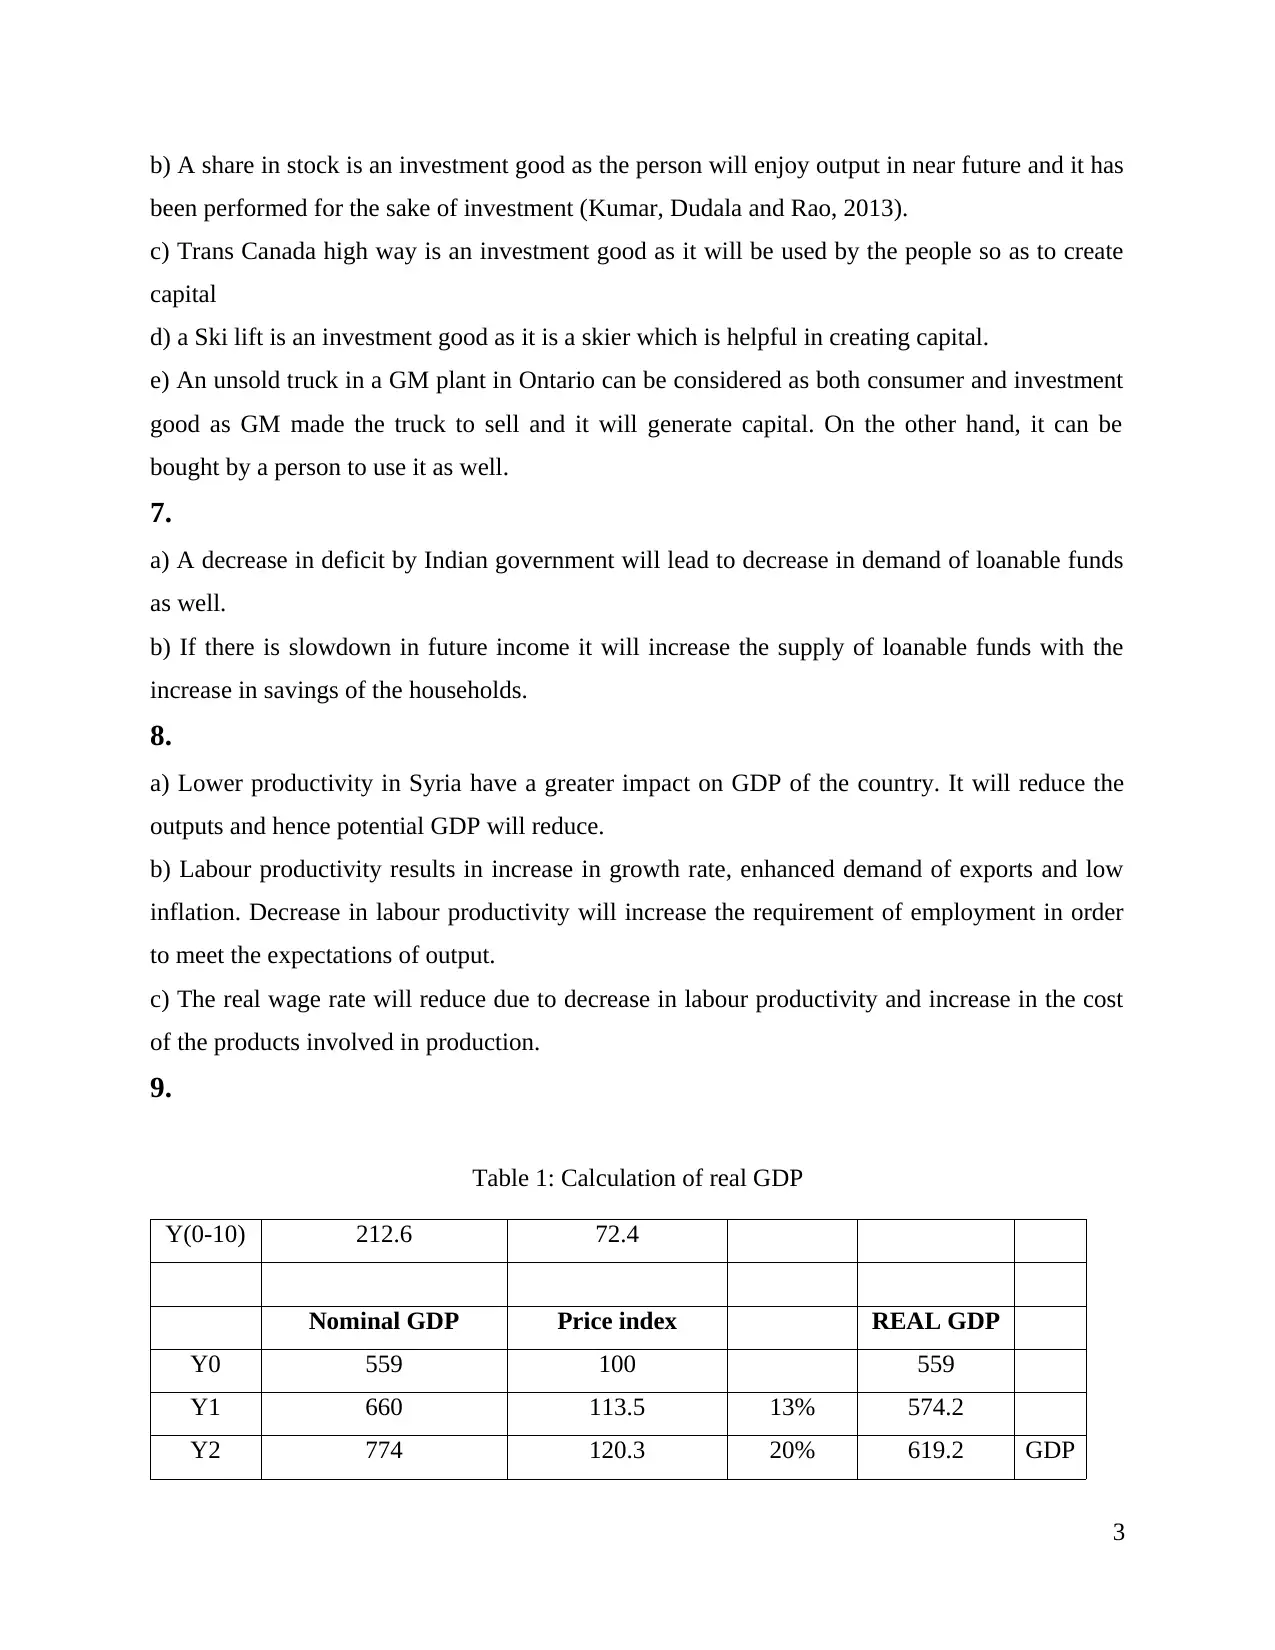
This project delves into macroeconomic analysis, covering key concepts such as aggregate expenditure, GDP calculation (including nominal and real GDP), and the calculation of inflation rates. It examines the impact of various economic factors, including changes in government deficits, productivity, and international trade, on macroeconomic indicators. The project addresses questions related to unemployment rates, the distinction between investment and consumption goods, and the dynamics of the loanable funds market. It includes calculations of inflation rates for different years and discusses potential biases in the Consumer Price Index (CPI). Additionally, the project explores how factors such as China's economic growth and changes in savings and investment impact interest rates. The analysis incorporates tables and graphical illustrations to support the findings and draws upon academic sources for reference.
tabler-icon-diamond-filled.svg

Contribute Materials

Your contribution can guide someone’s learning journey. Share your documents today.
Document Page
ASSIGNMENTS
tabler-icon-diamond-filled.svg

Secure Best Marks with AI Grader

Need help grading? Try our AI Grader for instant feedback on your assignments.
Document Page
Table of Contents
PROJECT 1......................................................................................................................................1
1........................................................................................................................................................1
2........................................................................................................................................................1
3........................................................................................................................................................1
4........................................................................................................................................................2
5........................................................................................................................................................2
6........................................................................................................................................................2
7........................................................................................................................................................3
8........................................................................................................................................................3
9. ......................................................................................................................................................3
10......................................................................................................................................................4
REFERENCES................................................................................................................................5
Document Page
Illustration Index
Illustration 1: Investment and interest rate.......................................................................................4
Index of Tables
Table 1: Calculation of real GDP.....................................................................................................3
Document Page
PROJECT 1
1.
Aggregate expenditure = Consumption + Investment + Government expenditure + Net
exports
= 65 + 15 + 30 + 5
= 115 billion - Imports
Imports of goods and services = Aggregate expenditure – Aggregate income
= 115 – 90
= 25 billion
Hence,
Aggregate expenditure = 90 billion
Imports = 25 billion
2.
a) GDP = C+I+G+(X-M)
= 905+350+411-8
= $1658 billion
b) GDP is calculated on the basis of consumption expenditure, investment, government
expenditure and net exports. It has considered all private expenditure made by Zepland. It is a
total of goods and services produced by a nation.
c) NDP = GDP – Depreciation
1658 – 267
= $1391 billion
3.
a) Unemployment rate = No. of unemployed person / Labour force
= 4900/15900
= 0.308
b) Employment to population ratio = Labour force employed / Total population
= 11000/15900
= 0.69:1
c) Total number of people unemployed are = 900+80+40
1
tabler-icon-diamond-filled.svg

Secure Best Marks with AI Grader

Need help grading? Try our AI Grader for instant feedback on your assignments.
Document Page
= 1020
d) Total number of people employed = 11000-80-20+90-40+60
= 11010
e) Unemployment rate = 1020/15900
= 0.064
4.
a) Inflation rate = 100*(C3-C2)/C2
2013 = 100*(215.6-207.2)/207.2
= 4.05%
2014 = 100*(214.9-215.6)/215.6
= -0.32%
b) Inflation rate in 2013 is 4.05%. However, in case of 2014, it has decreased to -0.32%.
c) There may be possibility that CPI overestimate the inflation rate as an increase in the demand
of a particular product may be because of increase in the prices of the substitute products as well
(Nagaraju, Ramakrishnarao and Narayanan, 2012). It has a major impact on the inflation rate.
d) Alternative price index can reduce this biasness in CPI numbers. Real GDP can be calculated
with the help of chained dollar method where the components of previous year and current year
are considered to calculate the inflation rate. It also attempts substitution effect to eliminate the
biasness in CPI.
5.
a) Due to uncertainties prevailing in the country China's growth will drop due to increase in the
demand of Chine's exports is decreasing which will ultimately decrease aggregate expenditure of
the country.
b) The growth may be overstated in comparison to the actual production taking place in China as
it has omitted the value of home production. More china products sold in the home country will
help in generating GDP for the country as well even if exports gets decreased.
c) The prevailing prices in China are used to calculate its GDP. However, in case of USA, its
prices are used which may differ significantly and create a difference in GDP of both the
countries.
6.
a) A haircut is a consumption service as it is not been performed to get any output in near future.
2
Document Page
b) A share in stock is an investment good as the person will enjoy output in near future and it has
been performed for the sake of investment (Kumar, Dudala and Rao, 2013).
c) Trans Canada high way is an investment good as it will be used by the people so as to create
capital
d) a Ski lift is an investment good as it is a skier which is helpful in creating capital.
e) An unsold truck in a GM plant in Ontario can be considered as both consumer and investment
good as GM made the truck to sell and it will generate capital. On the other hand, it can be
bought by a person to use it as well.
7.
a) A decrease in deficit by Indian government will lead to decrease in demand of loanable funds
as well.
b) If there is slowdown in future income it will increase the supply of loanable funds with the
increase in savings of the households.
8.
a) Lower productivity in Syria have a greater impact on GDP of the country. It will reduce the
outputs and hence potential GDP will reduce.
b) Labour productivity results in increase in growth rate, enhanced demand of exports and low
inflation. Decrease in labour productivity will increase the requirement of employment in order
to meet the expectations of output.
c) The real wage rate will reduce due to decrease in labour productivity and increase in the cost
of the products involved in production.
9.
Table 1: Calculation of real GDP
Y(0-10) 212.6 72.4
Nominal GDP Price index REAL GDP
Y0 559 100 559
Y1 660 113.5 13% 574.2
Y2 774 120.3 20% 619.2 GDP
3
Document Page
deflat
or
1993 1752.4 113.7
29742
1
10.
a) Balanced budget is when revenues are equal to expenditure. Hence, no budget deficit or
surplus is experienced.
b) Equilibrium real interest rate is 5% as it is the intersection point of laonable funds demanded
and loanable funds supplied.
c) An increase in planned savings will lead to decrease in real interest rate and demand of the
funds will increase by 1 billion at every interest rate.
d) An increase in planned investment will increase the interest rates which will decrease the
availability of funds by 1 billion at every interest rate
e)
Source: The Loanable Funds Market: Graphical Explanation, 2012
An increase in planned investment and real interest rate will lead to slight increase in
demand of the people
4
Illustration 1: Investment and interest rate
tabler-icon-diamond-filled.svg

Paraphrase This Document

Need a fresh take? Get an instant paraphrase of this document with our AI Paraphraser
Document Page
REFERENCES
Books and Journals
Nagaraju, D., Ramakrishnarao, A. and Narayanan, S., 2012. Two-echelon supply chain with
selling price dependent demand under wholesale price index and consumer price
index. International Journal of Logistics Systems and Management. 13(4). pp.417-439.
Kumar, B. R., Dudala, S. R. and Rao, A. R., 2013. Kuppuswamy’s socio-economic status scale–a
revision of economic parameter for 2012. Int J Res Dev Health. 1(1). pp.2-4.
Online
The Loanable Funds Market: Graphical Explanation. 2012. [Online]. Available through
<https://muddywatermacro.wustl.edu/loanable-funds-graphical-explanation>. [Accessed on
31st August 2017].
5
chevron_up_icon
1 out of 8
circle_padding
hide_on_mobile
zoom_out_icon
logo.png

Your All-in-One AI-Powered Toolkit for Academic Success.

Available 24*7 on WhatsApp / Email

[object Object]