Macroeconomics Report: Demand, Supply, and Global Market Dynamics

Verified

Added on  2020/01/28

|7
|1020
|199
Report
AI Summary
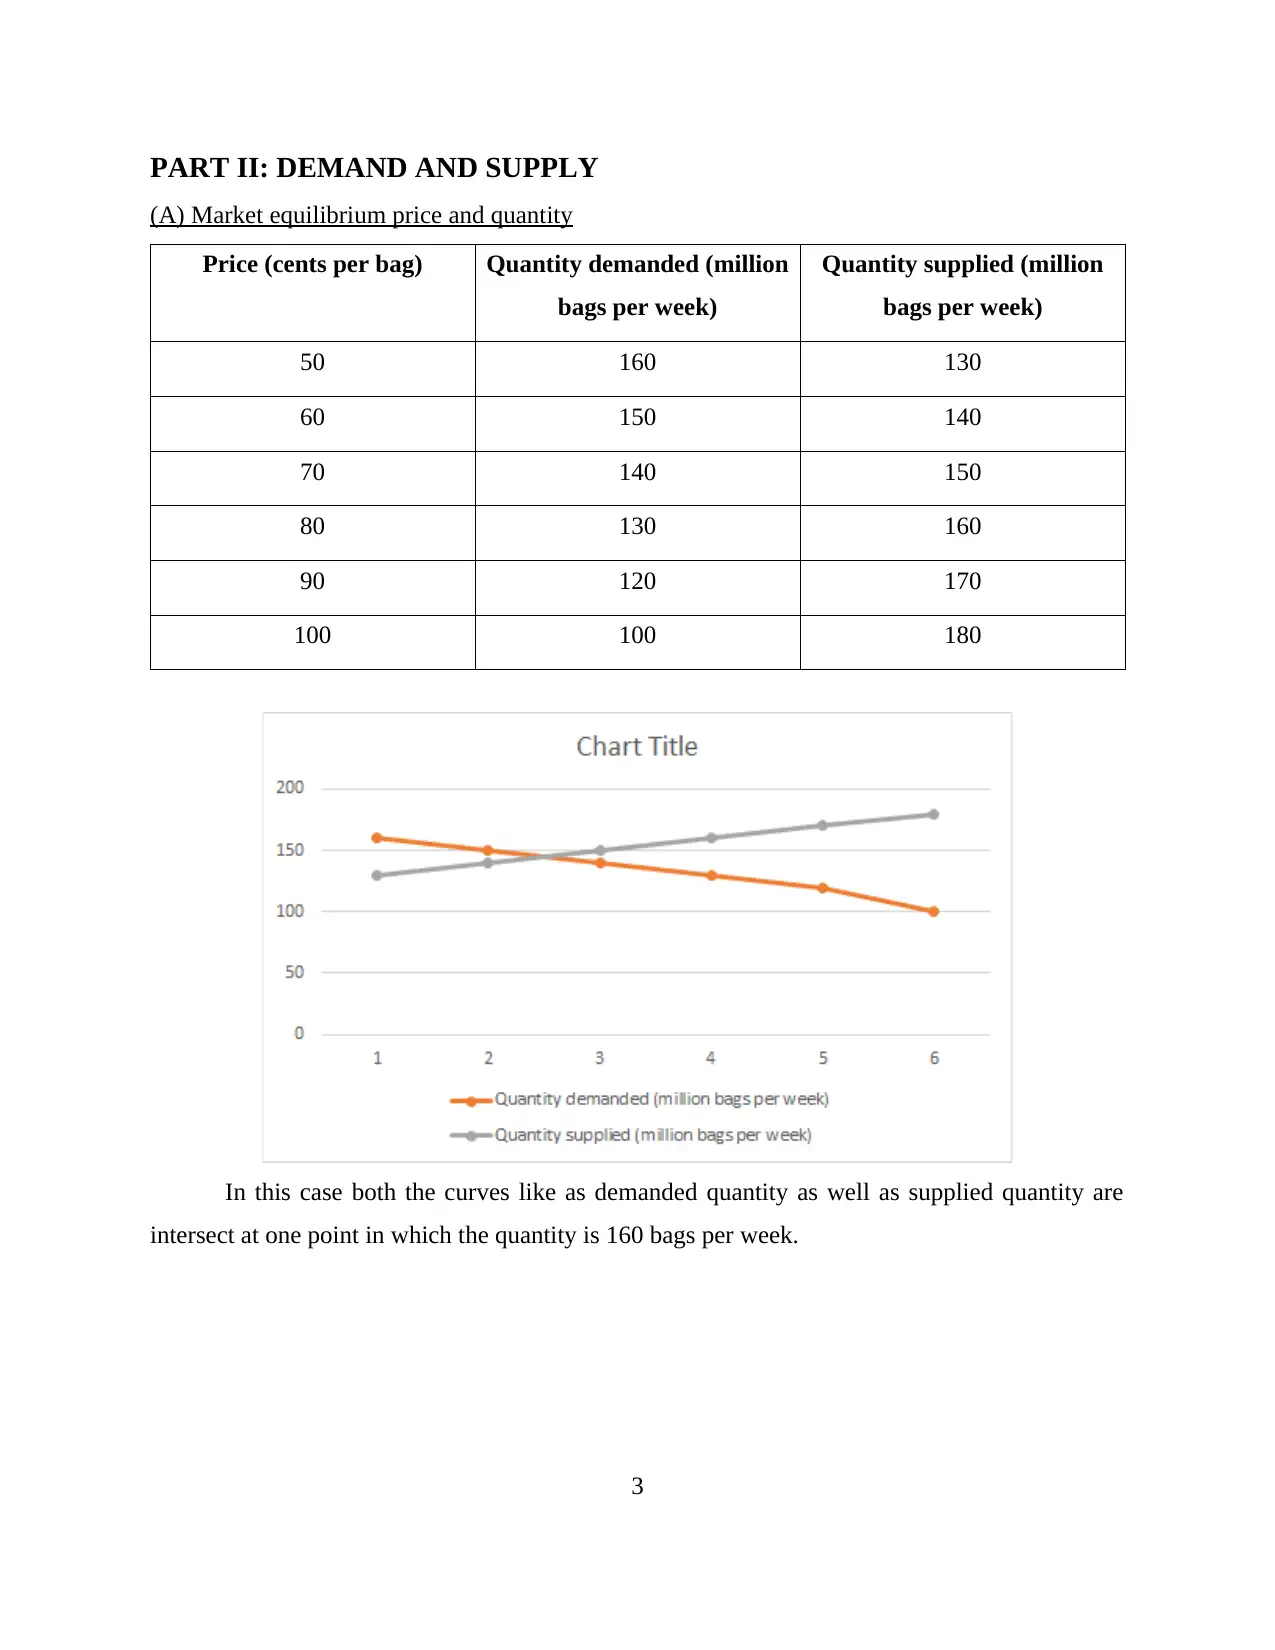
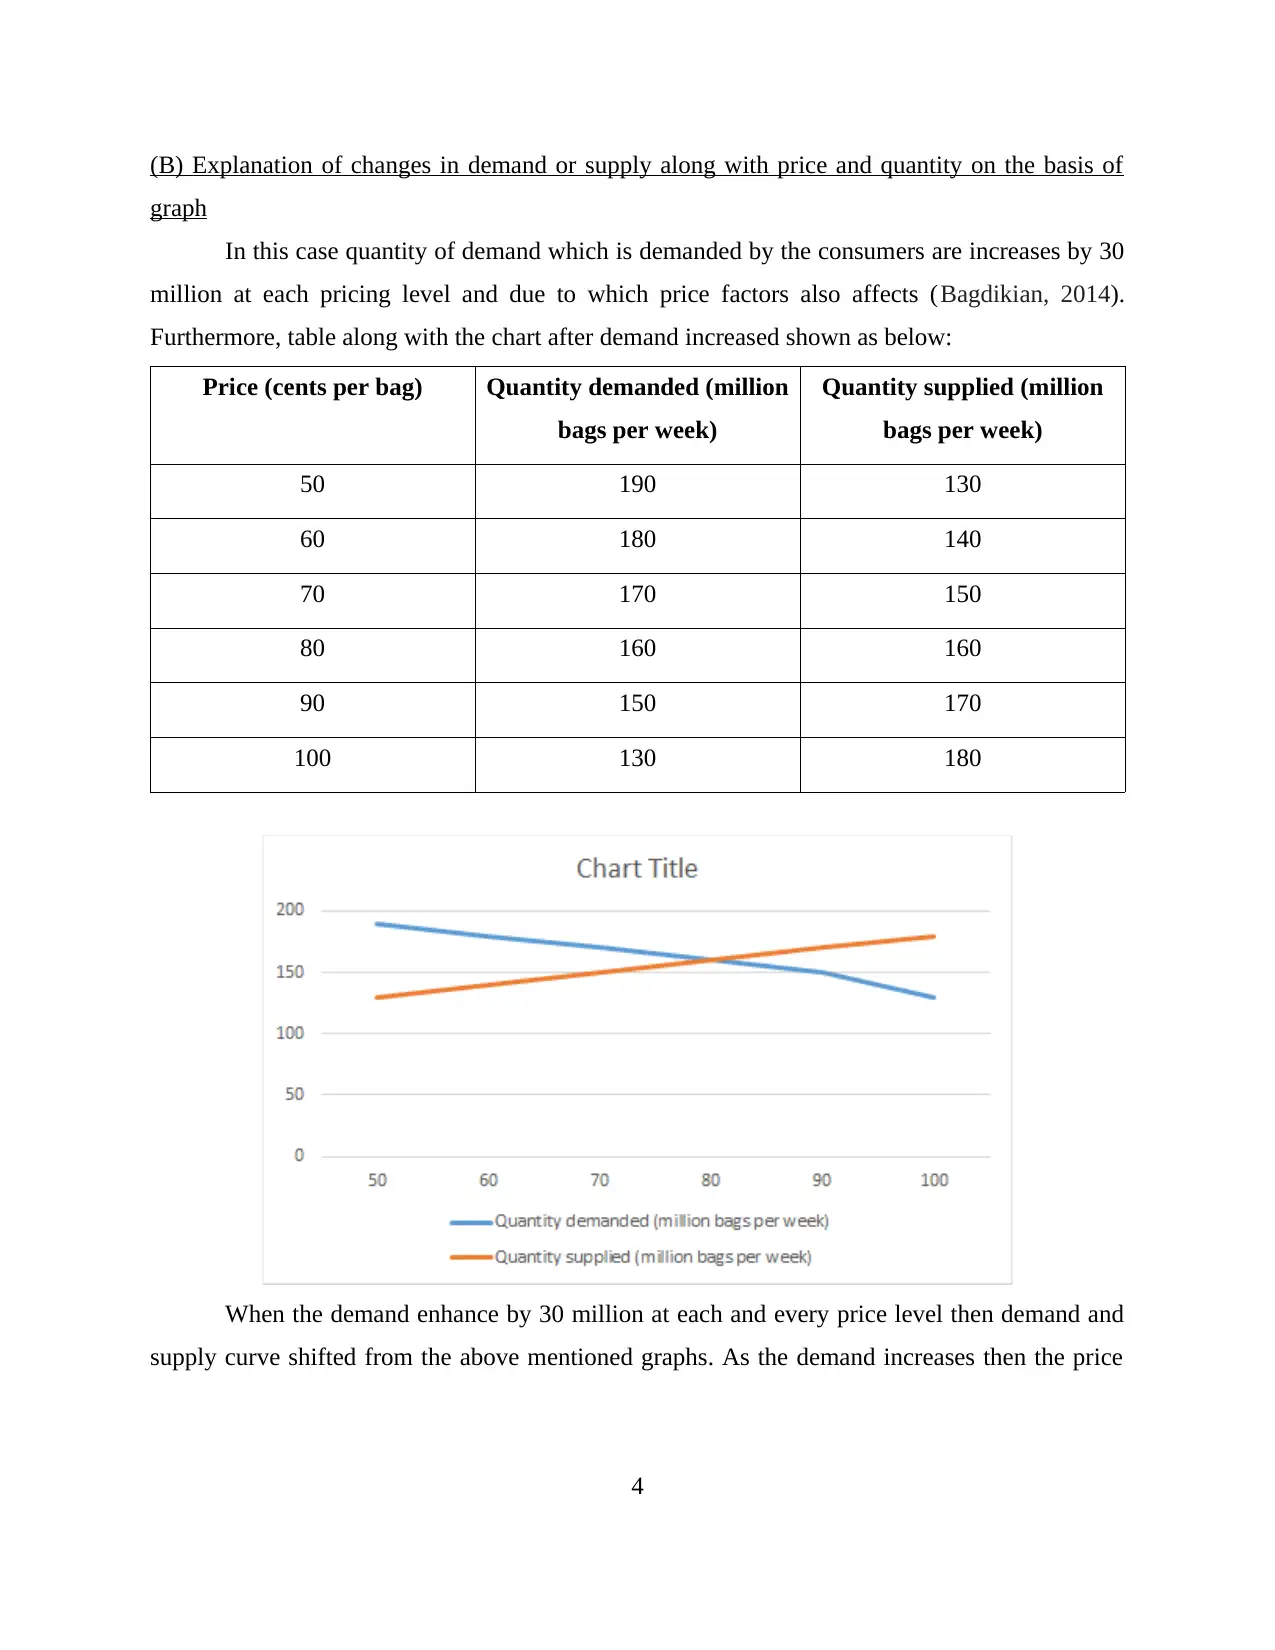
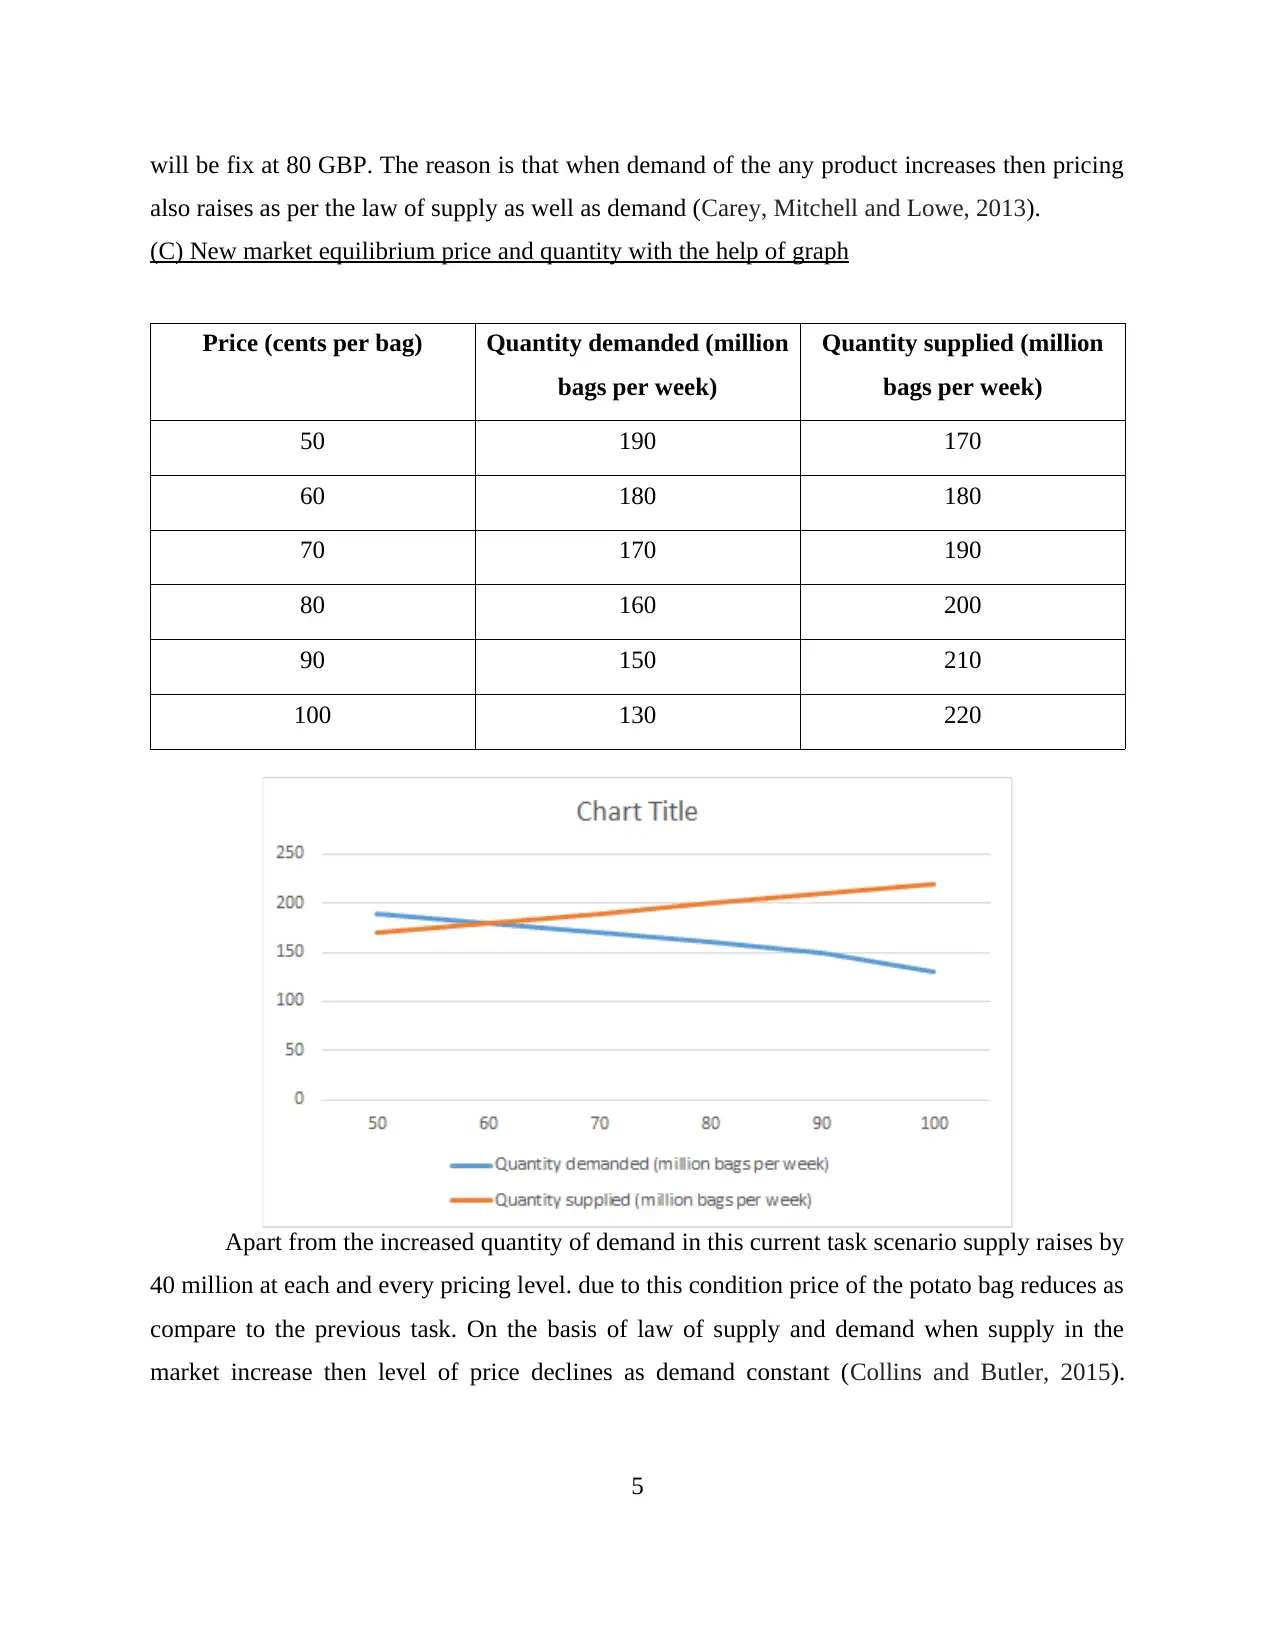
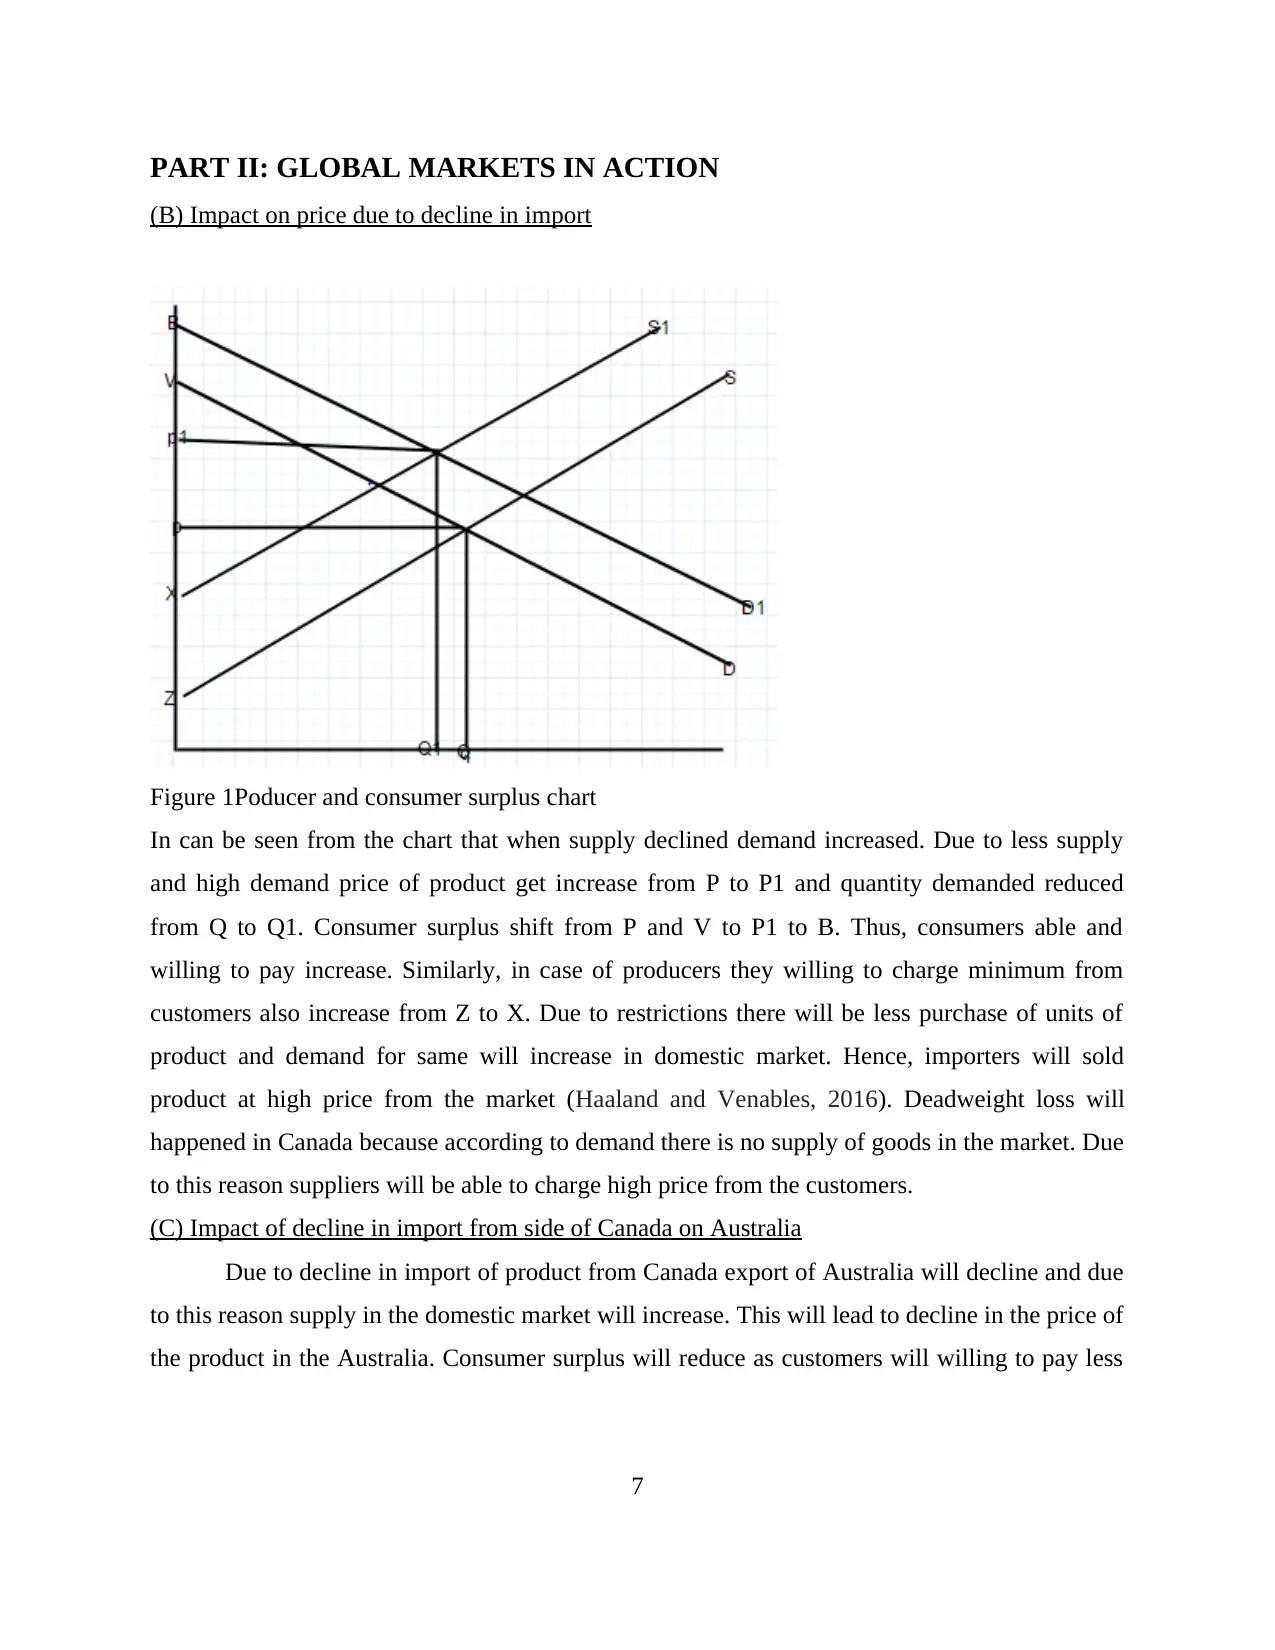
This report provides a comprehensive analysis of macroeconomic principles, specifically focusing on demand and supply dynamics, market equilibrium, and the effects of global market events. Part I of the report examines the determination of market equilibrium price and quantity using supply and demand schedules and graphs. It also explores the impact of changes in demand and supply on price and quantity, illustrating these changes graphically. Part II delves into global market interactions, analyzing the impact of import declines on prices, consumer and producer surplus, and specifically examining the effects of a decline in imports from Canada on Australia's market. The report uses graphical representations to illustrate these concepts and cites relevant academic sources to support its analysis. This report demonstrates a clear understanding of macroeconomic concepts and their practical applications in both domestic and international markets.
Document Page
MACROECONOMIC
1
tabler-icon-diamond-filled.svg

Paraphrase This Document

Need a fresh take? Get an instant paraphrase of this document with our AI Paraphraser
Document Page
TABLE OF CONTENTS
PART II: Demand and Supply.........................................................................................................3
(A) Market equilibrium price and quantity..................................................................................3
(B) Explanation of changes in demand or supply along with price and quantity on the basis of
graph............................................................................................................................................3
(C) New market equilibrium price and quantity with the help of graph......................................4
Part ii: Global MARKETS IN ACTION.........................................................................................6
(B) Impact on price due to decline in import...............................................................................6
(C) Impact of decline in import from side of Canada on Australia.............................................6
REFERENCES................................................................................................................................7
2
Document Page
PART II: DEMAND AND SUPPLY
(A) Market equilibrium price and quantity
Price (cents per bag) Quantity demanded (million
bags per week)
Quantity supplied (million
bags per week)
50 160 130
60 150 140
70 140 150
80 130 160
90 120 170
100 100 180
In this case both the curves like as demanded quantity as well as supplied quantity are
intersect at one point in which the quantity is 160 bags per week.
3
Document Page
(B) Explanation of changes in demand or supply along with price and quantity on the basis of
graph
In this case quantity of demand which is demanded by the consumers are increases by 30
million at each pricing level and due to which price factors also affects (Bagdikian, 2014).
Furthermore, table along with the chart after demand increased shown as below:
Price (cents per bag) Quantity demanded (million
bags per week)
Quantity supplied (million
bags per week)
50 190 130
60 180 140
70 170 150
80 160 160
90 150 170
100 130 180
When the demand enhance by 30 million at each and every price level then demand and
supply curve shifted from the above mentioned graphs. As the demand increases then the price
4
tabler-icon-diamond-filled.svg

Paraphrase This Document

Need a fresh take? Get an instant paraphrase of this document with our AI Paraphraser
Document Page
will be fix at 80 GBP. The reason is that when demand of the any product increases then pricing
also raises as per the law of supply as well as demand (Carey, Mitchell and Lowe, 2013).
(C) New market equilibrium price and quantity with the help of graph
Price (cents per bag) Quantity demanded (million
bags per week)
Quantity supplied (million
bags per week)
50 190 170
60 180 180
70 170 190
80 160 200
90 150 210
100 130 220
Apart from the increased quantity of demand in this current task scenario supply raises by
40 million at each and every pricing level. due to this condition price of the potato bag reduces as
compare to the previous task. On the basis of law of supply and demand when supply in the
market increase then level of price declines as demand constant (Collins and Butler, 2015).
5
Document Page
Furthermore, at the point of equilibrium in the current case price of the potato bag will be fix at
60 GBP and quantity will be 175 potato bags.
6
Document Page
PART II: GLOBAL MARKETS IN ACTION
(B) Impact on price due to decline in import
Figure 1Poducer and consumer surplus chart
In can be seen from the chart that when supply declined demand increased. Due to less supply
and high demand price of product get increase from P to P1 and quantity demanded reduced
from Q to Q1. Consumer surplus shift from P and V to P1 to B. Thus, consumers able and
willing to pay increase. Similarly, in case of producers they willing to charge minimum from
customers also increase from Z to X. Due to restrictions there will be less purchase of units of
product and demand for same will increase in domestic market. Hence, importers will sold
product at high price from the market (Haaland and Venables, 2016). Deadweight loss will
happened in Canada because according to demand there is no supply of goods in the market. Due
to this reason suppliers will be able to charge high price from the customers.
(C) Impact of decline in import from side of Canada on Australia
Due to decline in import of product from Canada export of Australia will decline and due
to this reason supply in the domestic market will increase. This will lead to decline in the price of
the product in the Australia. Consumer surplus will reduce as customers will willing to pay less
7
chevron_up_icon
1 out of 7
circle_padding
hide_on_mobile
zoom_out_icon
[object Object]