MAE101 Economic Principles: Analyzing iPhone Demand and Revenue

Verified

Added on  2023/06/13

|7
|973
|443
Homework Assignment
AI Summary
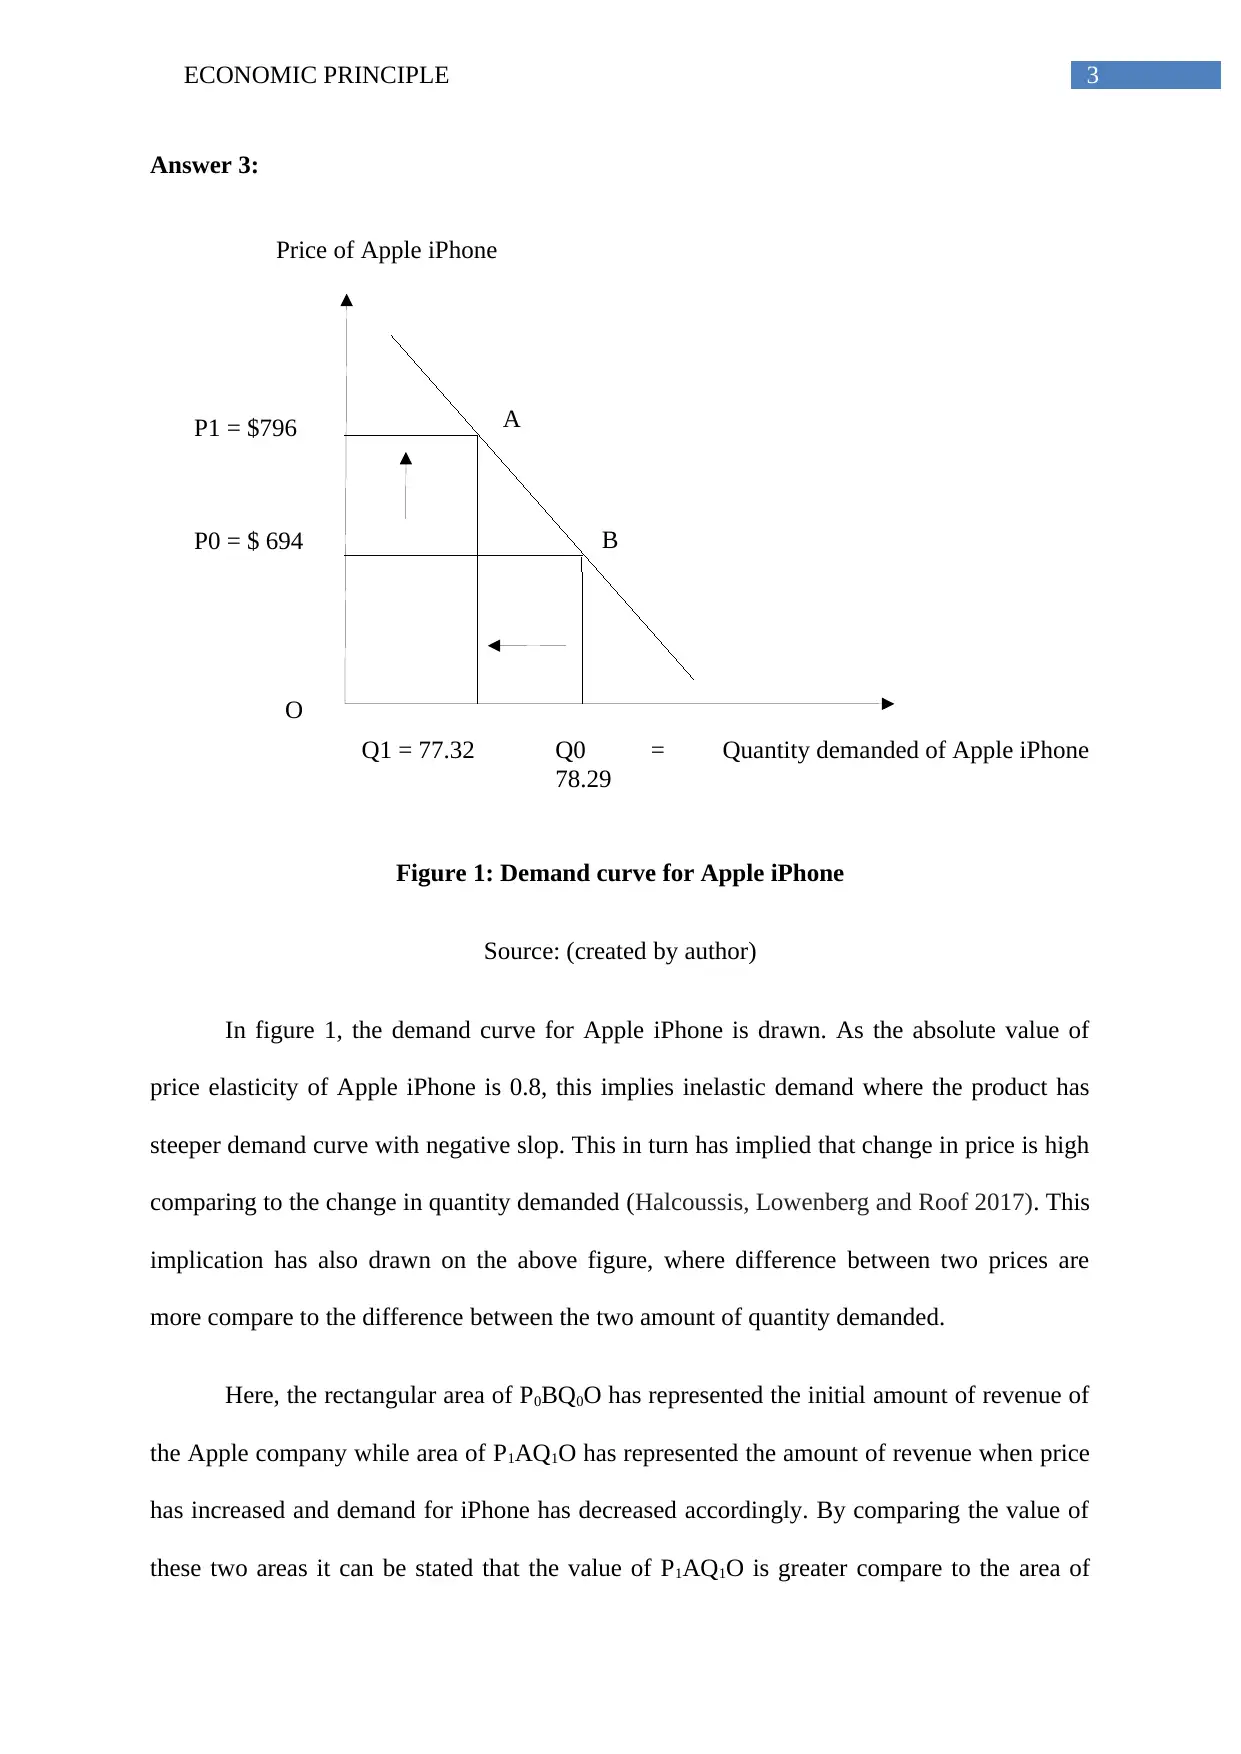
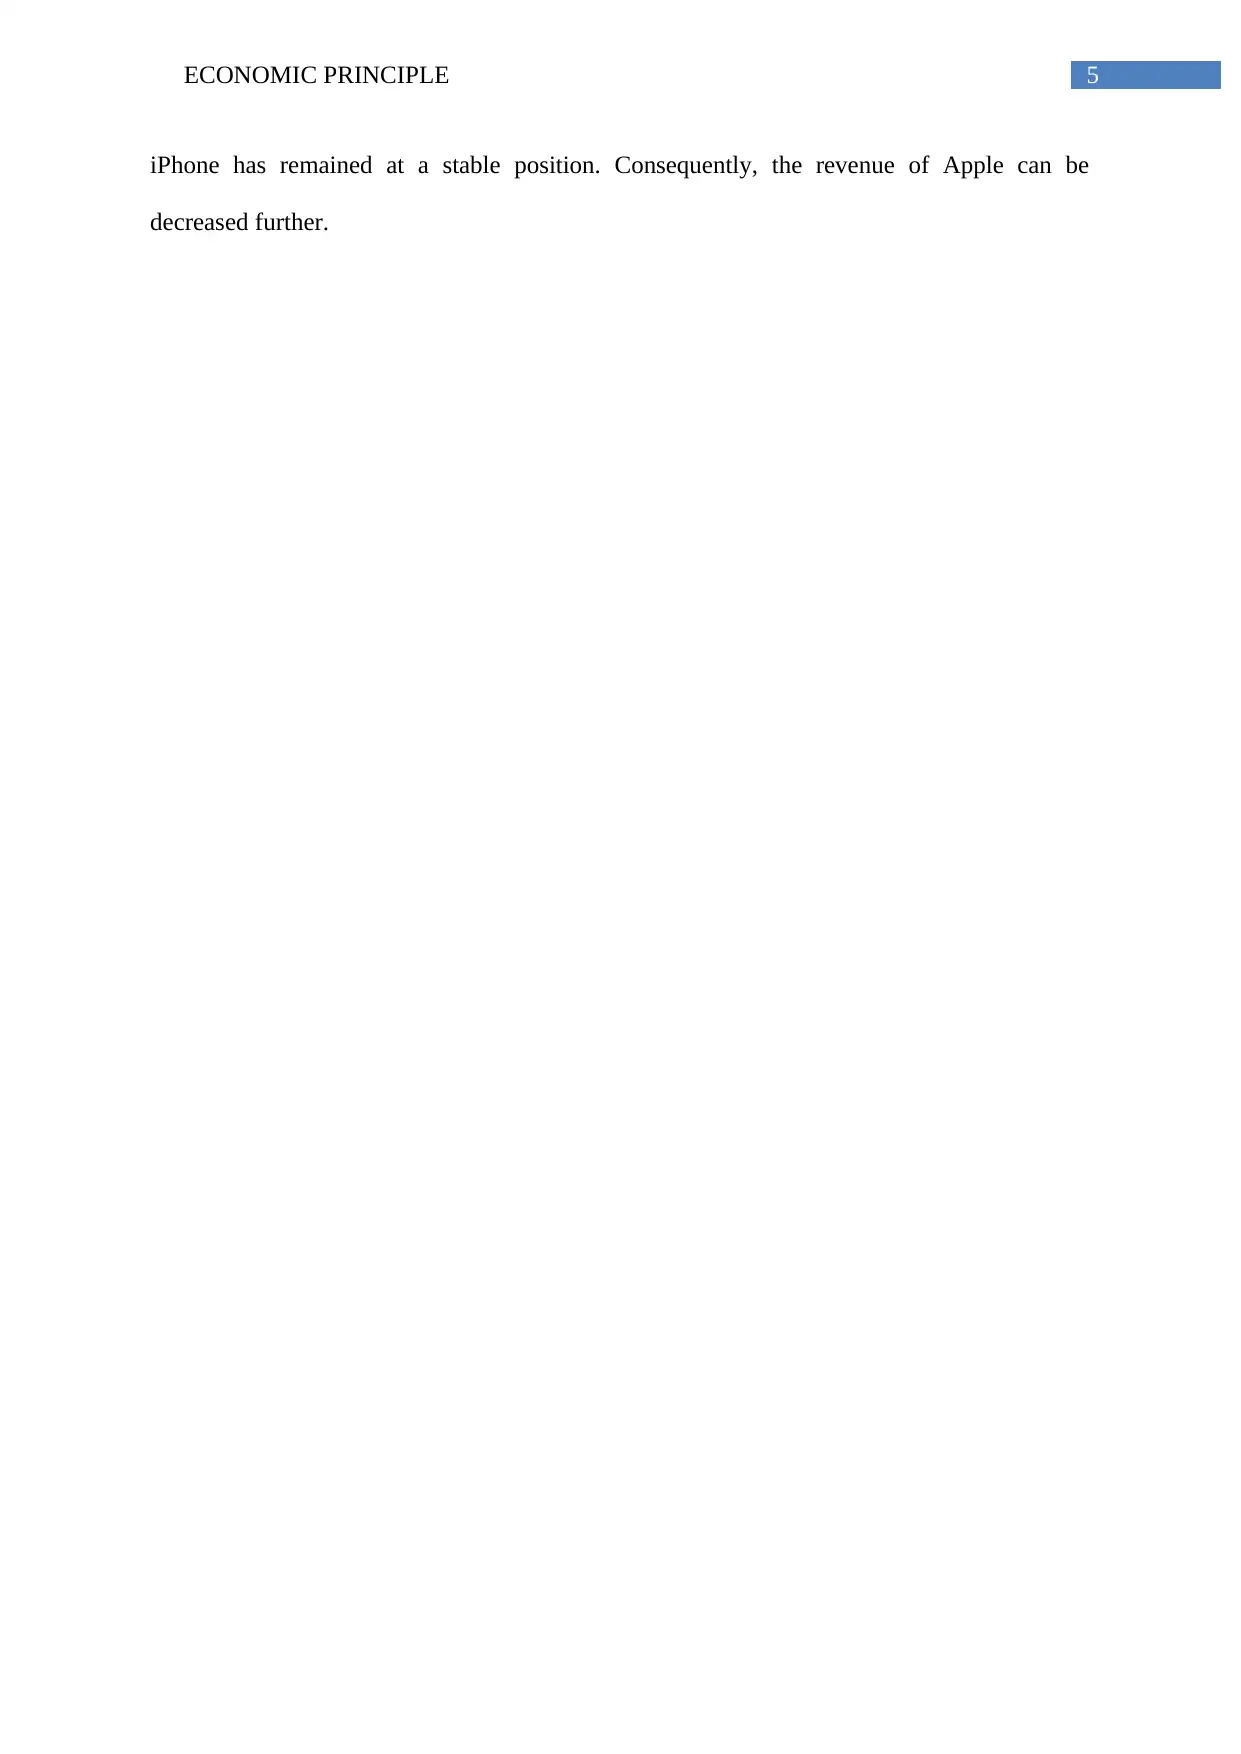
This assignment delves into the economic principles behind Apple's pricing strategy for the iPhone X compared to iPhone 8, focusing on price elasticity of demand and its impact on revenue. It calculates the price elasticity of demand for iPhones, illustrating it with a demand curve and explaining the concept of inelastic demand. The analysis compares revenue changes resulting from price increases and decreased demand. Furthermore, the assignment discusses the impact of competitor products, such as Samsung, on Apple's iPhone demand and market dynamics, illustrating how increased competition can shift the demand curve and potentially decrease Apple's revenue. The assignment uses formulas and graphical representations to explain these economic concepts.
Document Page
Running head: ECONOMIC PRINCIPLE
Economic Principle
Name of the university
Name of the student
Author Note
tabler-icon-diamond-filled.svg

Paraphrase This Document

Need a fresh take? Get an instant paraphrase of this document with our AI Paraphraser
Document Page
1ECONOMIC PRINCIPLE
Table of Contents
Answer 1:...................................................................................................................................2
Answer 2:...................................................................................................................................2
Answer 3:...................................................................................................................................3
Answer 4:...................................................................................................................................4
References:.................................................................................................................................6
Document Page
2ECONOMIC PRINCIPLE
Answer 1:
Apple has charged higher price for iPhone X compare to iPhone 8, while the quantity
sold for the initial product has decreased. This can be explained with the help of economic
concept. Total revenue can be obtained by multiplying total quantity sold in the market with
per unit price of the one. By comparing total revue obtained from iPhone 8 and iPhone X, it
can be stated that change in price is comparatively high compare to change in quantity
demanded (Tian et al. 2017). Hence, increase in price for unit phone has helped the company
to increase its total revenue. This can be explained as follows:
Total revenue (TRX) = total quantity of iPhone X (QX) * per unit price of iPhone X (PX)
Total revenue (TR8) = total quantity of iPhone X (Q8) * per unit price of iPhone (P8)
Here, QX < Q8 while P8 > PX.
Answer 2:
Price elasticity related to demand measures the responsiveness of quantity demanded
for a particular product when its price changes (Coglianese, Davis, Kilian and Stock 2017).
The average sale price of iPhone has increased from $ 694 to $ 796 while the quantity has
decreased from 78.29 million to 77.32 million. Hence, initial price = $ 694 and change in
price = $ (796-694) = $ 102. On the other side, initial quantity demanded is 78.29 million and
change in quantity demanded is (77.32- 78.29) million = - 0.97 million. Thus, Price elasticity
of Apple iPhone is: (Ep) = - (0.97/78.29) * 100 / (102/694) * 100
Ep = - 0.08
Hence, the absolute value of price elasticity of demand for iPhone X is 0.08.
Document Page
3ECONOMIC PRINCIPLE
Price of Apple iPhone
Quantity demanded of Apple iPhone
O
P1 = $796
P0 = $ 694
Q1 = 77.32 Q0 =
78.29
A
B
Answer 3:
Figure 1: Demand curve for Apple iPhone
Source: (created by author)
In figure 1, the demand curve for Apple iPhone is drawn. As the absolute value of
price elasticity of Apple iPhone is 0.8, this implies inelastic demand where the product has
steeper demand curve with negative slop. This in turn has implied that change in price is high
comparing to the change in quantity demanded (Halcoussis, Lowenberg and Roof 2017). This
implication has also drawn on the above figure, where difference between two prices are
more compare to the difference between the two amount of quantity demanded.
Here, the rectangular area of P0BQ0O has represented the initial amount of revenue of
the Apple company while area of P1AQ1O has represented the amount of revenue when price
has increased and demand for iPhone has decreased accordingly. By comparing the value of
these two areas it can be stated that the value of P1AQ1O is greater compare to the area of
tabler-icon-diamond-filled.svg

Paraphrase This Document

Need a fresh take? Get an instant paraphrase of this document with our AI Paraphraser
Document Page
4ECONOMIC PRINCIPLE
Price of Apple iPhone
Quantity demanded of Apple iPhone
O
P0
P1
Q1 Q0
D1 D0
S
P0BQ0O, which in turn has helped the company to earn more revenue though the increment of
price.
Answer 4:
Figure 2: Sift of demand curve of Apple iPhone
Source: (created by author)
Samsung has brought a product in market to compete with iPhone of Apple and
consequently can be acted as the substitute product of Apple. Hence, an increase in price of
Apple can decrease its demand, which in turn can increase the demand for Samsung in
market. This is shown in figure 2 (Kaiser, U., Mendez, S.J., Rønde and Ullrich 2014). As
Samsung has launched its product, the demand for Apple’s iPhone has decreased from Q0 to
Q1 while the market price of this product has also decreased from P0 to P1, while the supply of
Document Page
5ECONOMIC PRINCIPLE
iPhone has remained at a stable position. Consequently, the revenue of Apple can be
decreased further.
Document Page
6ECONOMIC PRINCIPLE
References:
Coglianese, J., Davis, L.W., Kilian, L. and Stock, J.H., 2017. Anticipation, tax avoidance,
and the price elasticity of gasoline demand. Journal of Applied Econometrics, 32(1), pp.1-15.
Halcoussis, D., Lowenberg, A.D. and Roof, Z., 2017. Estimating the Price Elasticity of
Demand for Cannabis: A Geographical and Crowdsourced Approach. Revista de Métodos
Cuantitativos para la Economía y la Empresa, 23, p.119.
Kaiser, U., Mendez, S.J., Rønde, T. and Ullrich, H., 2014. Regulation of pharmaceutical
prices: evidence from a reference price reform in Denmark. Journal of health economics, 36,
pp.174-187.
Tian, R., Zhang, Q., Wang, G., Li, H., Chen, S., Li, Y. and Tian, Y., 2017. Study on the
promotion of natural gas-fired electricity with energy market reform in China using a
dynamic game-theoretic model. Applied Energy, 185, pp.1832-1839.
chevron_up_icon
1 out of 7
circle_padding
hide_on_mobile
zoom_out_icon
[object Object]