MAE203 Global Economy Assignment: Economic Data and Career Goals

Verified

Added on  2023/06/12

|23
|4338
|228
Homework Assignment
AI Summary
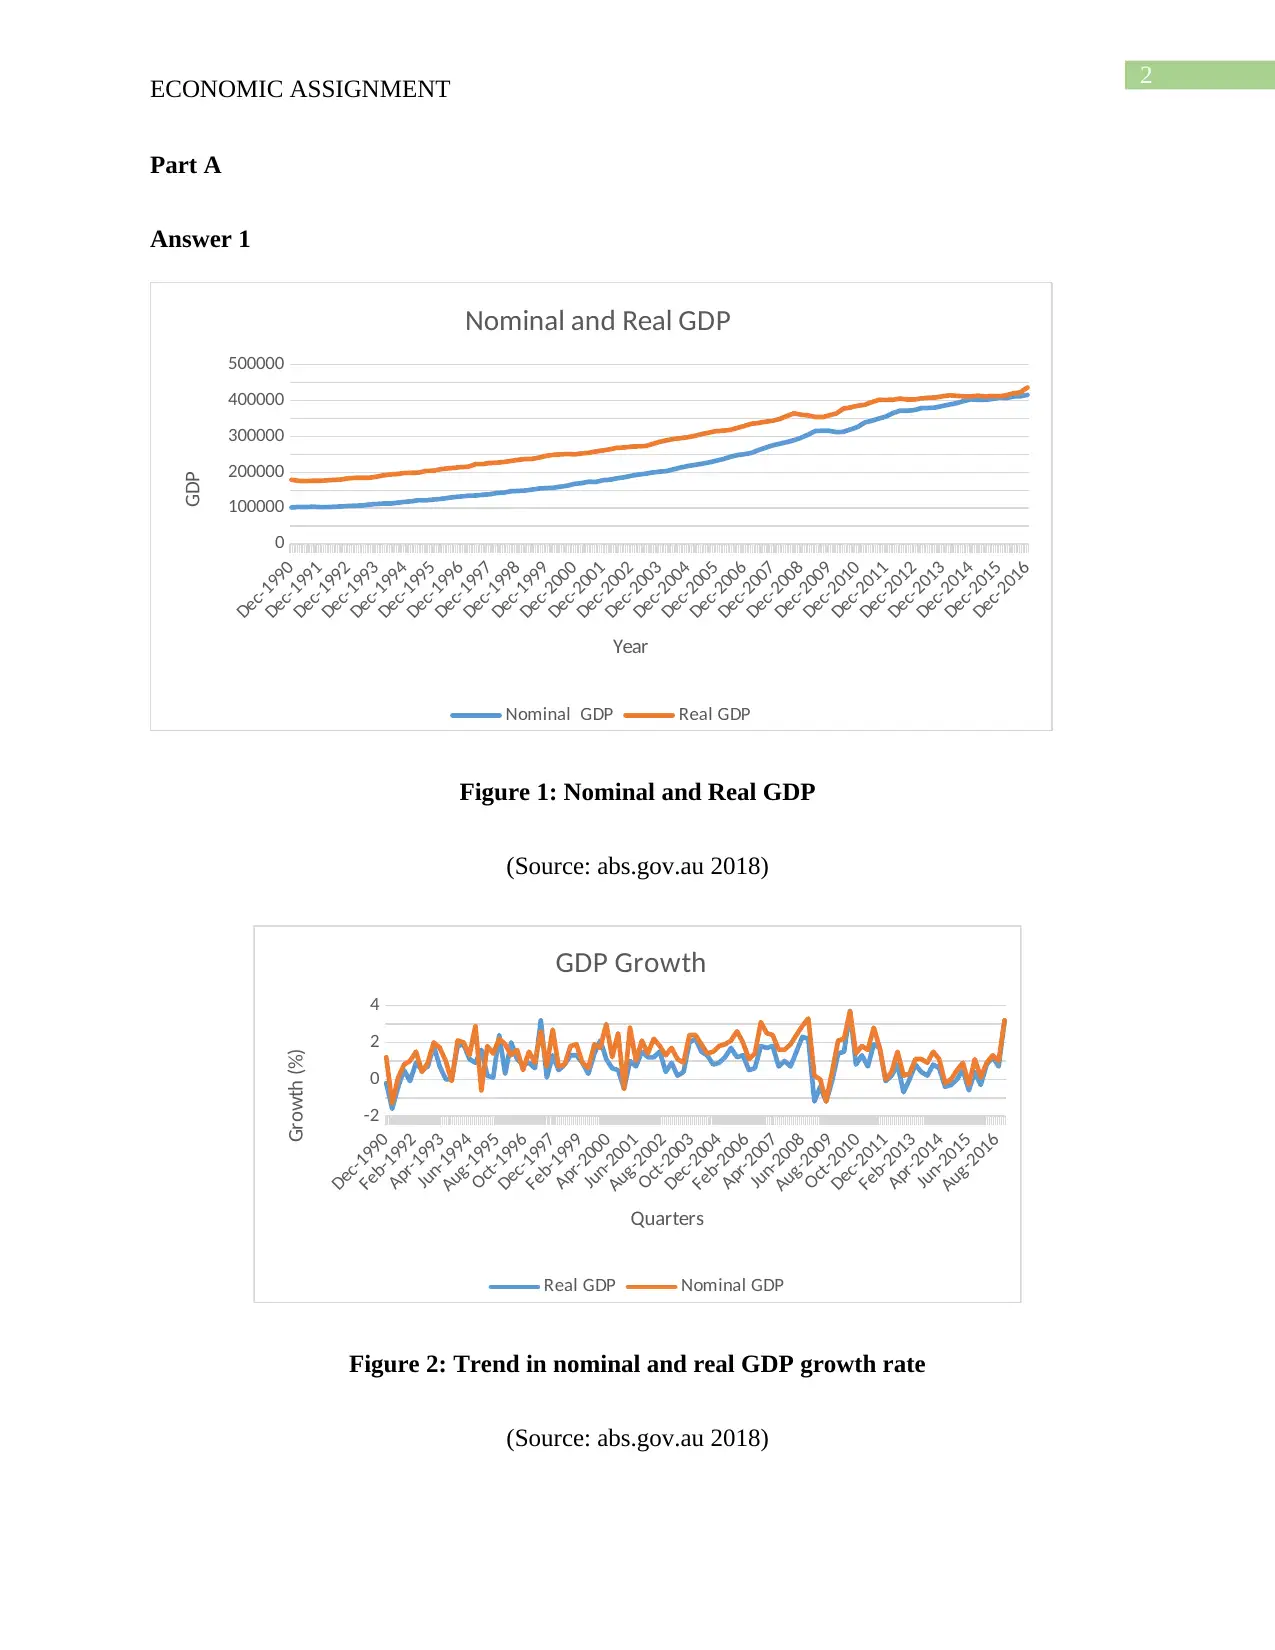
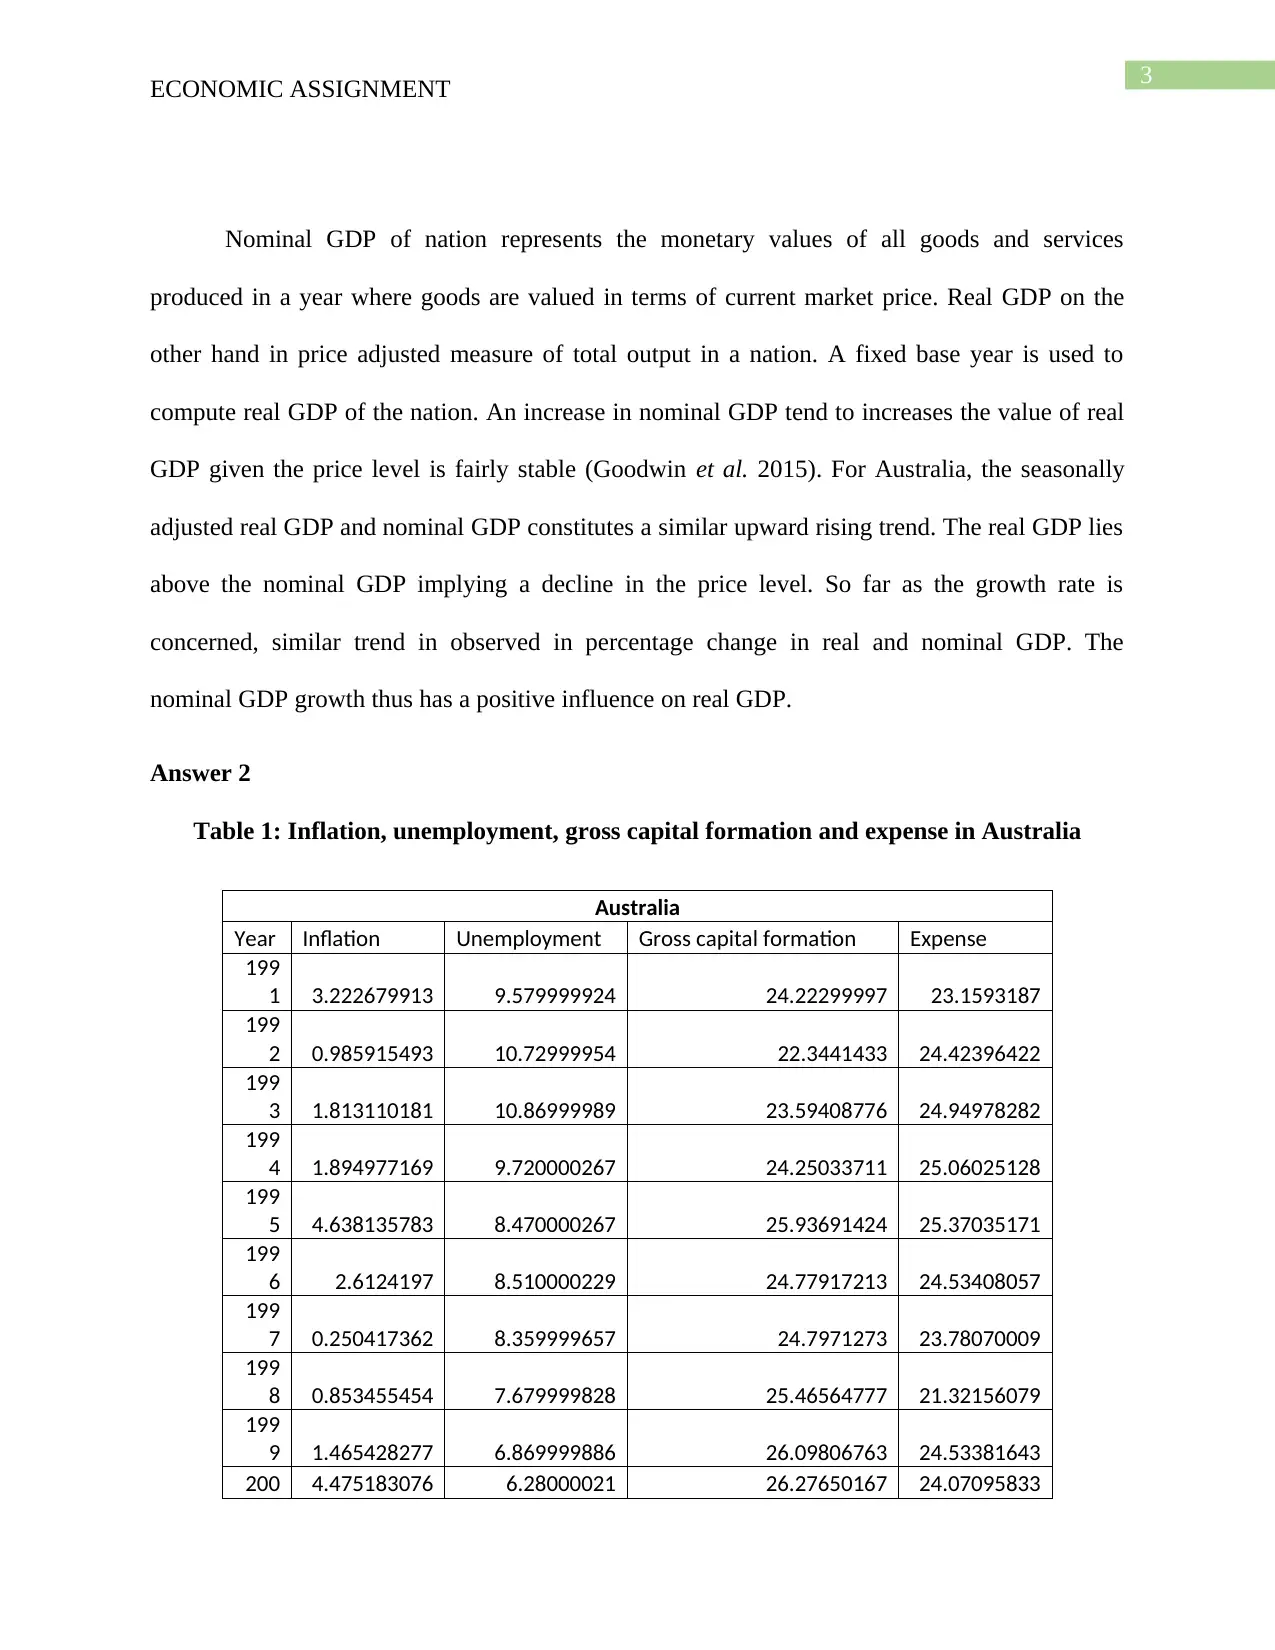
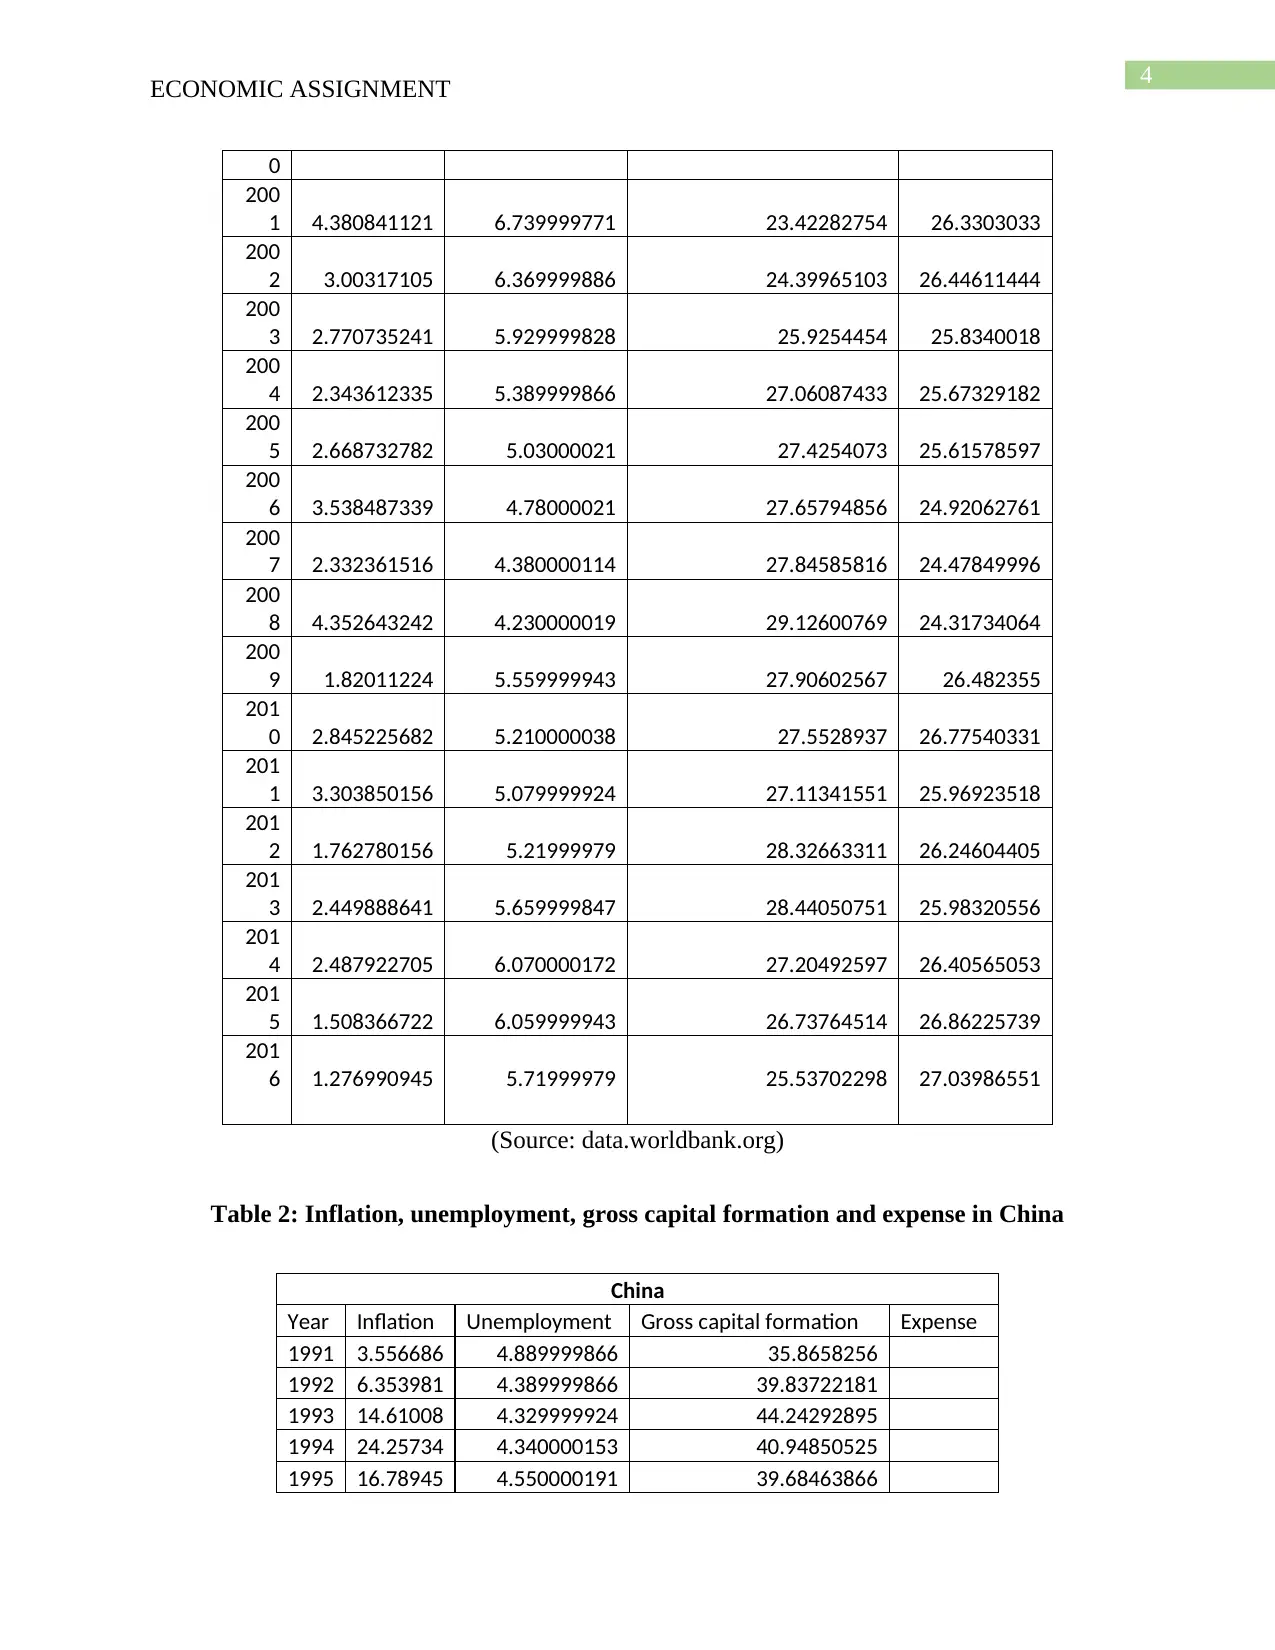
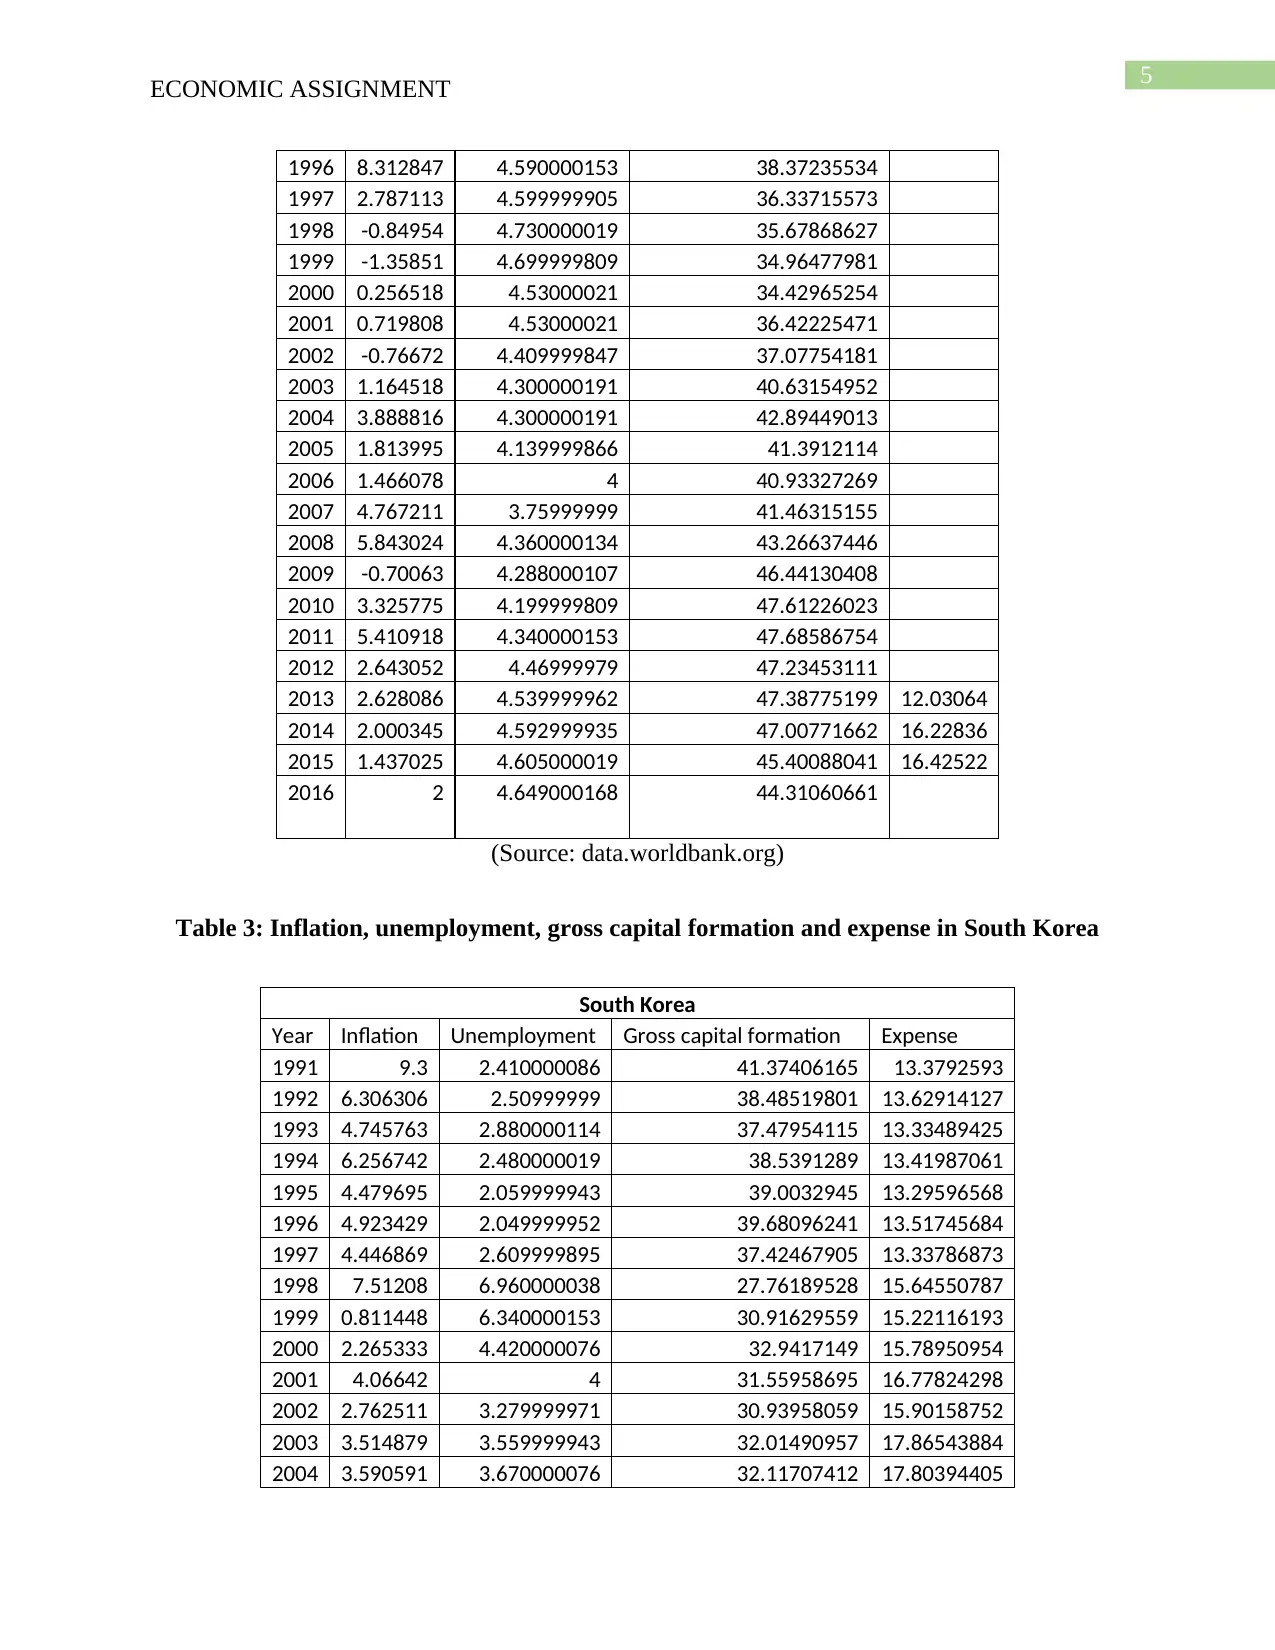
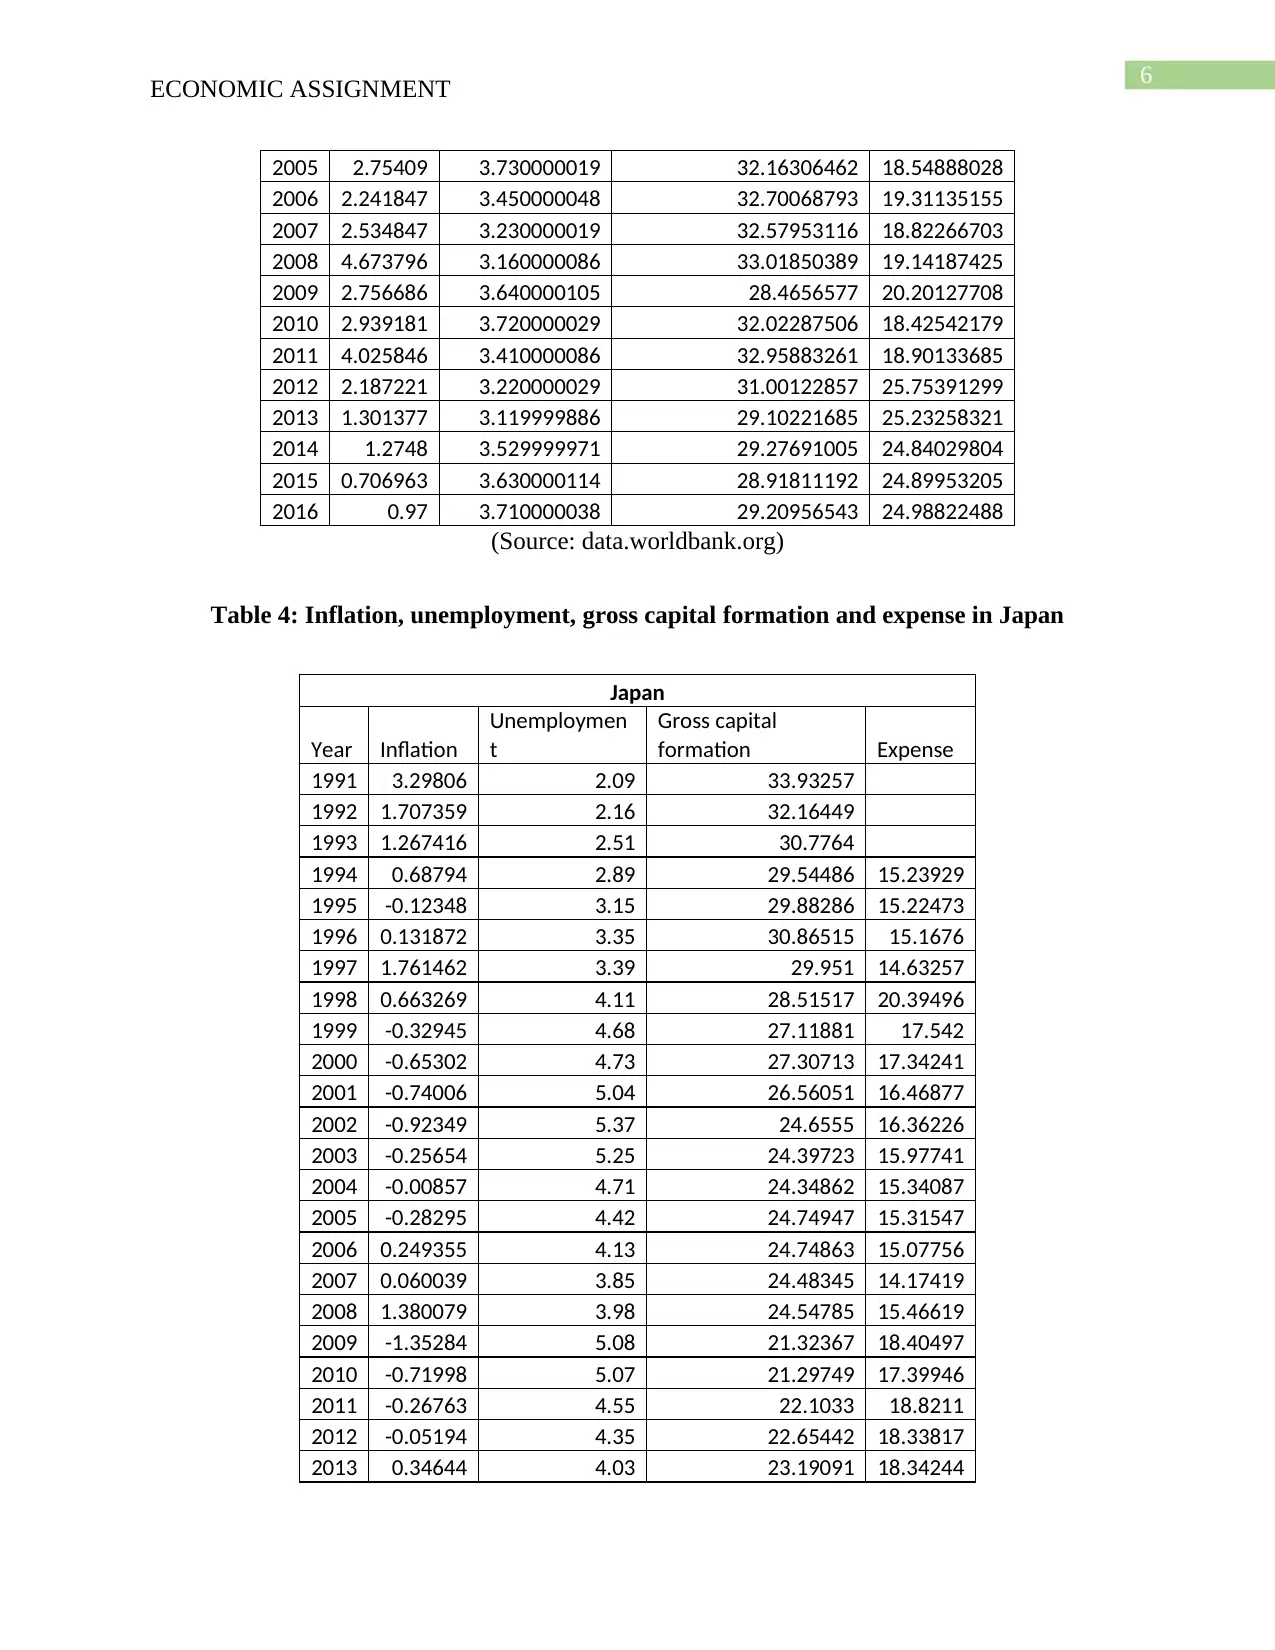
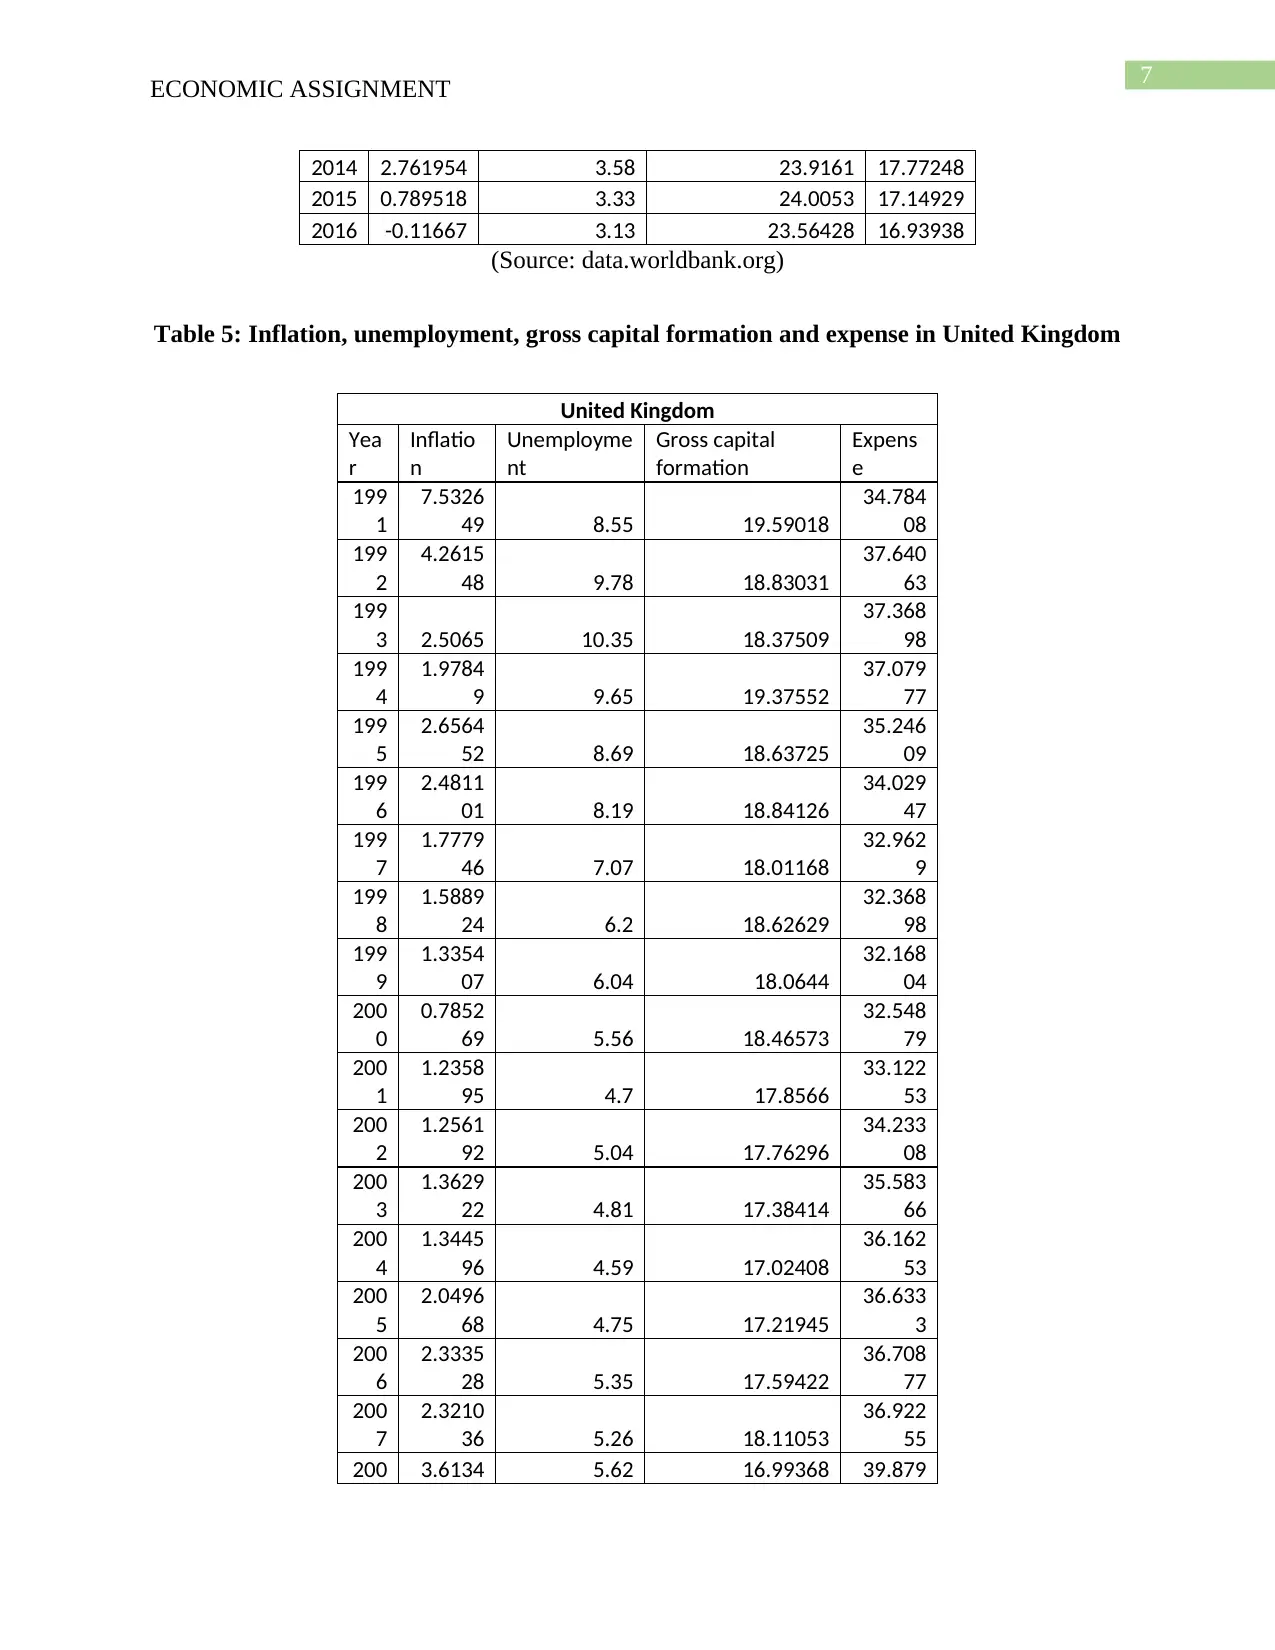
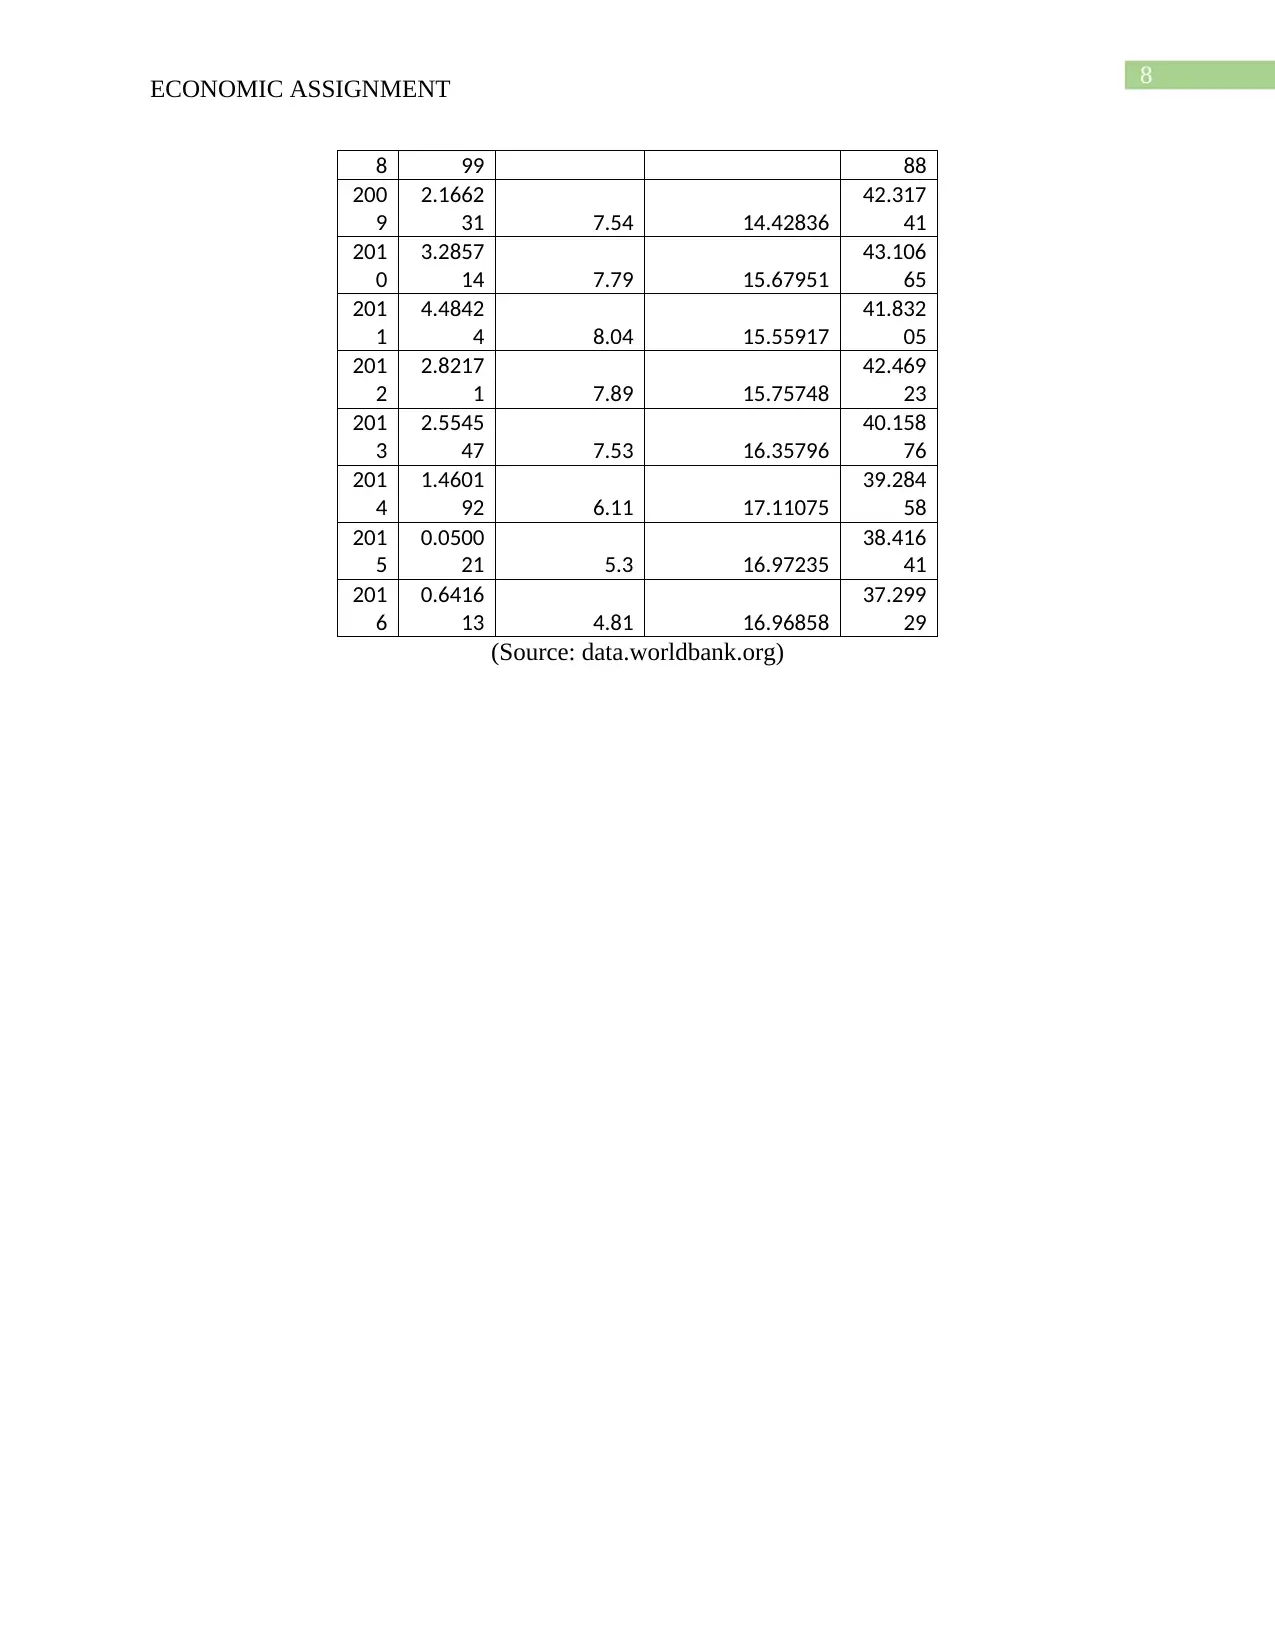
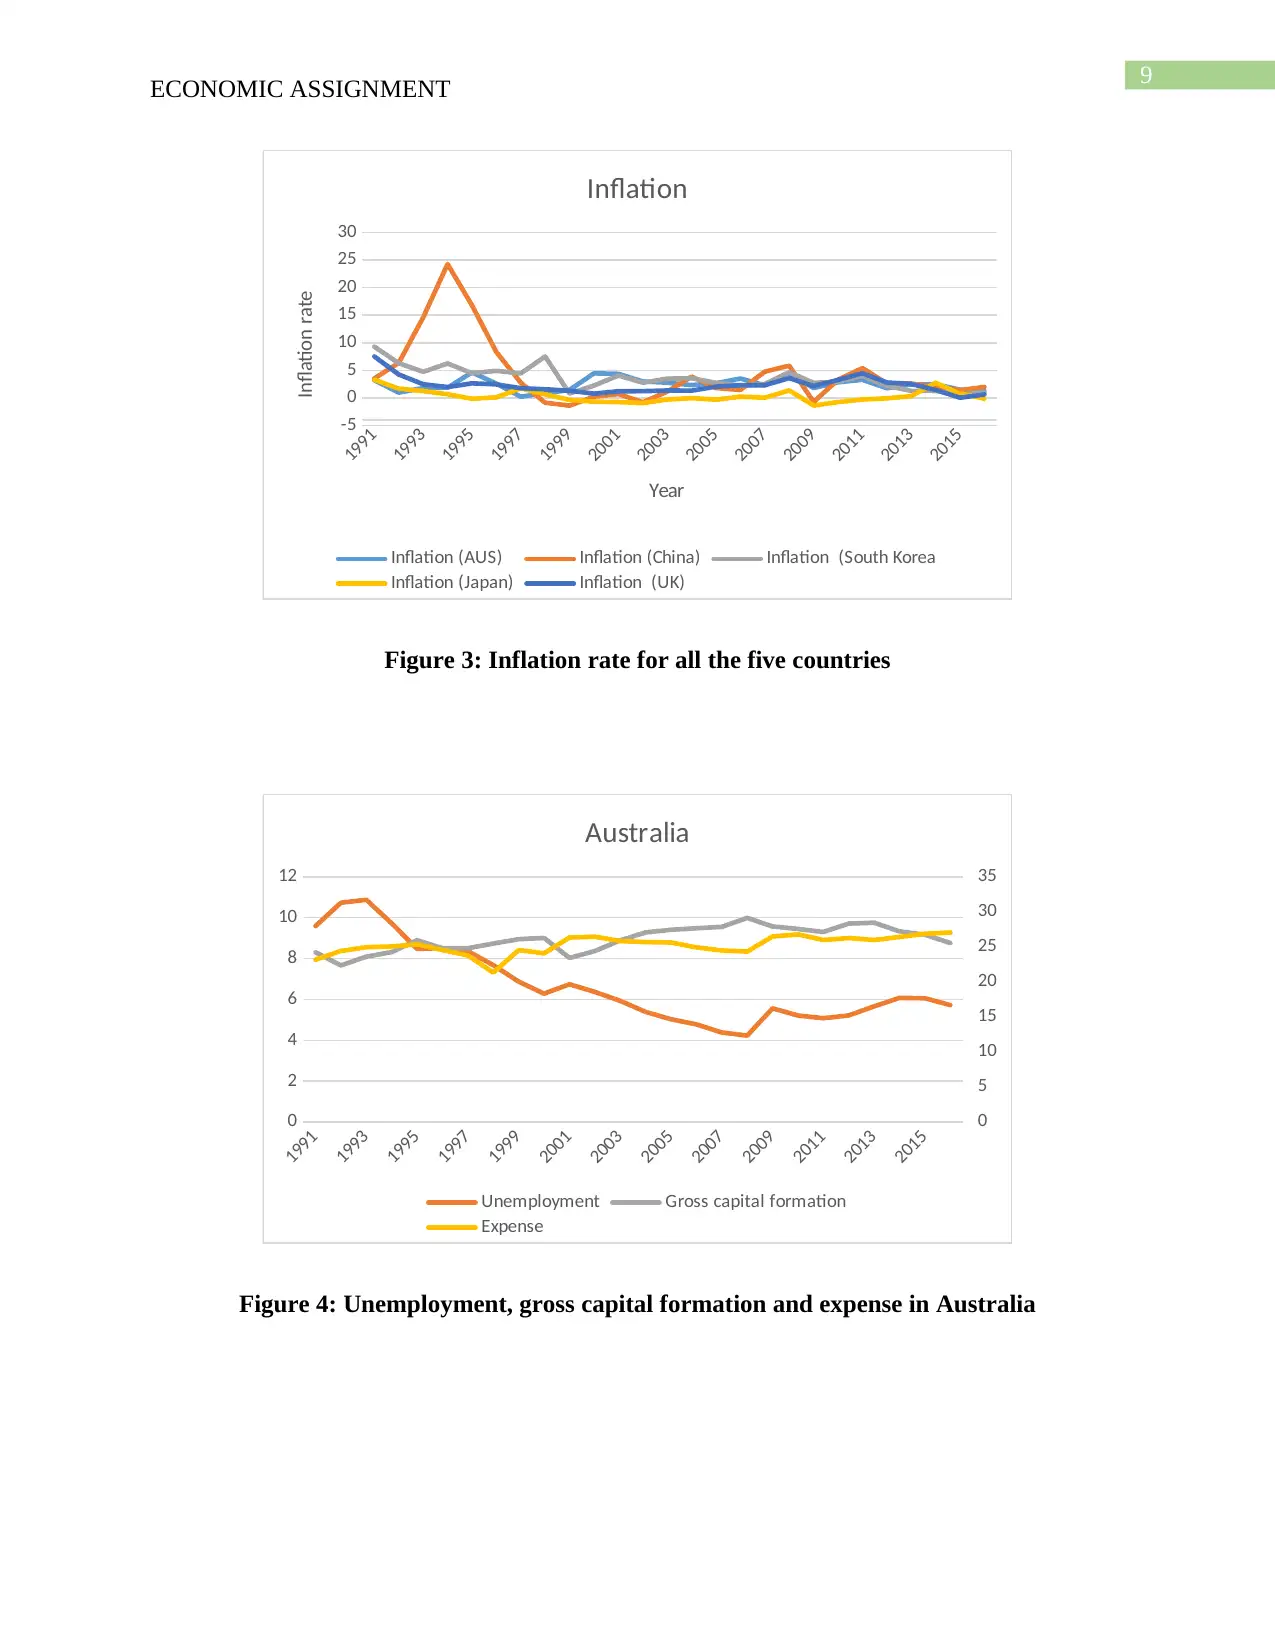
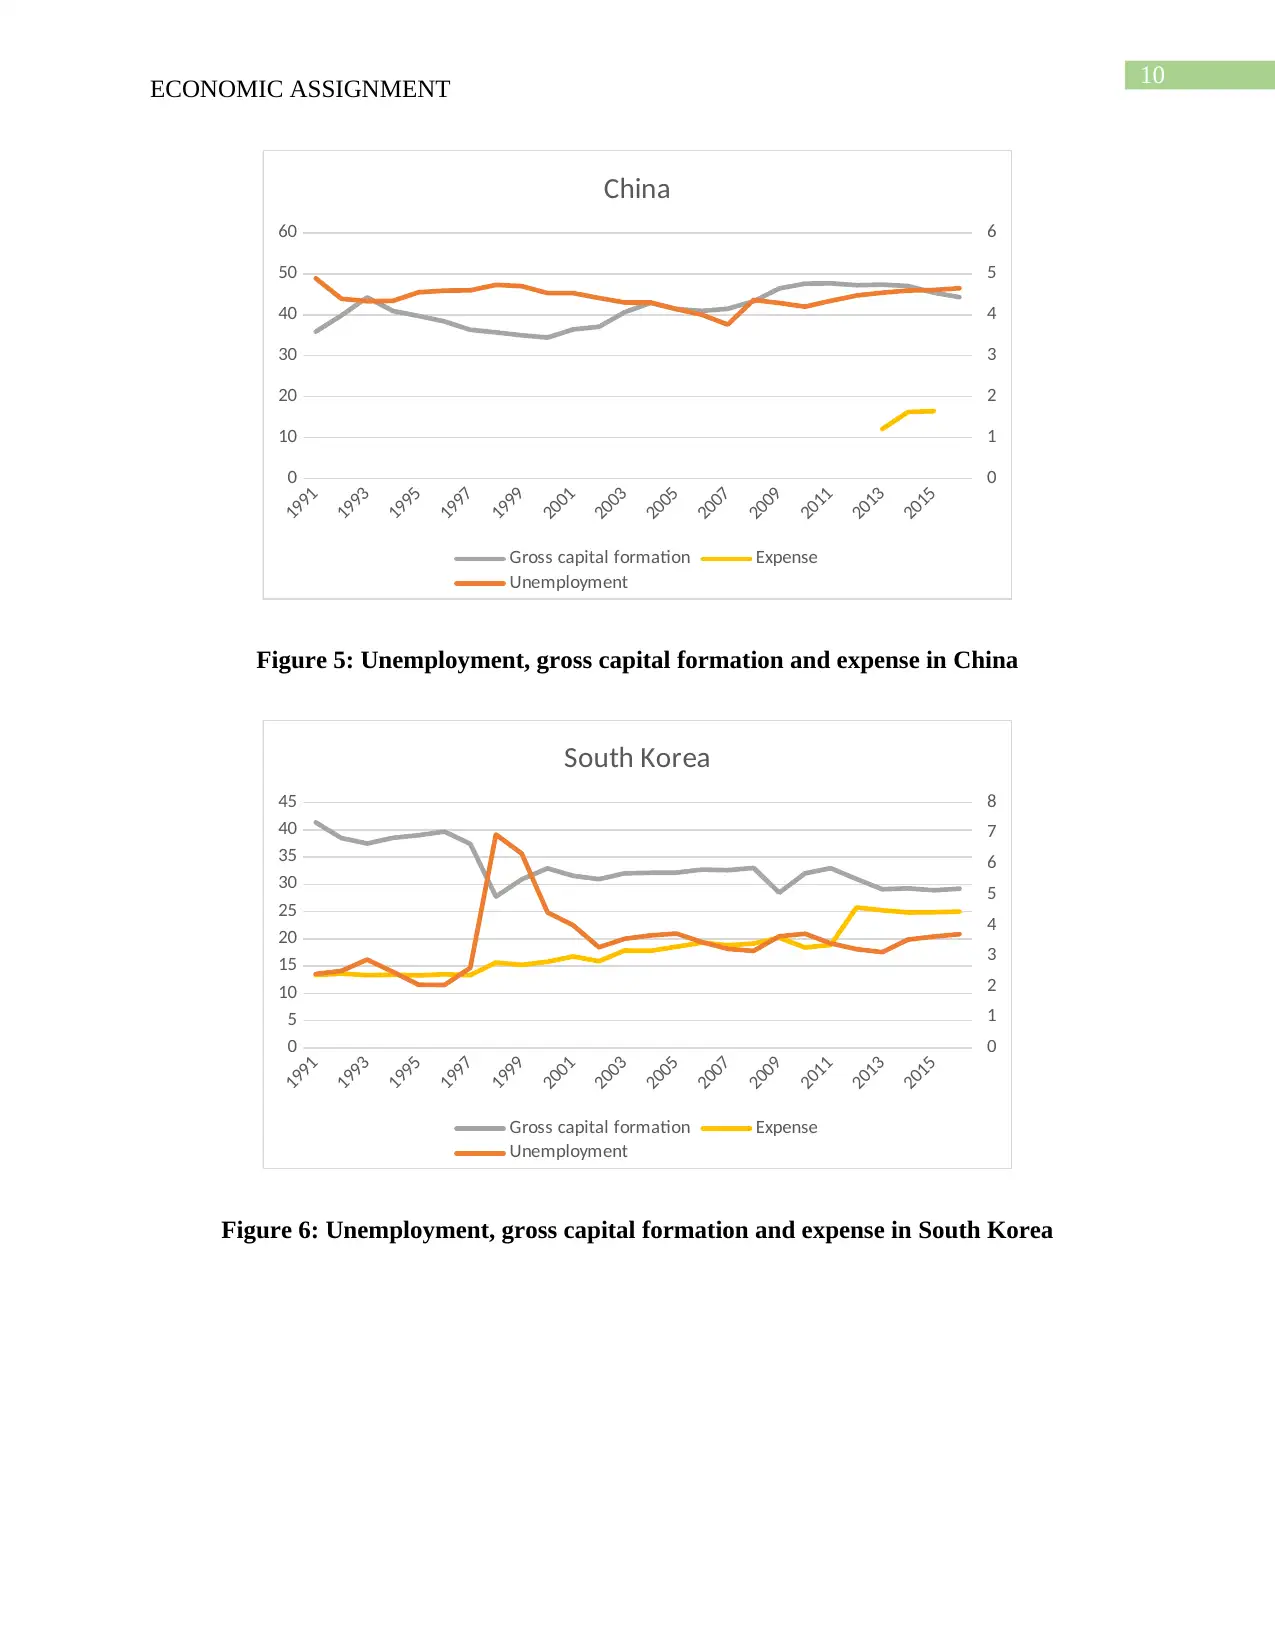
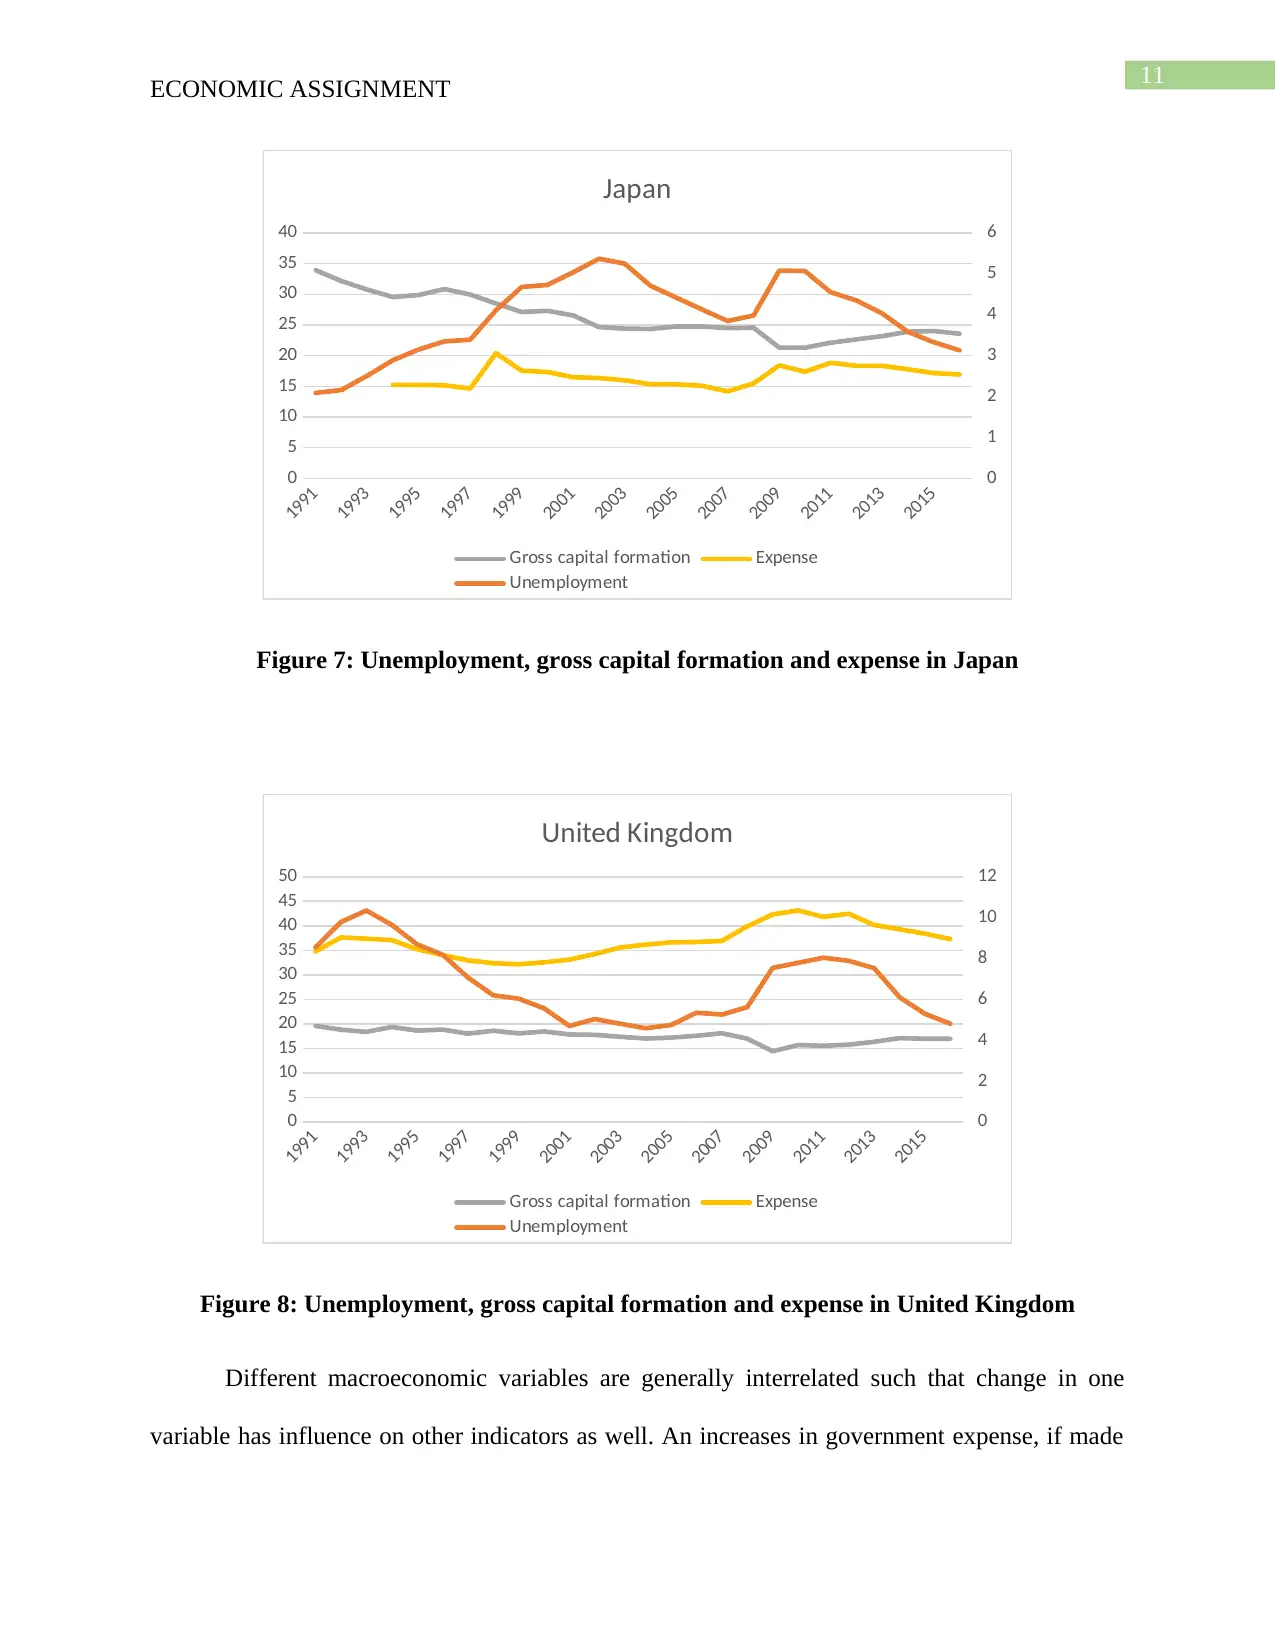
This economics assignment provides a detailed analysis of key macroeconomic indicators, including nominal and real GDP, inflation, unemployment, gross capital formation, and government expenditure across several countries (Australia, China, South Korea, Japan, and the United Kingdom) from 1990 to 2016. The assignment uses data from sources like the Australian Bureau of Statistics and the World Bank to present trends and interrelationships between these variables. It discusses how changes in government expenditure and capital formation influence employment opportunities and unemployment rates. Furthermore, the assignment includes a career education component, outlining the student's desired job role as a policy analyst, explaining the reasons for choosing this role, interpreting a relevant video, and providing a plan of action for achieving their career goals. Desklib offers a wealth of similar solved assignments and past papers for students seeking additional resources.
Document Page
Running Head: ECONOMIC ASSIGNMENT
Economic Assignment
Name of the Student
Name of the University
Course ID
tabler-icon-diamond-filled.svg

Paraphrase This Document

Need a fresh take? Get an instant paraphrase of this document with our AI Paraphraser
Document Page
1
ECONOMIC ASSIGNMENT
Table of Contents
Part A...............................................................................................................................................2
Answer 1......................................................................................................................................2
Answer 2......................................................................................................................................3
Answer 3....................................................................................................................................11
Part B.............................................................................................................................................13
Answer 4....................................................................................................................................13
Answer 5....................................................................................................................................14
Part C.............................................................................................................................................17
Introduction................................................................................................................................17
Job Role Desired........................................................................................................................18
Why I chose the role of a policy analyst?..................................................................................18
Video Interpretation...................................................................................................................19
Plan of Action............................................................................................................................20
References......................................................................................................................................21
Document Page
2
ECONOMIC ASSIGNMENT
Part A
Answer 1
Dec-1990
Dec-1991
Dec-1992
Dec-1993
Dec-1994
Dec-1995
Dec-1996
Dec-1997
Dec-1998
Dec-1999
Dec-2000
Dec-2001
Dec-2002
Dec-2003
Dec-2004
Dec-2005
Dec-2006
Dec-2007
Dec-2008
Dec-2009
Dec-2010
Dec-2011
Dec-2012
Dec-2013
Dec-2014
Dec-2015
Dec-2016
0
100000
200000
300000
400000
500000
Nominal and Real GDP
Nominal GDP Real GDP
Year
GDP
Figure 1: Nominal and Real GDP
(Source: abs.gov.au 2018)
Dec-1990
Feb-1992
Apr-1993
Jun-1994
Aug-1995
Oct-1996
Dec-1997
Feb-1999
Apr-2000
Jun-2001
Aug-2002
Oct-2003
Dec-2004
Feb-2006
Apr-2007
Jun-2008
Aug-2009
Oct-2010
Dec-2011
Feb-2013
Apr-2014
Jun-2015
Aug-2016
-2
0
2
4
GDP Growth
Real GDP Nominal GDP
Quarters
Growth (%)
Figure 2: Trend in nominal and real GDP growth rate
(Source: abs.gov.au 2018)
Document Page
3
ECONOMIC ASSIGNMENT
Nominal GDP of nation represents the monetary values of all goods and services
produced in a year where goods are valued in terms of current market price. Real GDP on the
other hand in price adjusted measure of total output in a nation. A fixed base year is used to
compute real GDP of the nation. An increase in nominal GDP tend to increases the value of real
GDP given the price level is fairly stable (Goodwin et al. 2015). For Australia, the seasonally
adjusted real GDP and nominal GDP constitutes a similar upward rising trend. The real GDP lies
above the nominal GDP implying a decline in the price level. So far as the growth rate is
concerned, similar trend in observed in percentage change in real and nominal GDP. The
nominal GDP growth thus has a positive influence on real GDP.
Answer 2
Table 1: Inflation, unemployment, gross capital formation and expense in Australia
Australia
Year Inflation Unemployment Gross capital formation Expense
199
1 3.222679913 9.579999924 24.22299997 23.1593187
199
2 0.985915493 10.72999954 22.3441433 24.42396422
199
3 1.813110181 10.86999989 23.59408776 24.94978282
199
4 1.894977169 9.720000267 24.25033711 25.06025128
199
5 4.638135783 8.470000267 25.93691424 25.37035171
199
6 2.6124197 8.510000229 24.77917213 24.53408057
199
7 0.250417362 8.359999657 24.7971273 23.78070009
199
8 0.853455454 7.679999828 25.46564777 21.32156079
199
9 1.465428277 6.869999886 26.09806763 24.53381643
200 4.475183076 6.28000021 26.27650167 24.07095833
tabler-icon-diamond-filled.svg

Paraphrase This Document

Need a fresh take? Get an instant paraphrase of this document with our AI Paraphraser
Document Page
4
ECONOMIC ASSIGNMENT
0
200
1 4.380841121 6.739999771 23.42282754 26.3303033
200
2 3.00317105 6.369999886 24.39965103 26.44611444
200
3 2.770735241 5.929999828 25.9254454 25.8340018
200
4 2.343612335 5.389999866 27.06087433 25.67329182
200
5 2.668732782 5.03000021 27.4254073 25.61578597
200
6 3.538487339 4.78000021 27.65794856 24.92062761
200
7 2.332361516 4.380000114 27.84585816 24.47849996
200
8 4.352643242 4.230000019 29.12600769 24.31734064
200
9 1.82011224 5.559999943 27.90602567 26.482355
201
0 2.845225682 5.210000038 27.5528937 26.77540331
201
1 3.303850156 5.079999924 27.11341551 25.96923518
201
2 1.762780156 5.21999979 28.32663311 26.24604405
201
3 2.449888641 5.659999847 28.44050751 25.98320556
201
4 2.487922705 6.070000172 27.20492597 26.40565053
201
5 1.508366722 6.059999943 26.73764514 26.86225739
201
6 1.276990945 5.71999979 25.53702298 27.03986551
(Source: data.worldbank.org)
Table 2: Inflation, unemployment, gross capital formation and expense in China
China
Year Inflation Unemployment Gross capital formation Expense
1991 3.556686 4.889999866 35.8658256
1992 6.353981 4.389999866 39.83722181
1993 14.61008 4.329999924 44.24292895
1994 24.25734 4.340000153 40.94850525
1995 16.78945 4.550000191 39.68463866
Document Page
5
ECONOMIC ASSIGNMENT
1996 8.312847 4.590000153 38.37235534
1997 2.787113 4.599999905 36.33715573
1998 -0.84954 4.730000019 35.67868627
1999 -1.35851 4.699999809 34.96477981
2000 0.256518 4.53000021 34.42965254
2001 0.719808 4.53000021 36.42225471
2002 -0.76672 4.409999847 37.07754181
2003 1.164518 4.300000191 40.63154952
2004 3.888816 4.300000191 42.89449013
2005 1.813995 4.139999866 41.3912114
2006 1.466078 4 40.93327269
2007 4.767211 3.75999999 41.46315155
2008 5.843024 4.360000134 43.26637446
2009 -0.70063 4.288000107 46.44130408
2010 3.325775 4.199999809 47.61226023
2011 5.410918 4.340000153 47.68586754
2012 2.643052 4.46999979 47.23453111
2013 2.628086 4.539999962 47.38775199 12.03064
2014 2.000345 4.592999935 47.00771662 16.22836
2015 1.437025 4.605000019 45.40088041 16.42522
2016 2 4.649000168 44.31060661
(Source: data.worldbank.org)
Table 3: Inflation, unemployment, gross capital formation and expense in South Korea
South Korea
Year Inflation Unemployment Gross capital formation Expense
1991 9.3 2.410000086 41.37406165 13.3792593
1992 6.306306 2.50999999 38.48519801 13.62914127
1993 4.745763 2.880000114 37.47954115 13.33489425
1994 6.256742 2.480000019 38.5391289 13.41987061
1995 4.479695 2.059999943 39.0032945 13.29596568
1996 4.923429 2.049999952 39.68096241 13.51745684
1997 4.446869 2.609999895 37.42467905 13.33786873
1998 7.51208 6.960000038 27.76189528 15.64550787
1999 0.811448 6.340000153 30.91629559 15.22116193
2000 2.265333 4.420000076 32.9417149 15.78950954
2001 4.06642 4 31.55958695 16.77824298
2002 2.762511 3.279999971 30.93958059 15.90158752
2003 3.514879 3.559999943 32.01490957 17.86543884
2004 3.590591 3.670000076 32.11707412 17.80394405
Document Page
6
ECONOMIC ASSIGNMENT
2005 2.75409 3.730000019 32.16306462 18.54888028
2006 2.241847 3.450000048 32.70068793 19.31135155
2007 2.534847 3.230000019 32.57953116 18.82266703
2008 4.673796 3.160000086 33.01850389 19.14187425
2009 2.756686 3.640000105 28.4656577 20.20127708
2010 2.939181 3.720000029 32.02287506 18.42542179
2011 4.025846 3.410000086 32.95883261 18.90133685
2012 2.187221 3.220000029 31.00122857 25.75391299
2013 1.301377 3.119999886 29.10221685 25.23258321
2014 1.2748 3.529999971 29.27691005 24.84029804
2015 0.706963 3.630000114 28.91811192 24.89953205
2016 0.97 3.710000038 29.20956543 24.98822488
(Source: data.worldbank.org)
Table 4: Inflation, unemployment, gross capital formation and expense in Japan
Japan
Year Inflation
Unemploymen
t
Gross capital
formation Expense
1991 3.29806 2.09 33.93257
1992 1.707359 2.16 32.16449
1993 1.267416 2.51 30.7764
1994 0.68794 2.89 29.54486 15.23929
1995 -0.12348 3.15 29.88286 15.22473
1996 0.131872 3.35 30.86515 15.1676
1997 1.761462 3.39 29.951 14.63257
1998 0.663269 4.11 28.51517 20.39496
1999 -0.32945 4.68 27.11881 17.542
2000 -0.65302 4.73 27.30713 17.34241
2001 -0.74006 5.04 26.56051 16.46877
2002 -0.92349 5.37 24.6555 16.36226
2003 -0.25654 5.25 24.39723 15.97741
2004 -0.00857 4.71 24.34862 15.34087
2005 -0.28295 4.42 24.74947 15.31547
2006 0.249355 4.13 24.74863 15.07756
2007 0.060039 3.85 24.48345 14.17419
2008 1.380079 3.98 24.54785 15.46619
2009 -1.35284 5.08 21.32367 18.40497
2010 -0.71998 5.07 21.29749 17.39946
2011 -0.26763 4.55 22.1033 18.8211
2012 -0.05194 4.35 22.65442 18.33817
2013 0.34644 4.03 23.19091 18.34244
tabler-icon-diamond-filled.svg

Paraphrase This Document

Need a fresh take? Get an instant paraphrase of this document with our AI Paraphraser
Document Page
7
ECONOMIC ASSIGNMENT
2014 2.761954 3.58 23.9161 17.77248
2015 0.789518 3.33 24.0053 17.14929
2016 -0.11667 3.13 23.56428 16.93938
(Source: data.worldbank.org)
Table 5: Inflation, unemployment, gross capital formation and expense in United Kingdom
United Kingdom
Yea
r
Inflatio
n
Unemployme
nt
Gross capital
formation
Expens
e
199
1
7.5326
49 8.55 19.59018
34.784
08
199
2
4.2615
48 9.78 18.83031
37.640
63
199
3 2.5065 10.35 18.37509
37.368
98
199
4
1.9784
9 9.65 19.37552
37.079
77
199
5
2.6564
52 8.69 18.63725
35.246
09
199
6
2.4811
01 8.19 18.84126
34.029
47
199
7
1.7779
46 7.07 18.01168
32.962
9
199
8
1.5889
24 6.2 18.62629
32.368
98
199
9
1.3354
07 6.04 18.0644
32.168
04
200
0
0.7852
69 5.56 18.46573
32.548
79
200
1
1.2358
95 4.7 17.8566
33.122
53
200
2
1.2561
92 5.04 17.76296
34.233
08
200
3
1.3629
22 4.81 17.38414
35.583
66
200
4
1.3445
96 4.59 17.02408
36.162
53
200
5
2.0496
68 4.75 17.21945
36.633
3
200
6
2.3335
28 5.35 17.59422
36.708
77
200
7
2.3210
36 5.26 18.11053
36.922
55
200 3.6134 5.62 16.99368 39.879
Document Page
8
ECONOMIC ASSIGNMENT
8 99 88
200
9
2.1662
31 7.54 14.42836
42.317
41
201
0
3.2857
14 7.79 15.67951
43.106
65
201
1
4.4842
4 8.04 15.55917
41.832
05
201
2
2.8217
1 7.89 15.75748
42.469
23
201
3
2.5545
47 7.53 16.35796
40.158
76
201
4
1.4601
92 6.11 17.11075
39.284
58
201
5
0.0500
21 5.3 16.97235
38.416
41
201
6
0.6416
13 4.81 16.96858
37.299
29
(Source: data.worldbank.org)
Document Page
9
ECONOMIC ASSIGNMENT
1991
1993
1995
1997
1999
2001
2003
2005
2007
2009
2011
2013
2015-5
0
5
10
15
20
25
30
Inflation
Inflation (AUS) Inflation (China) Inflation (South Korea
Inflation (Japan) Inflation (UK)
Year
Inflation rate
Figure 3: Inflation rate for all the five countries
1991
1993
1995
1997
1999
2001
2003
2005
2007
2009
2011
2013
2015
0
2
4
6
8
10
12
0
5
10
15
20
25
30
35
Australia
Unemployment Gross capital formation
Expense
Figure 4: Unemployment, gross capital formation and expense in Australia
tabler-icon-diamond-filled.svg

Paraphrase This Document

Need a fresh take? Get an instant paraphrase of this document with our AI Paraphraser
Document Page
10
ECONOMIC ASSIGNMENT
1991
1993
1995
1997
1999
2001
2003
2005
2007
2009
2011
2013
2015
0
10
20
30
40
50
60
0
1
2
3
4
5
6
China
Gross capital formation Expense
Unemployment
Figure 5: Unemployment, gross capital formation and expense in China
1991
1993
1995
1997
1999
2001
2003
2005
2007
2009
2011
2013
2015
0
5
10
15
20
25
30
35
40
45
0
1
2
3
4
5
6
7
8
South Korea
Gross capital formation Expense
Unemployment
Figure 6: Unemployment, gross capital formation and expense in South Korea
Document Page
11
ECONOMIC ASSIGNMENT
1991
1993
1995
1997
1999
2001
2003
2005
2007
2009
2011
2013
2015
0
5
10
15
20
25
30
35
40
0
1
2
3
4
5
6
Japan
Gross capital formation Expense
Unemployment
Figure 7: Unemployment, gross capital formation and expense in Japan
1991
1993
1995
1997
1999
2001
2003
2005
2007
2009
2011
2013
2015
0
5
10
15
20
25
30
35
40
45
50
0
2
4
6
8
10
12
United Kingdom
Gross capital formation Expense
Unemployment
Figure 8: Unemployment, gross capital formation and expense in United Kingdom
Different macroeconomic variables are generally interrelated such that change in one
variable has influence on other indicators as well. An increases in government expense, if made
chevron_up_icon
1 out of 23
circle_padding
hide_on_mobile
zoom_out_icon
[object Object]