MAE203: Global Economy Assignment - Trimester 2, 2019
VerifiedAdded on 2022/11/14
|13
|2974
|257
Report
AI Summary
This report provides an analysis of the global economy, focusing on macroeconomic indicators and policies. The assignment examines the trends of cash rates in Australia from 1996 to 2016, and the impact of monetary policy decisions by the Reserve Bank of Australia (RBA). It further analyzes inflation, unemployment, and real GDP growth rates in Australia, the United States, and Japan. The report also delves into the RBA's concerns regarding China's corporate debt and its potential impact on Australia's economy, including the interaction between aggregate expenditure and real GDP. The report concludes with a discussion on how Australia can achieve full employment. The analysis includes graphical representations and interpretations of data, demonstrating an understanding of key macroeconomic concepts in a global context and the role of monetary policy.
ECONOMICS 1
Global Economy
Student’s name
Course
Institutional affiliation
Instructor’s name
City and state
Date
Global Economy
Student’s name
Course
Institutional affiliation
Instructor’s name
City and state
Date
Paraphrase This Document
Need a fresh take? Get an instant paraphrase of this document with our AI Paraphraser
ECONOMICS 2
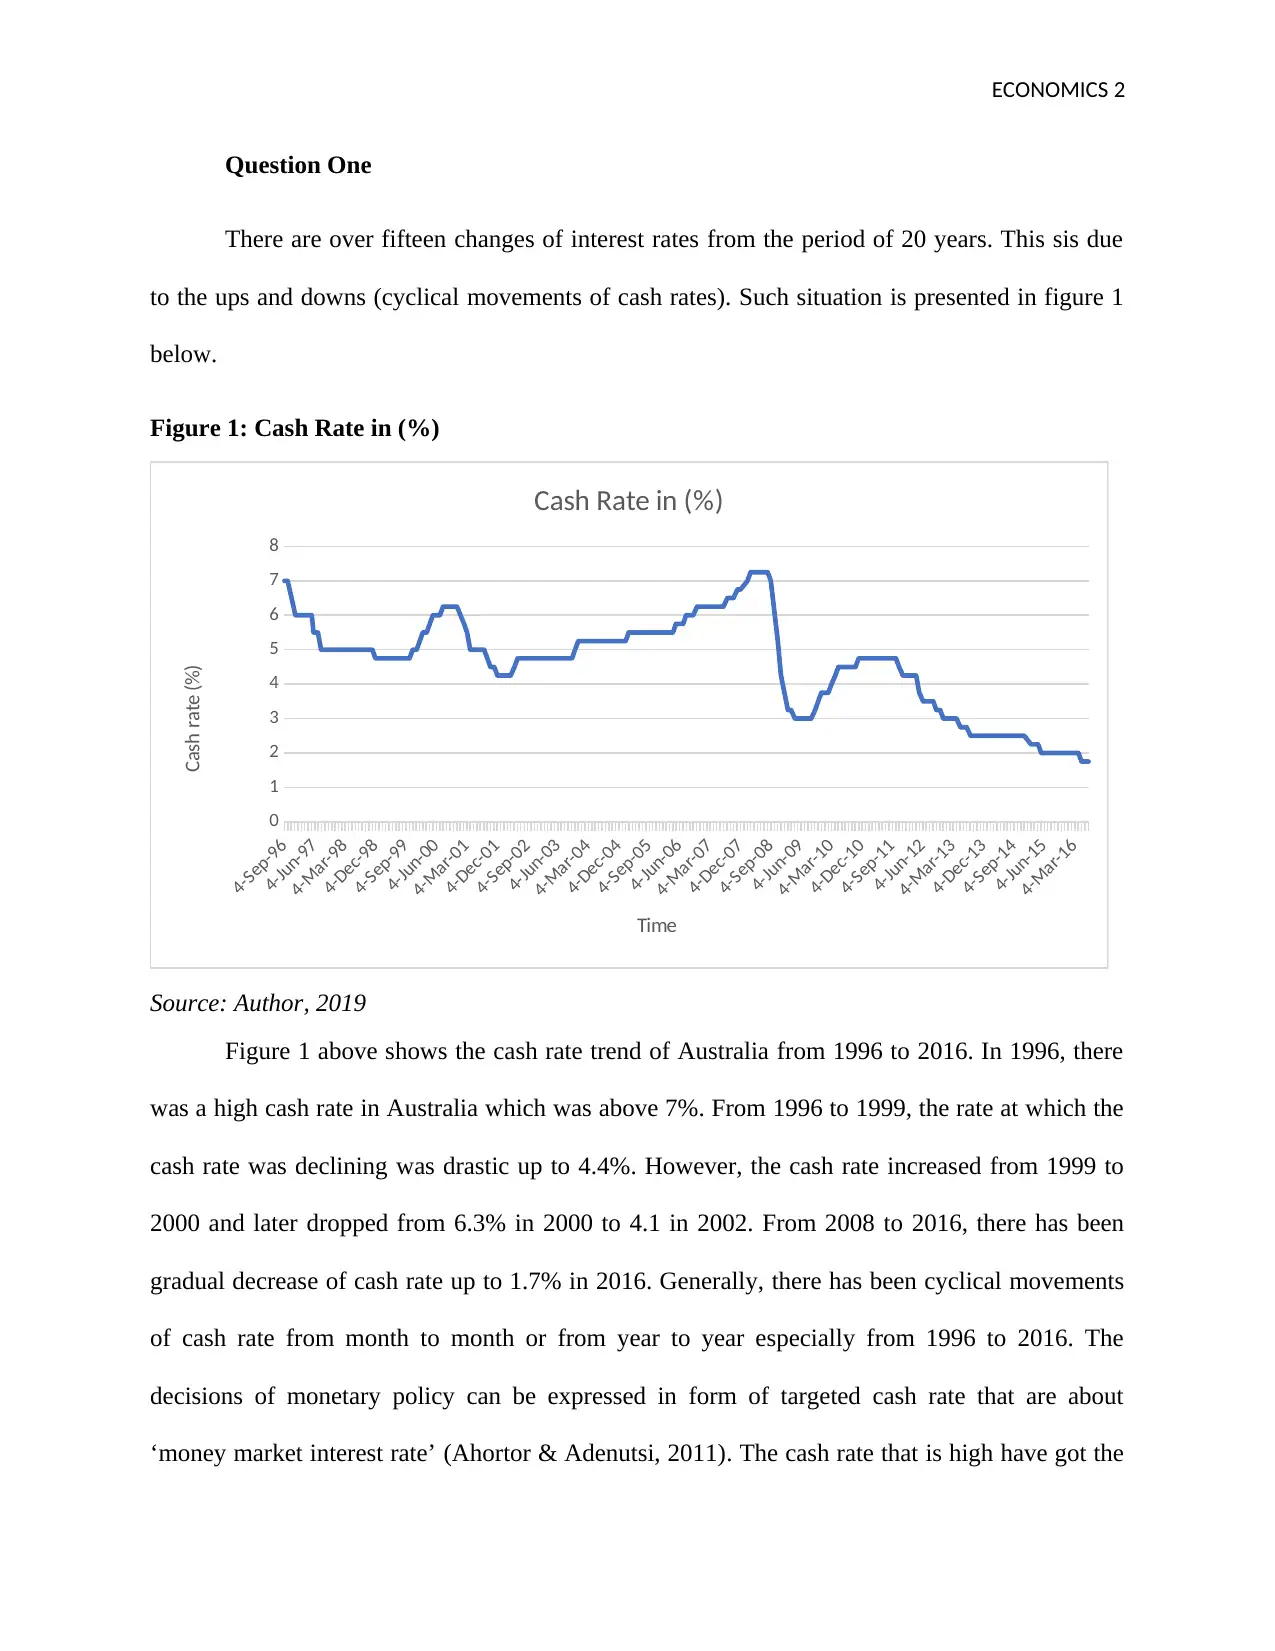
Question One
There are over fifteen changes of interest rates from the period of 20 years. This sis due
to the ups and downs (cyclical movements of cash rates). Such situation is presented in figure 1
below.
Figure 1: Cash Rate in (%)
4-Sep-96
4-Jun-97
4-Mar-98
4-Dec-98
4-Sep-99
4-Jun-00
4-Mar-01
4-Dec-01
4-Sep-02
4-Jun-03
4-Mar-04
4-Dec-04
4-Sep-05
4-Jun-06
4-Mar-07
4-Dec-07
4-Sep-08
4-Jun-09
4-Mar-10
4-Dec-10
4-Sep-11
4-Jun-12
4-Mar-13
4-Dec-13
4-Sep-14
4-Jun-15
4-Mar-16
0
1
2
3
4
5
6
7
8
Cash Rate in (%)
Time
Cash rate (%)
Source: Author, 2019
Figure 1 above shows the cash rate trend of Australia from 1996 to 2016. In 1996, there
was a high cash rate in Australia which was above 7%. From 1996 to 1999, the rate at which the
cash rate was declining was drastic up to 4.4%. However, the cash rate increased from 1999 to
2000 and later dropped from 6.3% in 2000 to 4.1 in 2002. From 2008 to 2016, there has been
gradual decrease of cash rate up to 1.7% in 2016. Generally, there has been cyclical movements
of cash rate from month to month or from year to year especially from 1996 to 2016. The
decisions of monetary policy can be expressed in form of targeted cash rate that are about
‘money market interest rate’ (Ahortor & Adenutsi, 2011). The cash rate that is high have got the
ECONOMICS 3
flow on effect about lifting interest rates on ‘credit cards’, mortgage repayments and loans. This
therefore leaves the customers with low amounts to be saved or consumed. It is evident that,
when cash rate increases, the repayments of debt are likely to go high. This therefore discourages
individuals who do not possess loans from getting one (Kan & Omay, 2010) When the Reserve
Bank of Australia (RBA) increases the cash rate, it is done in order to apply conditions about
demand growth and the inflation levels (Lowe, 2019). Besides, high interest rates tend to be a
restraint factor of the growth of lending behaviour thus creating negative influence of ‘demand
and inflation’. On the other hand, when there is a fall of cash rate, RBA tries to improve
economic activities and inflation in order to encourage spending of consumers and investments
in the businesses (Chang & Chiang, 2011). However, interest rate tends to encourage households
to get money instead of saving thus improving on the economic activity. For the case of property
owners, reduced interest rates decrease their repayments which result into increased disposable
income (Lowe, 2019). When the cost of borrowing is low, this may encourage individuals to get
more loans to get luxuries and also to invest so as to boom the economic activities in Australia.
Question Two
This section provides the trend of inflation real economic growth and unemployment
rates among three countries of Australia, Japan and United States of America. Each country has
got a target to achieve through which such economic indicators can be maintained to reach the
set objective (Bittencourt, 2012). Besides, each country has got the central bank and reserve
banks that regulate the level of activities roaming in the economy (Raphael et al 2010). For
Australia, it is called the Reserve Bank of Australia (RBA) which has got its objective of
regulating inflation rates and exhausting unemployment rates.
⊘ This is a preview!⊘
Do you want full access?
Subscribe today to unlock all pages.
Trusted by 1+ million students worldwide
ECONOMICS 4
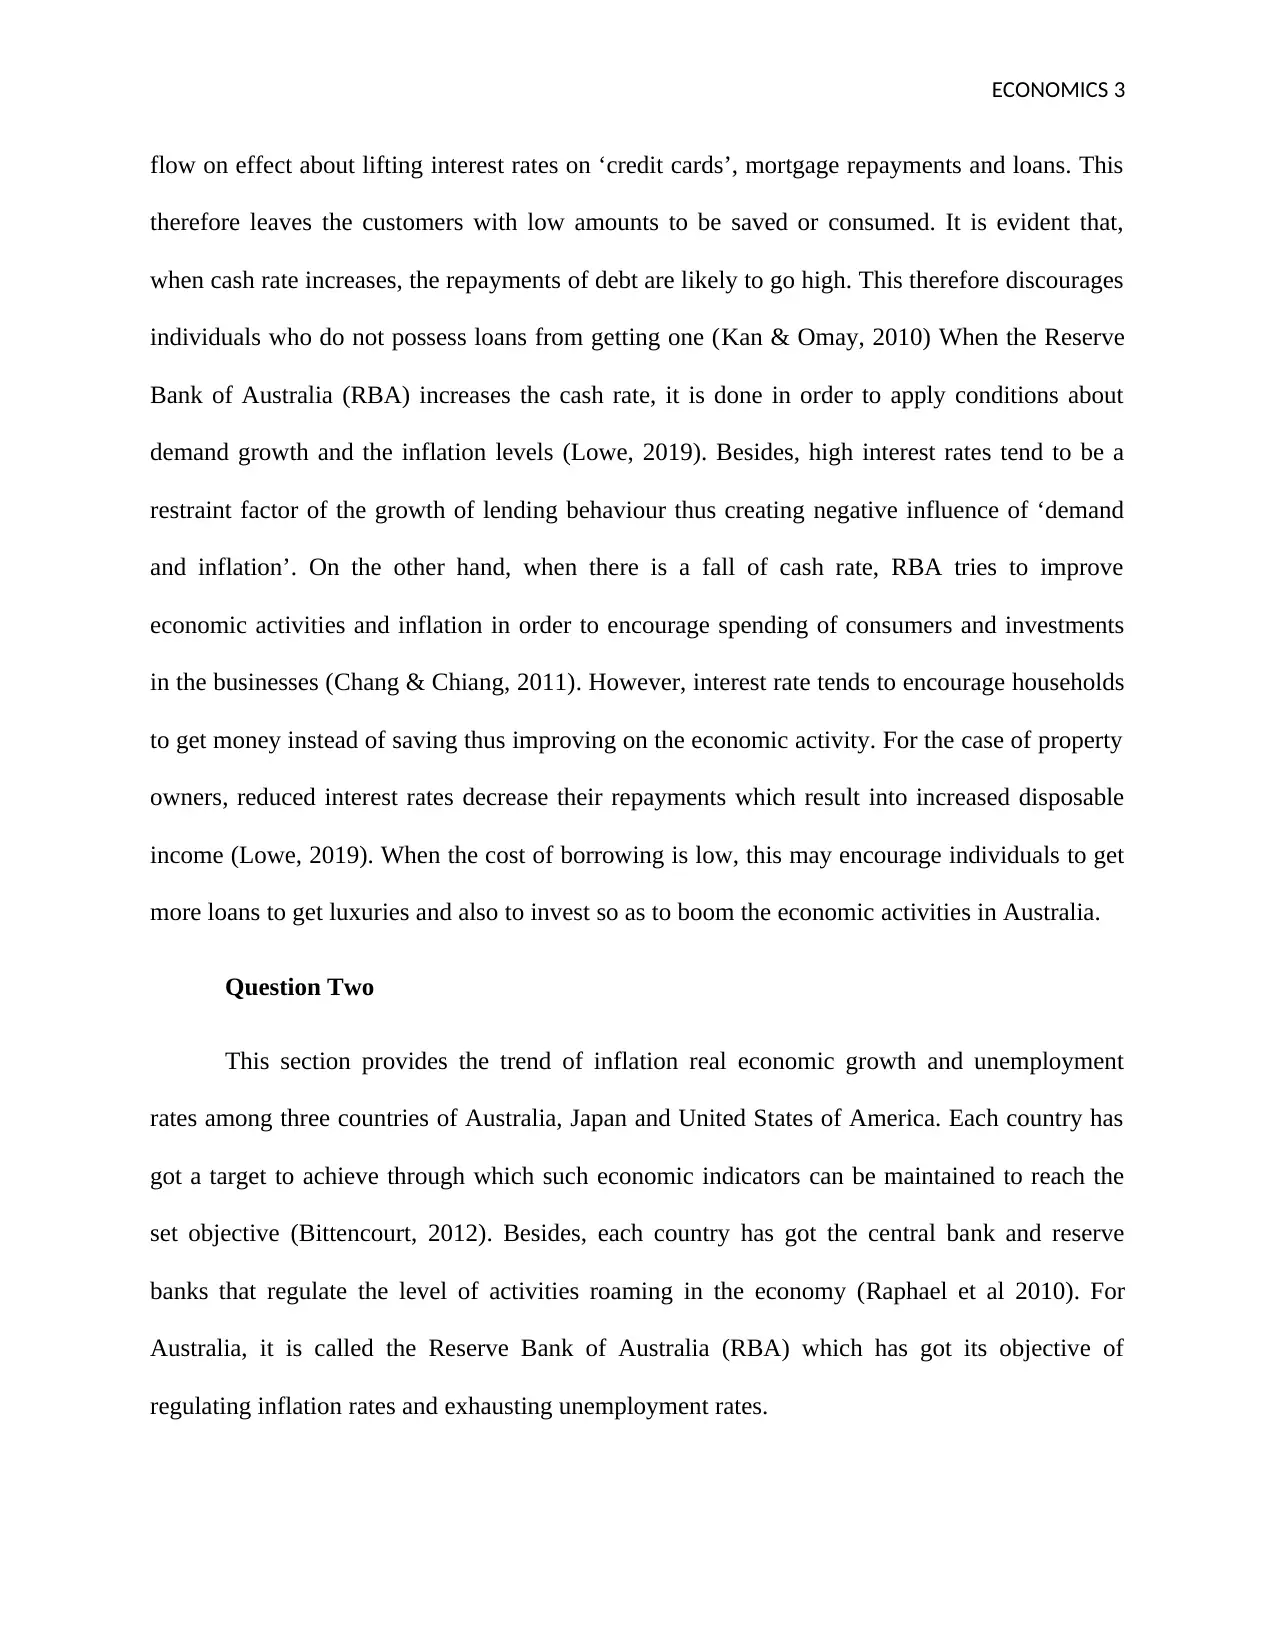
Figure 2: Australia’s Inflation rate, unemployment rate and Real GDP growth rate
1 2 3 4 5 6 7 8 9 10-2.0%
0.0%
2.0%
4.0%
6.0%
8.0%
10.0%
12.0%
Australia's Economic Outlook (2009-2018)
GDP Inflation Unemployment
year
Economic indicators
Source: World Bank, 2019
Figure 2 shows the relationship between inflation, unemployment and real growth rates
of Australia’s economy. The figure shows that there was a high unemployment rate in 2009 up to
2011 evidenced by the percentages greater than 10%. However, rate of inflation reduced
gradually from 2011 to 2013 up to 1%. From 2013 to 2018, there has been a steady change of
employment rate as advocated by the RBA.
Figure 2 shows the trend real growth rates of Australia. There was the negative real
growth rate in 2009. The line graph shows a positive gradual change of real growth rate of
Australia. Also, the trend of inflation shows a gradual decline trend from the year of 2009 to
2018. This means that the RBA’s goals of regulating the level of economic activities
(unemployment, inflation and economic growth) are coming true since all the variables in the
study shows positive trend in relation to RBA objectives.
Paraphrase This Document
Need a fresh take? Get an instant paraphrase of this document with our AI Paraphraser
ECONOMICS 5
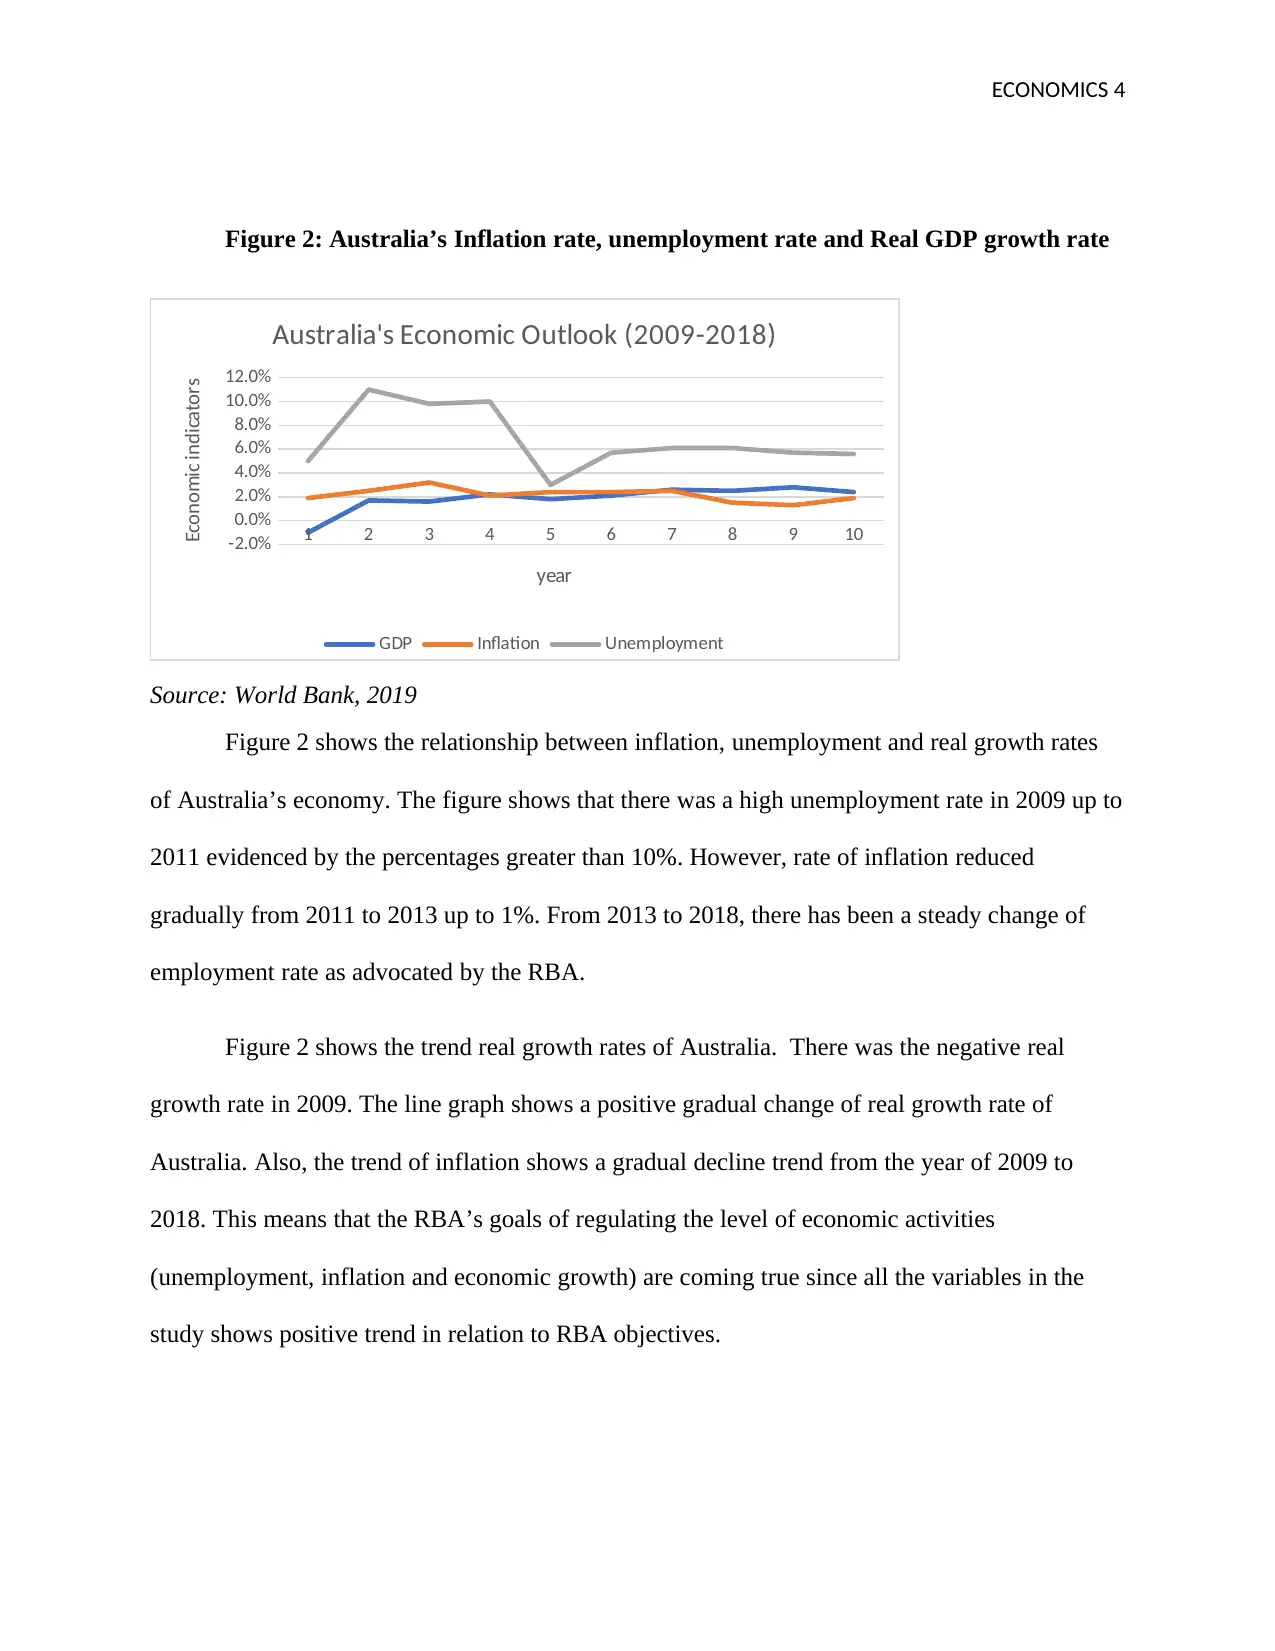
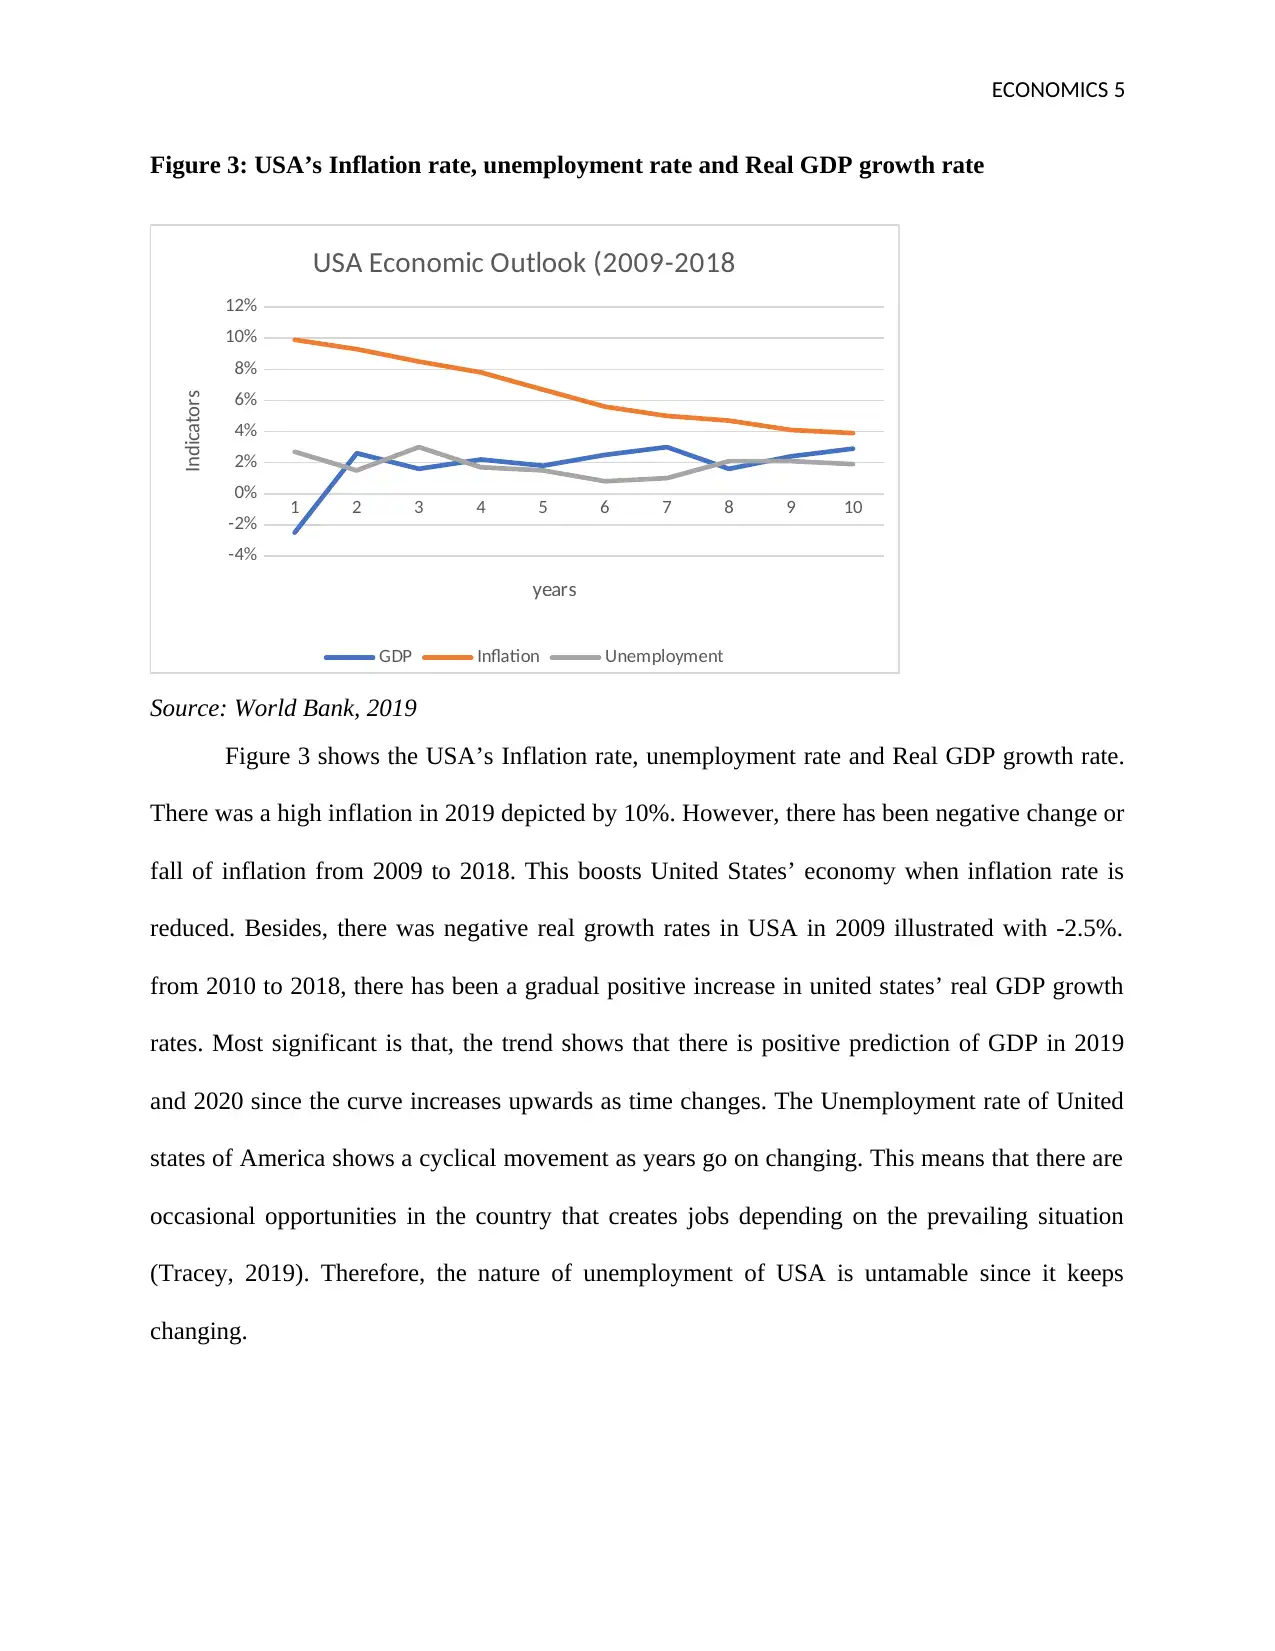
Figure 3: USA’s Inflation rate, unemployment rate and Real GDP growth rate
1 2 3 4 5 6 7 8 9 10
-4%
-2%
0%
2%
4%
6%
8%
10%
12%
USA Economic Outlook (2009-2018
GDP Inflation Unemployment
years
Indicators
Source: World Bank, 2019
Figure 3 shows the USA’s Inflation rate, unemployment rate and Real GDP growth rate.
There was a high inflation in 2019 depicted by 10%. However, there has been negative change or
fall of inflation from 2009 to 2018. This boosts United States’ economy when inflation rate is
reduced. Besides, there was negative real growth rates in USA in 2009 illustrated with -2.5%.
from 2010 to 2018, there has been a gradual positive increase in united states’ real GDP growth
rates. Most significant is that, the trend shows that there is positive prediction of GDP in 2019
and 2020 since the curve increases upwards as time changes. The Unemployment rate of United
states of America shows a cyclical movement as years go on changing. This means that there are
occasional opportunities in the country that creates jobs depending on the prevailing situation
(Tracey, 2019). Therefore, the nature of unemployment of USA is untamable since it keeps
changing.
ECONOMICS 6
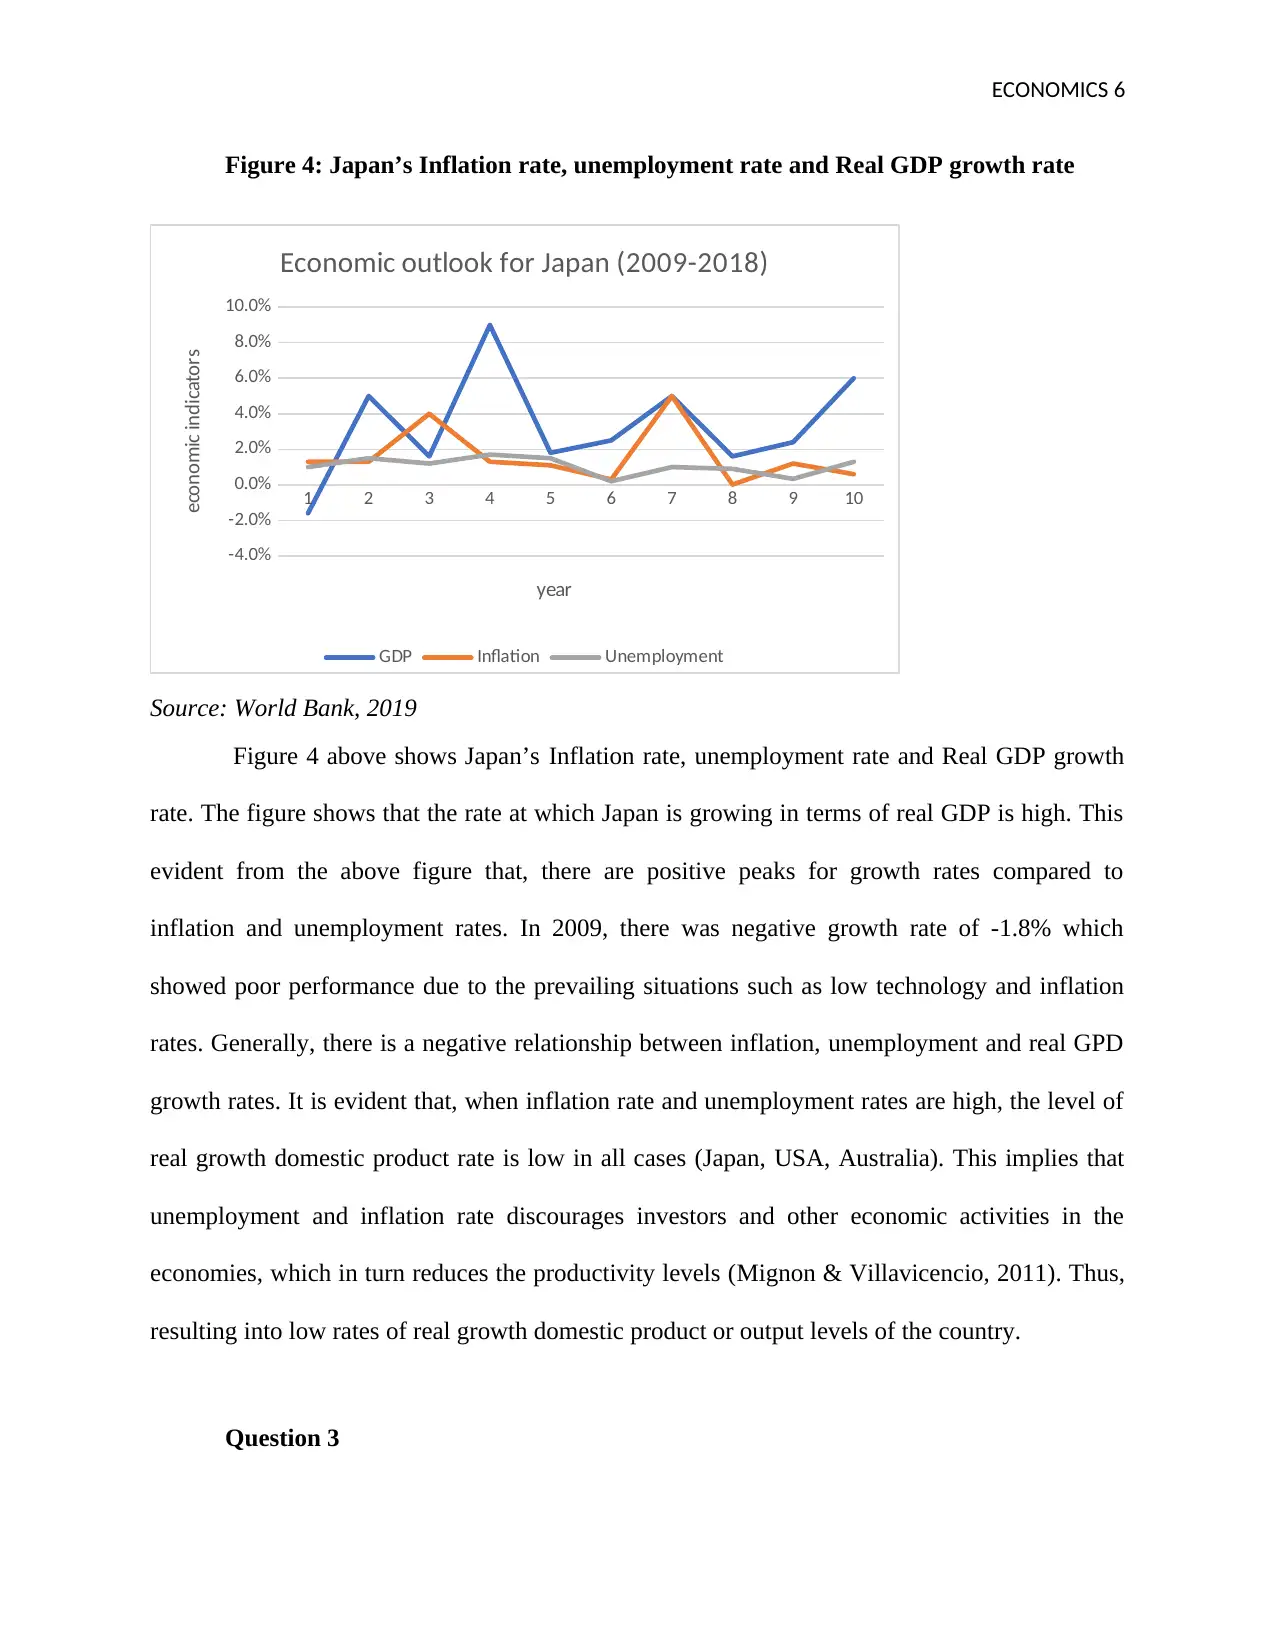
Figure 4: Japan’s Inflation rate, unemployment rate and Real GDP growth rate
1 2 3 4 5 6 7 8 9 10
-4.0%
-2.0%
0.0%
2.0%
4.0%
6.0%
8.0%
10.0%
Economic outlook for Japan (2009-2018)
GDP Inflation Unemployment
year
economic indicators
Source: World Bank, 2019
Figure 4 above shows Japan’s Inflation rate, unemployment rate and Real GDP growth
rate. The figure shows that the rate at which Japan is growing in terms of real GDP is high. This
evident from the above figure that, there are positive peaks for growth rates compared to
inflation and unemployment rates. In 2009, there was negative growth rate of -1.8% which
showed poor performance due to the prevailing situations such as low technology and inflation
rates. Generally, there is a negative relationship between inflation, unemployment and real GPD
growth rates. It is evident that, when inflation rate and unemployment rates are high, the level of
real growth domestic product rate is low in all cases (Japan, USA, Australia). This implies that
unemployment and inflation rate discourages investors and other economic activities in the
economies, which in turn reduces the productivity levels (Mignon & Villavicencio, 2011). Thus,
resulting into low rates of real growth domestic product or output levels of the country.
Question 3
⊘ This is a preview!⊘
Do you want full access?
Subscribe today to unlock all pages.
Trusted by 1+ million students worldwide
ECONOMICS 7
The reserve bank of Australia is more concerned with the corporate debt of china
compared to the Gross Domestic Product that is extremely more than for other economies that
are developed. China’s GDP is said to be three times higher than those countries having related
per capita income. Recently, RBA published an online article about China’s non-banking
financial institutions where the banks estimated the ‘banking shadow’ at 40 percent that is close
to 60 percent GDP (Balding, 2019). This only implies that China grows at the same rate with
already known developed countries like United Kingdom and United States. Nevertheless,
China’s economic growth is very slow and alarming to RBA due to a number of reasons and
some of these include; limited transparency, difference between maturity and liquidity, high level
of leverage, excessive lending to untrustworthy and risky customers in the banking sector. Also,
there is a problem of difficulty in taking ‘price risk’ by retail investors. RBA concludes that
policy makers in China are challenged to solve ‘systemic risks’ that are realized from shadow
finance minus reducing the benefits that come out of it. Too much regulation on lending terms of
China curtailed her growth (Balding, 2019). The issue that scares Reserve Bank of Australia is
that the authorities of China can no longer control its economic status and this is likely to force
China into a rapid down fall in its economic growth (Balding, 2019).
Figure 5: Aggregate expenditure and the Real GDP
Paraphrase This Document
Need a fresh take? Get an instant paraphrase of this document with our AI Paraphraser
ECONOMICS 8
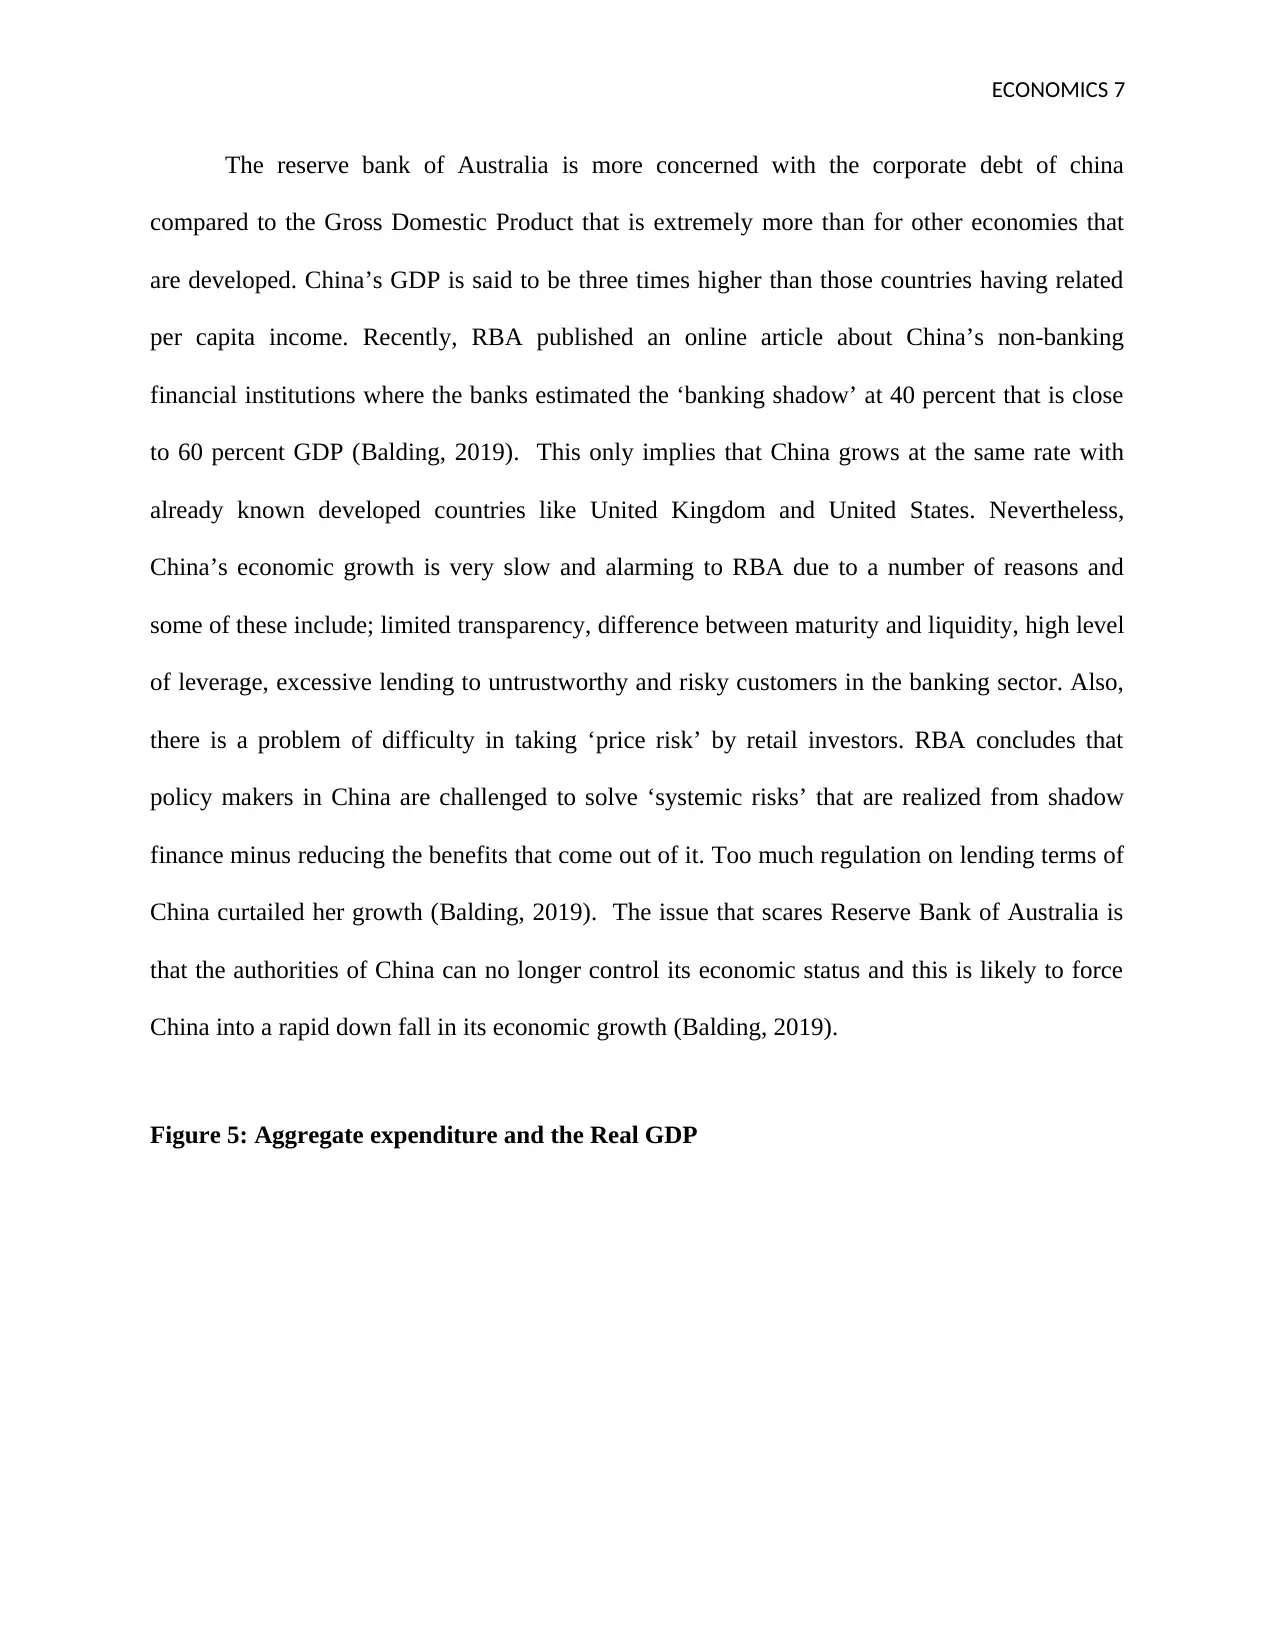
Source: The Keynesian academy
Figure 6 above indicates the interaction of Aggregate expenditure with the Real GDP.
When the aggregate expenditure curve interacts with the GDP curve at point E, the is equilibrium
observed between the country’s output and its expenditure. However, on the side of China
currently, the aggregate expenditure is more than its output (L). This indicates the slow growth
that exists in China. It is a socialist country and so the government controls all the economic
activities including the banking sector. Australia normally exports her commodities and has got
several investments in China due to its population. When the level of economic growth in China
declines, then RBA is likely to face a challenge of low interest rates and this worries the bank
(Ilikis, 2019). Most developed countries including Australia, Japan, South Korea and the rest
majorly rely on China for trade due to its population and its reduction in growth hits Australia
indirectly forcing her economic growth to decline. In the previous financial year, Australia
invested about a third of its ‘merchandise’ and $ 50 billion of iron ore in Asia particularly China
and this will affect her foreign exchange when China tends to reduce her growth rate. Some
ECONOMICS 9
reasons for the slowdown in China’s growth are a rapid population increase, strict Federal
Reserve and reduced birthrate (Amadeo, 2019).
Question 4:
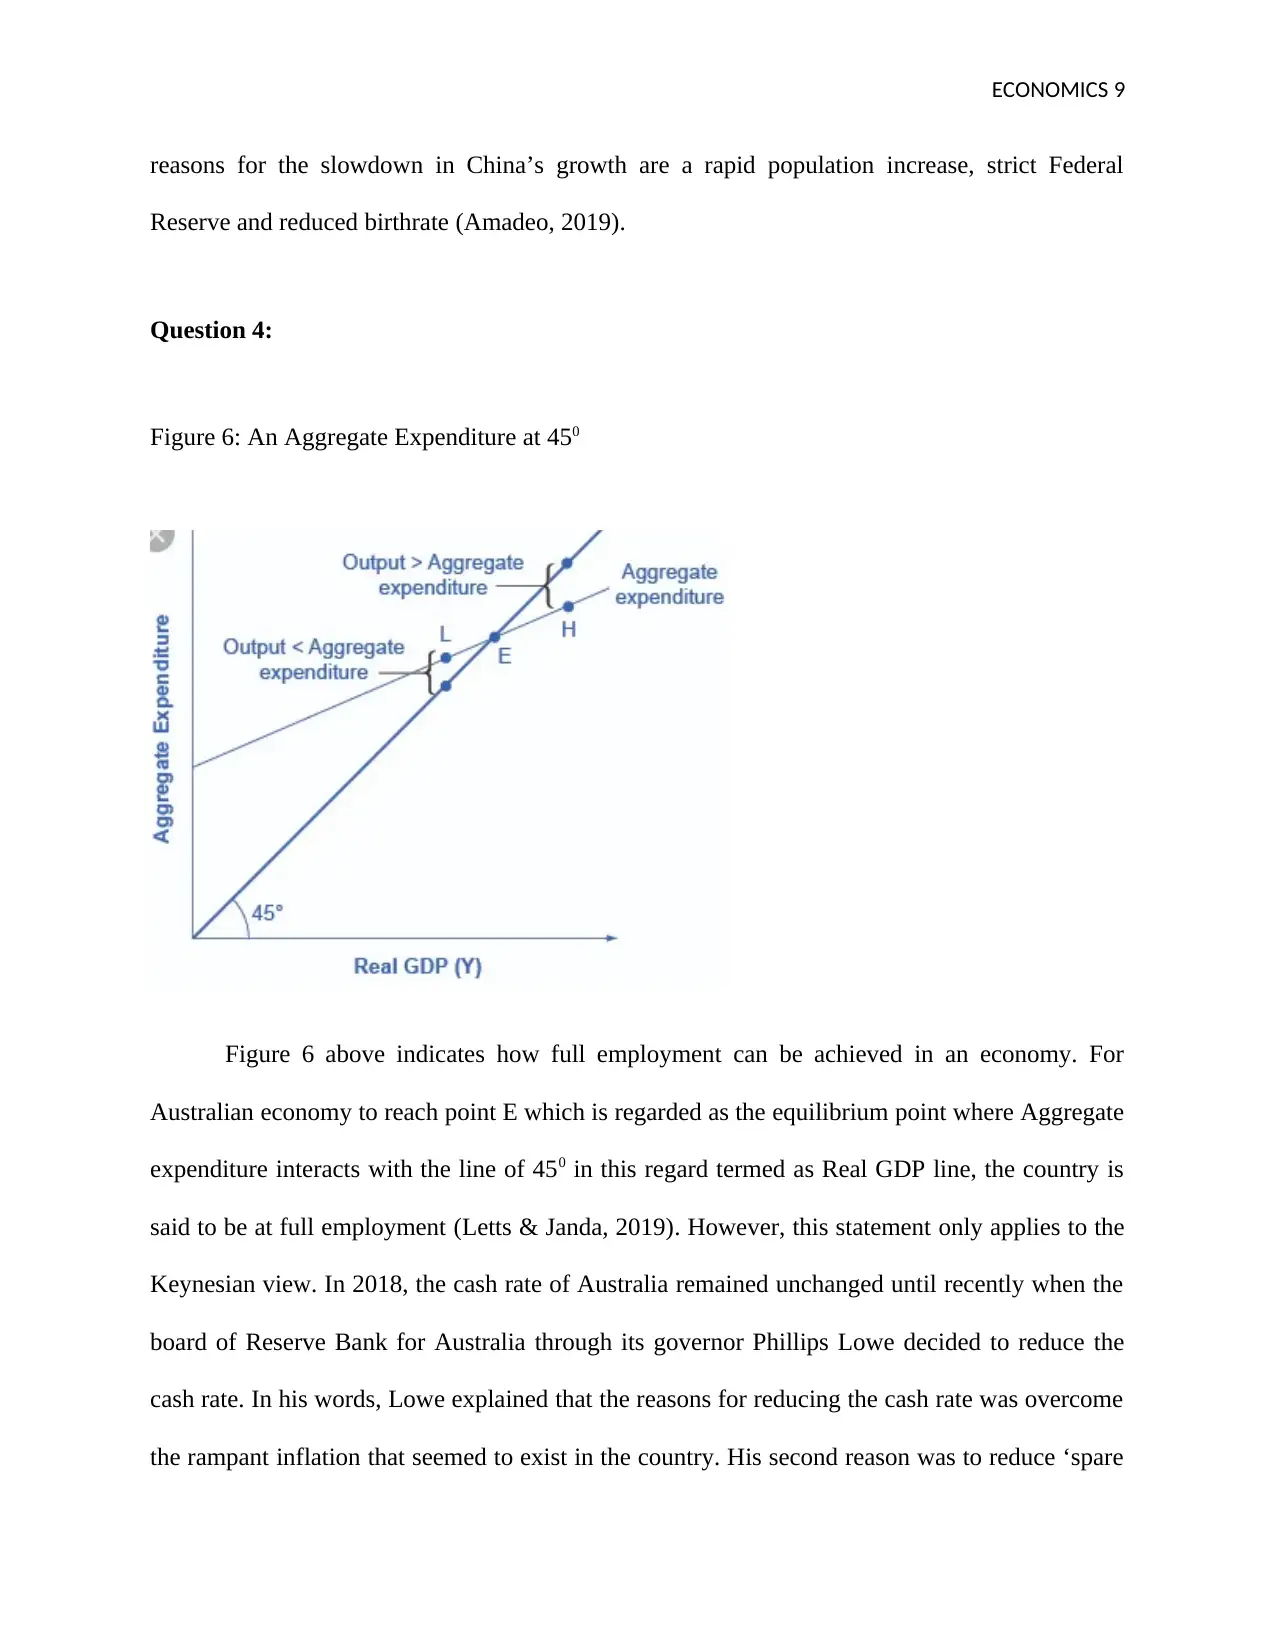
Figure 6: An Aggregate Expenditure at 450
Figure 6 above indicates how full employment can be achieved in an economy. For
Australian economy to reach point E which is regarded as the equilibrium point where Aggregate
expenditure interacts with the line of 450 in this regard termed as Real GDP line, the country is
said to be at full employment (Letts & Janda, 2019). However, this statement only applies to the
Keynesian view. In 2018, the cash rate of Australia remained unchanged until recently when the
board of Reserve Bank for Australia through its governor Phillips Lowe decided to reduce the
cash rate. In his words, Lowe explained that the reasons for reducing the cash rate was overcome
the rampant inflation that seemed to exist in the country. His second reason was to reduce ‘spare
reasons for the slowdown in China’s growth are a rapid population increase, strict Federal
Reserve and reduced birthrate (Amadeo, 2019).
Question 4:
Figure 6: An Aggregate Expenditure at 450
Figure 6 above indicates how full employment can be achieved in an economy. For
Australian economy to reach point E which is regarded as the equilibrium point where Aggregate
expenditure interacts with the line of 450 in this regard termed as Real GDP line, the country is
said to be at full employment (Letts & Janda, 2019). However, this statement only applies to the
Keynesian view. In 2018, the cash rate of Australia remained unchanged until recently when the
board of Reserve Bank for Australia through its governor Phillips Lowe decided to reduce the
cash rate. In his words, Lowe explained that the reasons for reducing the cash rate was overcome
the rampant inflation that seemed to exist in the country. His second reason was to reduce ‘spare
⊘ This is a preview!⊘
Do you want full access?
Subscribe today to unlock all pages.
Trusted by 1+ million students worldwide
ECONOMICS 10
capacity’ in the labour market of Australia. In the previous years, Australia’s output had declined
due to hiking of the cash rate where the borrowing capacity had declined making it difficult for
Australians to get loans for purchasing commodities and invest in production processes. This
prompted the bank to reduce the cash rate with an intension of creating a gap for people to
borrow from local banks. The level of government expenditure was high due to unemployment
and inflation on Australia’s market was rampant too. This implies that the country’s expenditure
had gone more than its output as indicated in the aggregate expenditure diagram above (L). The
‘subdued’ rates of inflation that still exist in the country are composed of stiff retailing
competition, low wages and slow increase in the housing rents (Letts & Janda, 2019). The
Australian March quarter CPI was very low and it was lower than the forecasted rate. In addition,
the wage data for the March quarter revealed that wages growth still remains subdued, although
it has began rising from a year ago. And the recent labour market report also confirmed that
strong employment growth is not making material inroads into spare capacity in the labour
market. The Board of RBA concluded that the accumulation of this further evidence meant that it
was now appropriate to adjust monetary policy thus a decrease in the cash rate. The major target
for the board of RBA to reduce the cash rate was to keep inflation between 2 percent and 3
percent. With such an intention, RBA was the first central bank in the globe to target a flexible
inflation rate and this has made the economic conditions of the country stable (Ilikis, 2019). The
board of Australian Reserve bank has been able to identify some factors that its functioning and
the only solution to overcome these factors was to reduce the cash rate. Some of these factors
include; unemployment, inflation, economic growth and the global financial standing.
Employment or unemployment rate is one of the strongest indicator of economic performance in
an economy and if unemployment rises, the Reserve Bank for Australia may employ lowering of
Paraphrase This Document
Need a fresh take? Get an instant paraphrase of this document with our AI Paraphraser
ECONOMICS 11
cash rate to create new jobs, boost investment and spending too (Letts & Janda, 2019). When this
is considered, it is seen relevant for RBA to reduce the cash rate and it will be able to reach its
targets of having full employment by balancing her expenditures and output to be at point E as
seen on the above figure.
Question 5
In summary, I think RBA decided to lower its cash rate due to the persistent
unemployment rates in the country. Many Australians were unemployed and this forced the
central bank to reduce its cash rate to encourage investment within the production units and
creating jobs for citizens to reduce dependence (Ilikis, 2019). In addition, RBA might have
lowered the cash rate to stimulate the economic growth of the country. This is done to increasing
demand in the country and can be achieved by lowering people’s incentive to save and
increasing their borrowing and spending incentive (Ilikis, 2019). Furthermore, the financial
status in other strong economies like China, United States, Canada among others also influence
the cash rate for RBA. Increase in the economic status of these countries implies increase in
demand for Australian commodities and thus the cash rate has to be reduced to boost production
and investment well as if one of the economies where Australia exports her products had a
decreasing economic growth for example China, then the economic standing of Australia could
be affected (Amadeo, 2019). Basing on the results above, he actions attempted by the RBA
matched with the results of the study. This is because the target objectives of RBA are to
minimize inflation, unemployment rates and well as boosting the economic growth of the
country.
ECONOMICS 12
References
Ahortor, C. & Adenutsi, D. 2011. Inflation, Capital Accumulation and Economic Growth in
Import-Dependent Developing Countries. Munich Personal RePEc Archive. Working Paper No.
29353.
Amadeo, K., 2019.US Real GDP Growth Rate by Year Compared to Inflation and
Unemployment:
What Really Influenced U.S. Growth Through History. Retrieved from;
https://www.thebalance.com/u-s-gdp-growth-3306008
Balding, C., 2019.What’s Causing China’s Economic Slowdown. Retreived from:
https://www.foreignaffairs.com/articles/china/2019-03-11/whats-causing-chinas-economic-
slowdown
Bittencourt, M. 2012. Inflation and Economic Growth in Latin America: Some Panel Time-
Series Evidence. Economic Modelling, 29, 333 - 340
Chang, T. & Chiang, G. 2011. Regime-Switching Effects of Debt on Real GDP Per Capita: The
Case of Latin America and Caribbean Countries. Economic Modelling, 28, 2404-2408.
Ilikis, N., 2019.What is the cash rate and how does it affect you? Retrieved from:
https://mozo.com.au/interest-rates/articles/what-is-the-cash-rate-and-how-does-it-affect-you
Kan, E. & Omay, T. 2010. Re-examining the threshold effects in the inflation-growth nexus with
cross-sectionally dependent non-linear panel: evidence from six industrialised economies.
Economic Modelling, 27, 996-1005
⊘ This is a preview!⊘
Do you want full access?
Subscribe today to unlock all pages.
Trusted by 1+ million students worldwide
1 out of 13
Related Documents


Your All-in-One AI-Powered Toolkit for Academic Success.
+13062052269
info@desklib.com
Available 24*7 on WhatsApp / Email
![[object Object]](/_next/static/media/star-bottom.7253800d.svg)
Unlock your academic potential
Copyright © 2020–2026 A2Z Services. All Rights Reserved. Developed and managed by ZUCOL.