MAE256 Assignment: Regression Models with Cross Section Data Analysis
VerifiedAdded on 2022/11/15
|14
|2271
|236
Homework Assignment
AI Summary
This assignment presents a comprehensive analysis of regression models utilizing cross-section data, focusing on the relationship between real GDP, population, and total medals. The analysis begins with descriptive statistics, providing an overview of the variables' characteristics, including mean, median, standard deviation, and range. Subsequently, the assignment delves into the estimation of various regression models, starting with a simple model relating total medals to real GDP and progressing to more complex models incorporating level-log specifications, population, and dummy variables for planned economies, host countries, and Soviet Union membership. The results of each model are presented with detailed interpretations of coefficients, p-values, t-statistics, and goodness-of-fit measures such as R-squared and adjusted R-squared. The assignment also includes hypothesis testing to assess the significance of different variables and the overall significance of the models. The student demonstrates the ability to interpret regression results, assess model fit, and draw meaningful conclusions about the factors influencing total medals.
Running head: REGRESSION MODELS WITH CROSS SECTION DATA
Regression Models with Cross Section Data
Name of the Student:
Name of the University:
Author Note:
Regression Models with Cross Section Data
Name of the Student:
Name of the University:
Author Note:
Paraphrase This Document
Need a fresh take? Get an instant paraphrase of this document with our AI Paraphraser
1REGRESSION MODELS WITH CROSS SECTION DATA
Table of Contents
Descriptive statistics...................................................................................................................2
Estimation of regression model with total medal and real GDP................................................2
Estimation of regression model with total medal and level-log specification in real GDP.......4
Estimation of regression model with total medal, real GDP and population.............................5
Estimation of regression model with total medal and log of real GDP and population.............6
Effect of real GDP in model 4 at 1% level of significance........................................................7
Estimation of regression model with addition of planned economy and host country..............7
Overall significance of the model 5 at 1% significance level....................................................9
Estimation of regression model 5 after addition of dummy variable Soviet Union member....9
2REGRESSION MODELS WITH CROSS SECTION DATA
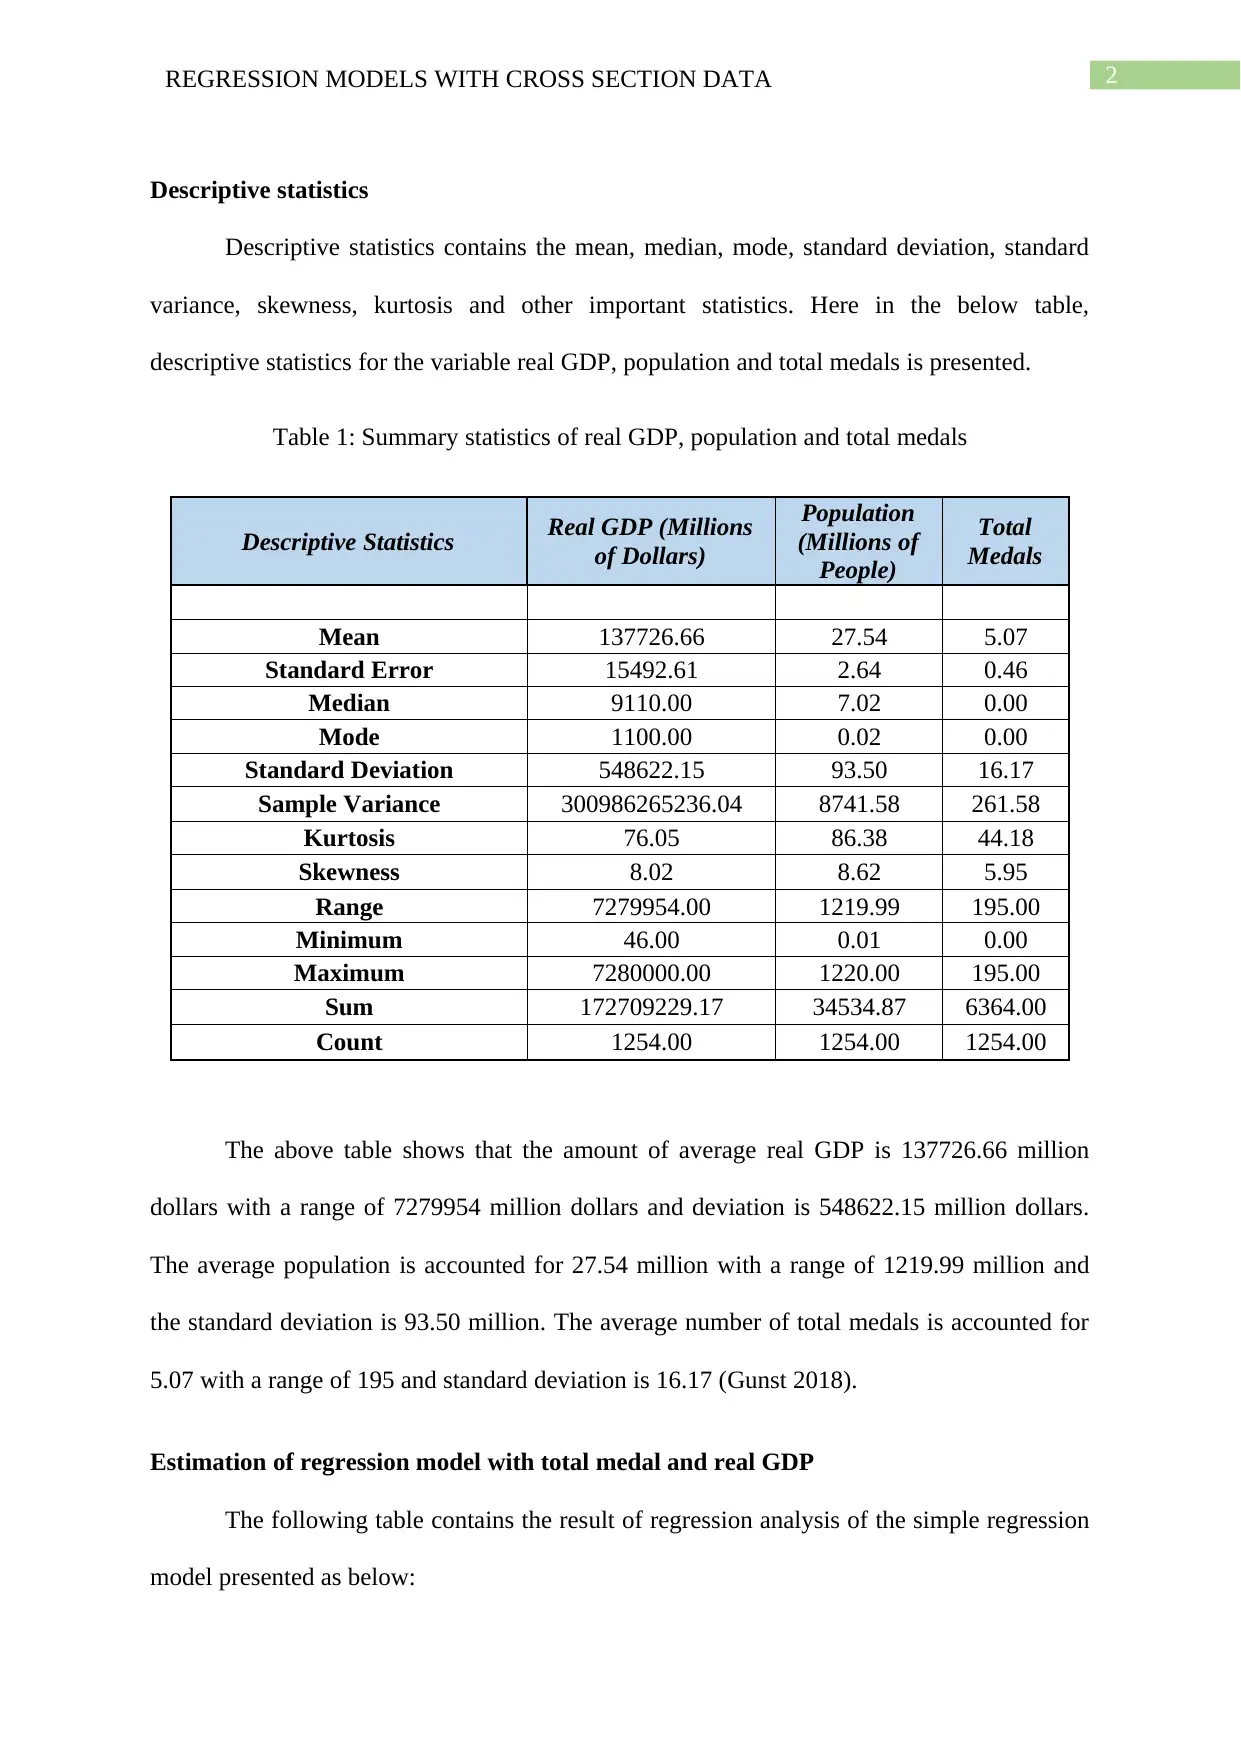
Descriptive statistics
Descriptive statistics contains the mean, median, mode, standard deviation, standard
variance, skewness, kurtosis and other important statistics. Here in the below table,
descriptive statistics for the variable real GDP, population and total medals is presented.
Table 1: Summary statistics of real GDP, population and total medals
Descriptive Statistics Real GDP (Millions
of Dollars)
Population
(Millions of
People)
Total
Medals
Mean 137726.66 27.54 5.07
Standard Error 15492.61 2.64 0.46
Median 9110.00 7.02 0.00
Mode 1100.00 0.02 0.00
Standard Deviation 548622.15 93.50 16.17
Sample Variance 300986265236.04 8741.58 261.58
Kurtosis 76.05 86.38 44.18
Skewness 8.02 8.62 5.95
Range 7279954.00 1219.99 195.00
Minimum 46.00 0.01 0.00
Maximum 7280000.00 1220.00 195.00
Sum 172709229.17 34534.87 6364.00
Count 1254.00 1254.00 1254.00
The above table shows that the amount of average real GDP is 137726.66 million
dollars with a range of 7279954 million dollars and deviation is 548622.15 million dollars.
The average population is accounted for 27.54 million with a range of 1219.99 million and
the standard deviation is 93.50 million. The average number of total medals is accounted for
5.07 with a range of 195 and standard deviation is 16.17 (Gunst 2018).
Estimation of regression model with total medal and real GDP
The following table contains the result of regression analysis of the simple regression
model presented as below:
⊘ This is a preview!⊘
Do you want full access?
Subscribe today to unlock all pages.
Trusted by 1+ million students worldwide
3REGRESSION MODELS WITH CROSS SECTION DATA
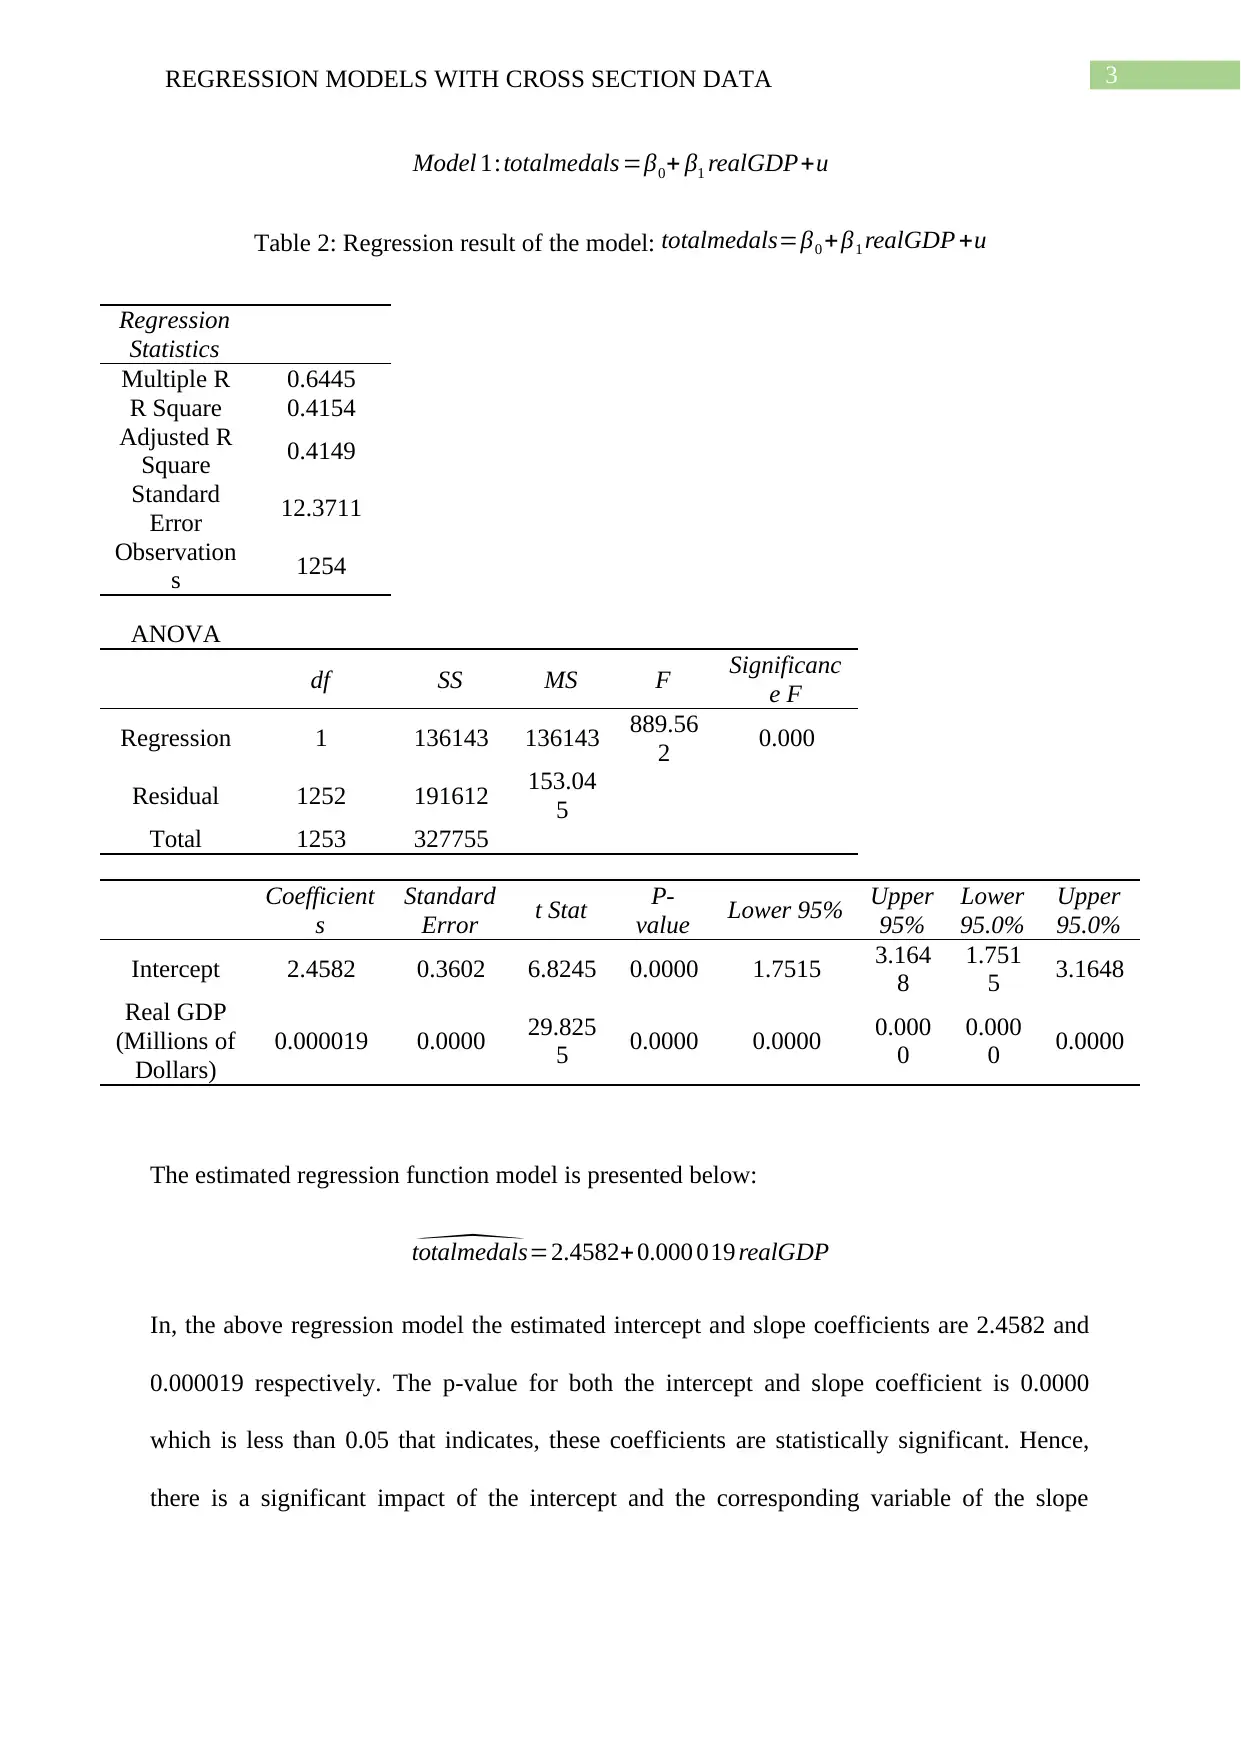
Model 1:totalmedals =β0+ β1 realGDP+u
Table 2: Regression result of the model: totalmedals=β0 +β1 realGDP +u
Regression
Statistics
Multiple R 0.6445
R Square 0.4154
Adjusted R
Square 0.4149
Standard
Error 12.3711
Observation
s 1254
ANOVA
df SS MS F Significanc
e F
Regression 1 136143 136143 889.56
2 0.000
Residual 1252 191612 153.04
5
Total 1253 327755
Coefficient
s
Standard
Error t Stat P-
value Lower 95% Upper
95%
Lower
95.0%
Upper
95.0%
Intercept 2.4582 0.3602 6.8245 0.0000 1.7515 3.164
8
1.751
5 3.1648
Real GDP
(Millions of
Dollars)
0.000019 0.0000 29.825
5 0.0000 0.0000 0.000
0
0.000
0 0.0000
The estimated regression function model is presented below:
^totalmedals=2.4582+ 0.000 019 realGDP
In, the above regression model the estimated intercept and slope coefficients are 2.4582 and
0.000019 respectively. The p-value for both the intercept and slope coefficient is 0.0000
which is less than 0.05 that indicates, these coefficients are statistically significant. Hence,
there is a significant impact of the intercept and the corresponding variable of the slope
Paraphrase This Document
Need a fresh take? Get an instant paraphrase of this document with our AI Paraphraser
4REGRESSION MODELS WITH CROSS SECTION DATA
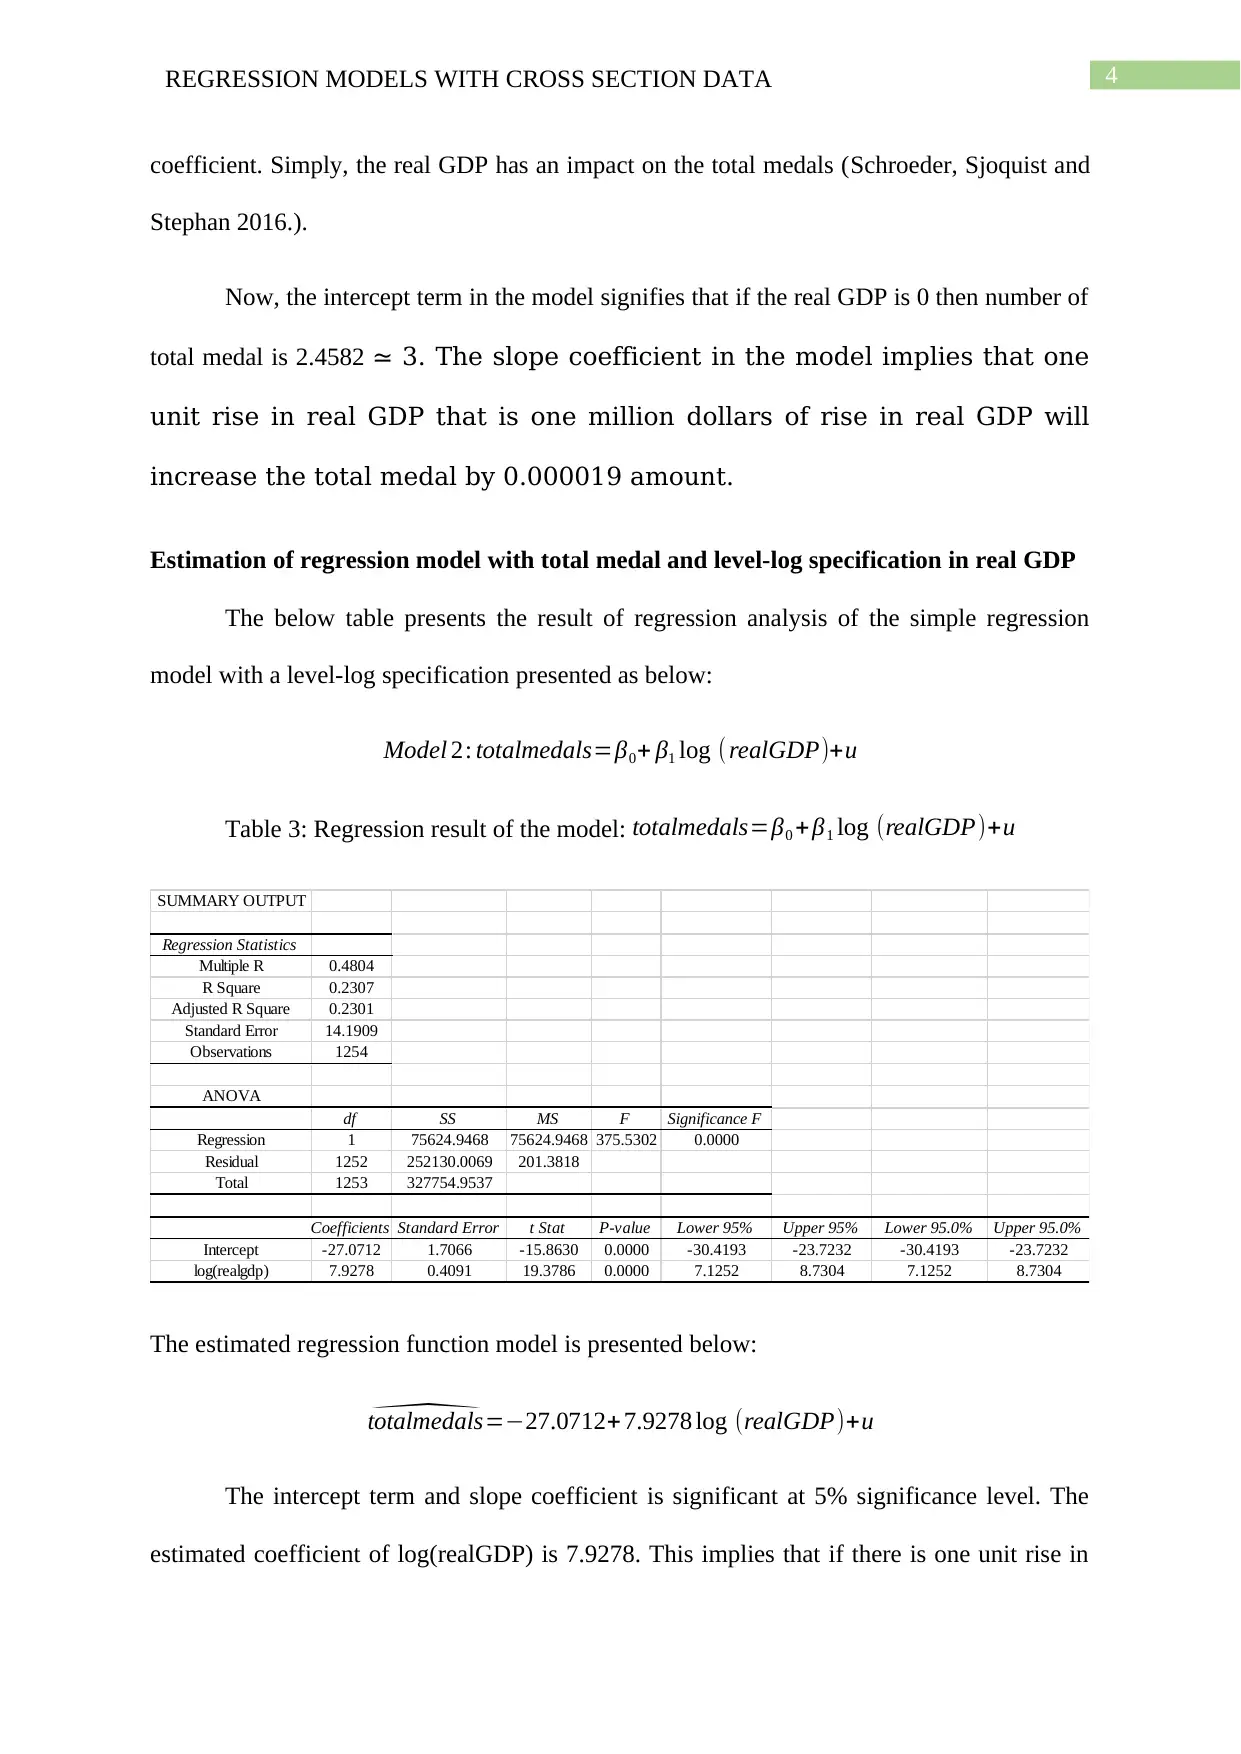
coefficient. Simply, the real GDP has an impact on the total medals (Schroeder, Sjoquist and
Stephan 2016.).
Now, the intercept term in the model signifies that if the real GDP is 0 then number of
total medal is 2.4582 ≃ 3. The slope coefficient in the model implies that one
unit rise in real GDP that is one million dollars of rise in real GDP will
increase the total medal by 0.000019 amount.
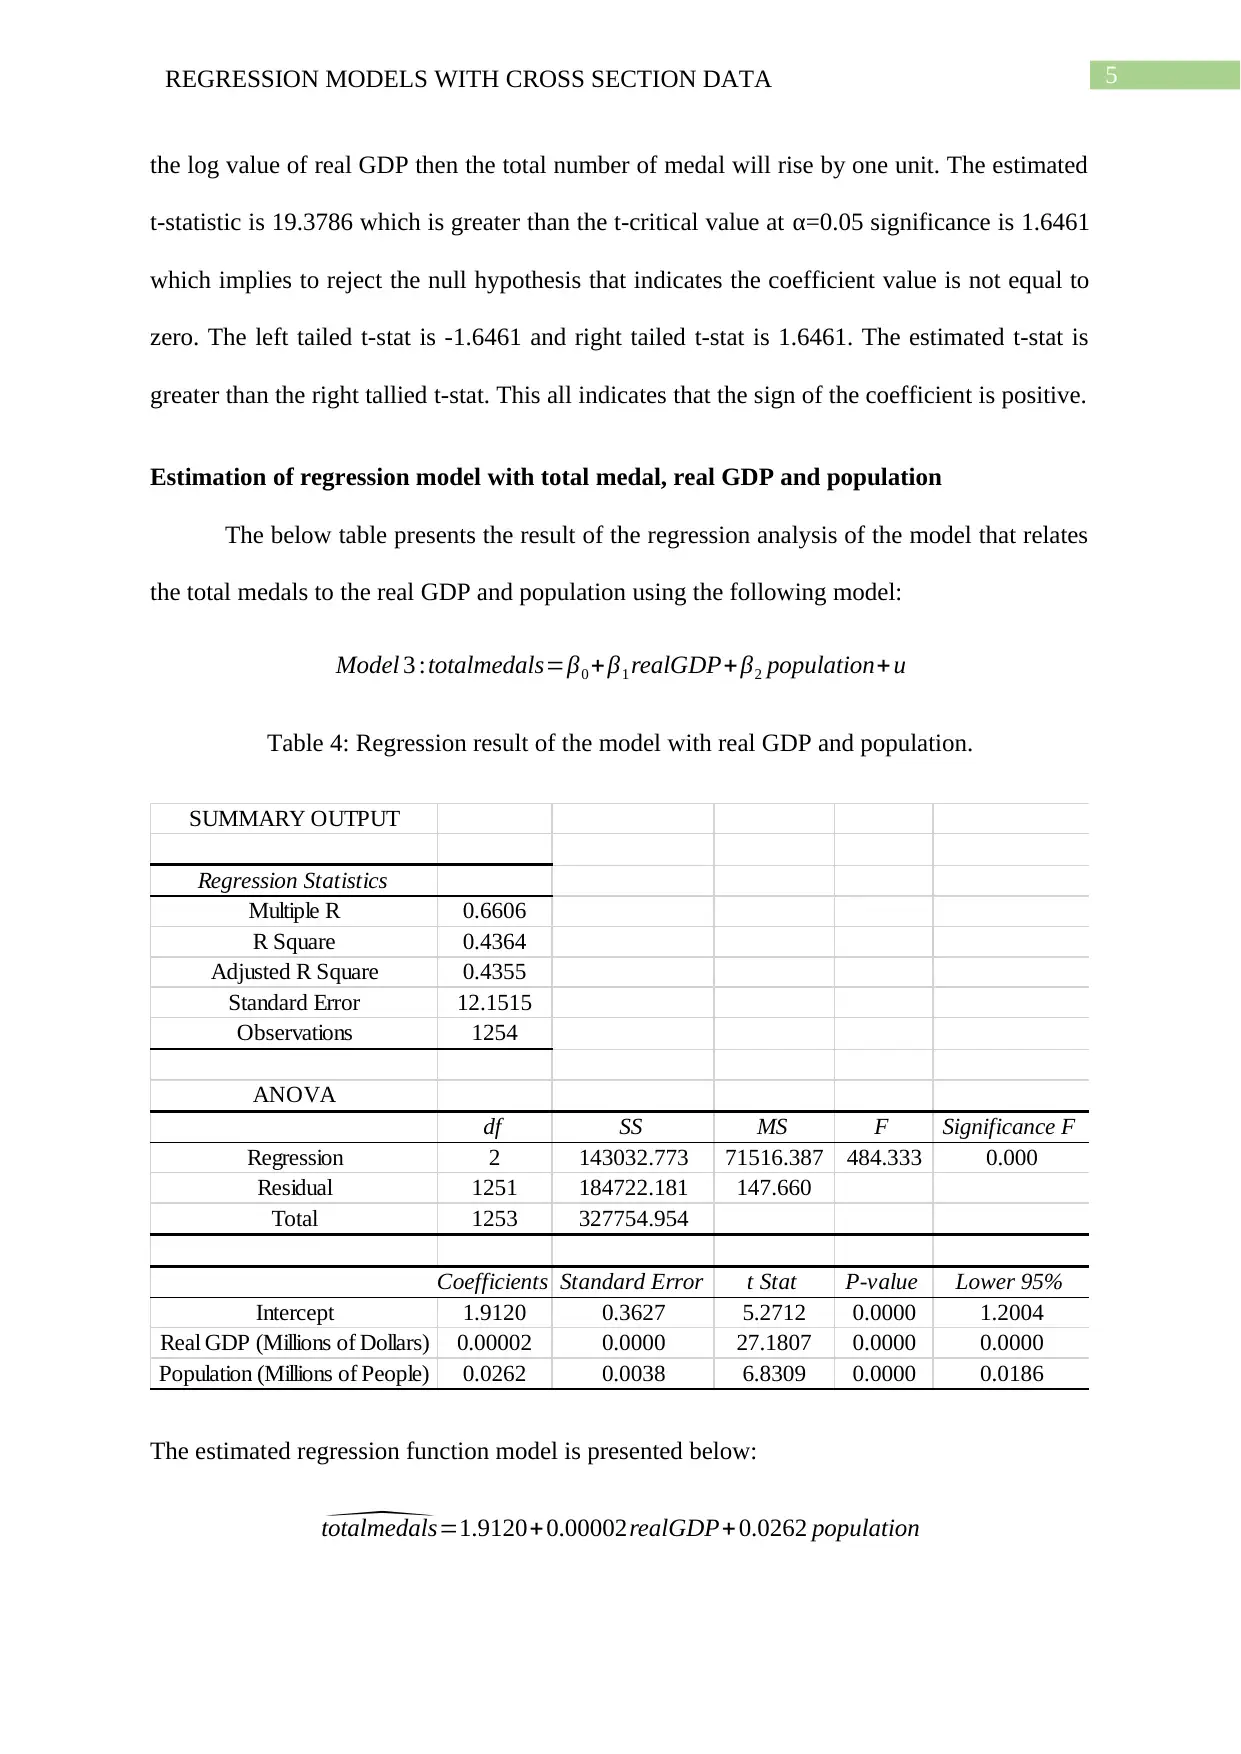
Estimation of regression model with total medal and level-log specification in real GDP
The below table presents the result of regression analysis of the simple regression
model with a level-log specification presented as below:
Model 2: totalmedals=β0+ β1 log ( realGDP)+u
Table 3: Regression result of the model: totalmedals=β0 +β1 log (realGDP)+u
SUMMARY OUTPUT
Regression Statistics
Multiple R 0.4804
R Square 0.2307
Adjusted R Square 0.2301
Standard Error 14.1909
Observations 1254
ANOVA
df SS MS F Significance F
Regression 1 75624.9468 75624.9468 375.5302 0.0000
Residual 1252 252130.0069 201.3818
Total 1253 327754.9537
Coefficients Standard Error t Stat P-value Lower 95% Upper 95% Lower 95.0% Upper 95.0%
Intercept -27.0712 1.7066 -15.8630 0.0000 -30.4193 -23.7232 -30.4193 -23.7232
log(realgdp) 7.9278 0.4091 19.3786 0.0000 7.1252 8.7304 7.1252 8.7304
The estimated regression function model is presented below:
^totalmedals=−27.0712+ 7.9278 log (realGDP)+u
The intercept term and slope coefficient is significant at 5% significance level. The
estimated coefficient of log(realGDP) is 7.9278. This implies that if there is one unit rise in
coefficient. Simply, the real GDP has an impact on the total medals (Schroeder, Sjoquist and
Stephan 2016.).
Now, the intercept term in the model signifies that if the real GDP is 0 then number of
total medal is 2.4582 ≃ 3. The slope coefficient in the model implies that one
unit rise in real GDP that is one million dollars of rise in real GDP will
increase the total medal by 0.000019 amount.
Estimation of regression model with total medal and level-log specification in real GDP
The below table presents the result of regression analysis of the simple regression
model with a level-log specification presented as below:
Model 2: totalmedals=β0+ β1 log ( realGDP)+u
Table 3: Regression result of the model: totalmedals=β0 +β1 log (realGDP)+u
SUMMARY OUTPUT
Regression Statistics
Multiple R 0.4804
R Square 0.2307
Adjusted R Square 0.2301
Standard Error 14.1909
Observations 1254
ANOVA
df SS MS F Significance F
Regression 1 75624.9468 75624.9468 375.5302 0.0000
Residual 1252 252130.0069 201.3818
Total 1253 327754.9537
Coefficients Standard Error t Stat P-value Lower 95% Upper 95% Lower 95.0% Upper 95.0%
Intercept -27.0712 1.7066 -15.8630 0.0000 -30.4193 -23.7232 -30.4193 -23.7232
log(realgdp) 7.9278 0.4091 19.3786 0.0000 7.1252 8.7304 7.1252 8.7304
The estimated regression function model is presented below:
^totalmedals=−27.0712+ 7.9278 log (realGDP)+u
The intercept term and slope coefficient is significant at 5% significance level. The
estimated coefficient of log(realGDP) is 7.9278. This implies that if there is one unit rise in
5REGRESSION MODELS WITH CROSS SECTION DATA
the log value of real GDP then the total number of medal will rise by one unit. The estimated
t-statistic is 19.3786 which is greater than the t-critical value at α=0.05 significance is 1.6461
which implies to reject the null hypothesis that indicates the coefficient value is not equal to
zero. The left tailed t-stat is -1.6461 and right tailed t-stat is 1.6461. The estimated t-stat is
greater than the right tallied t-stat. This all indicates that the sign of the coefficient is positive.
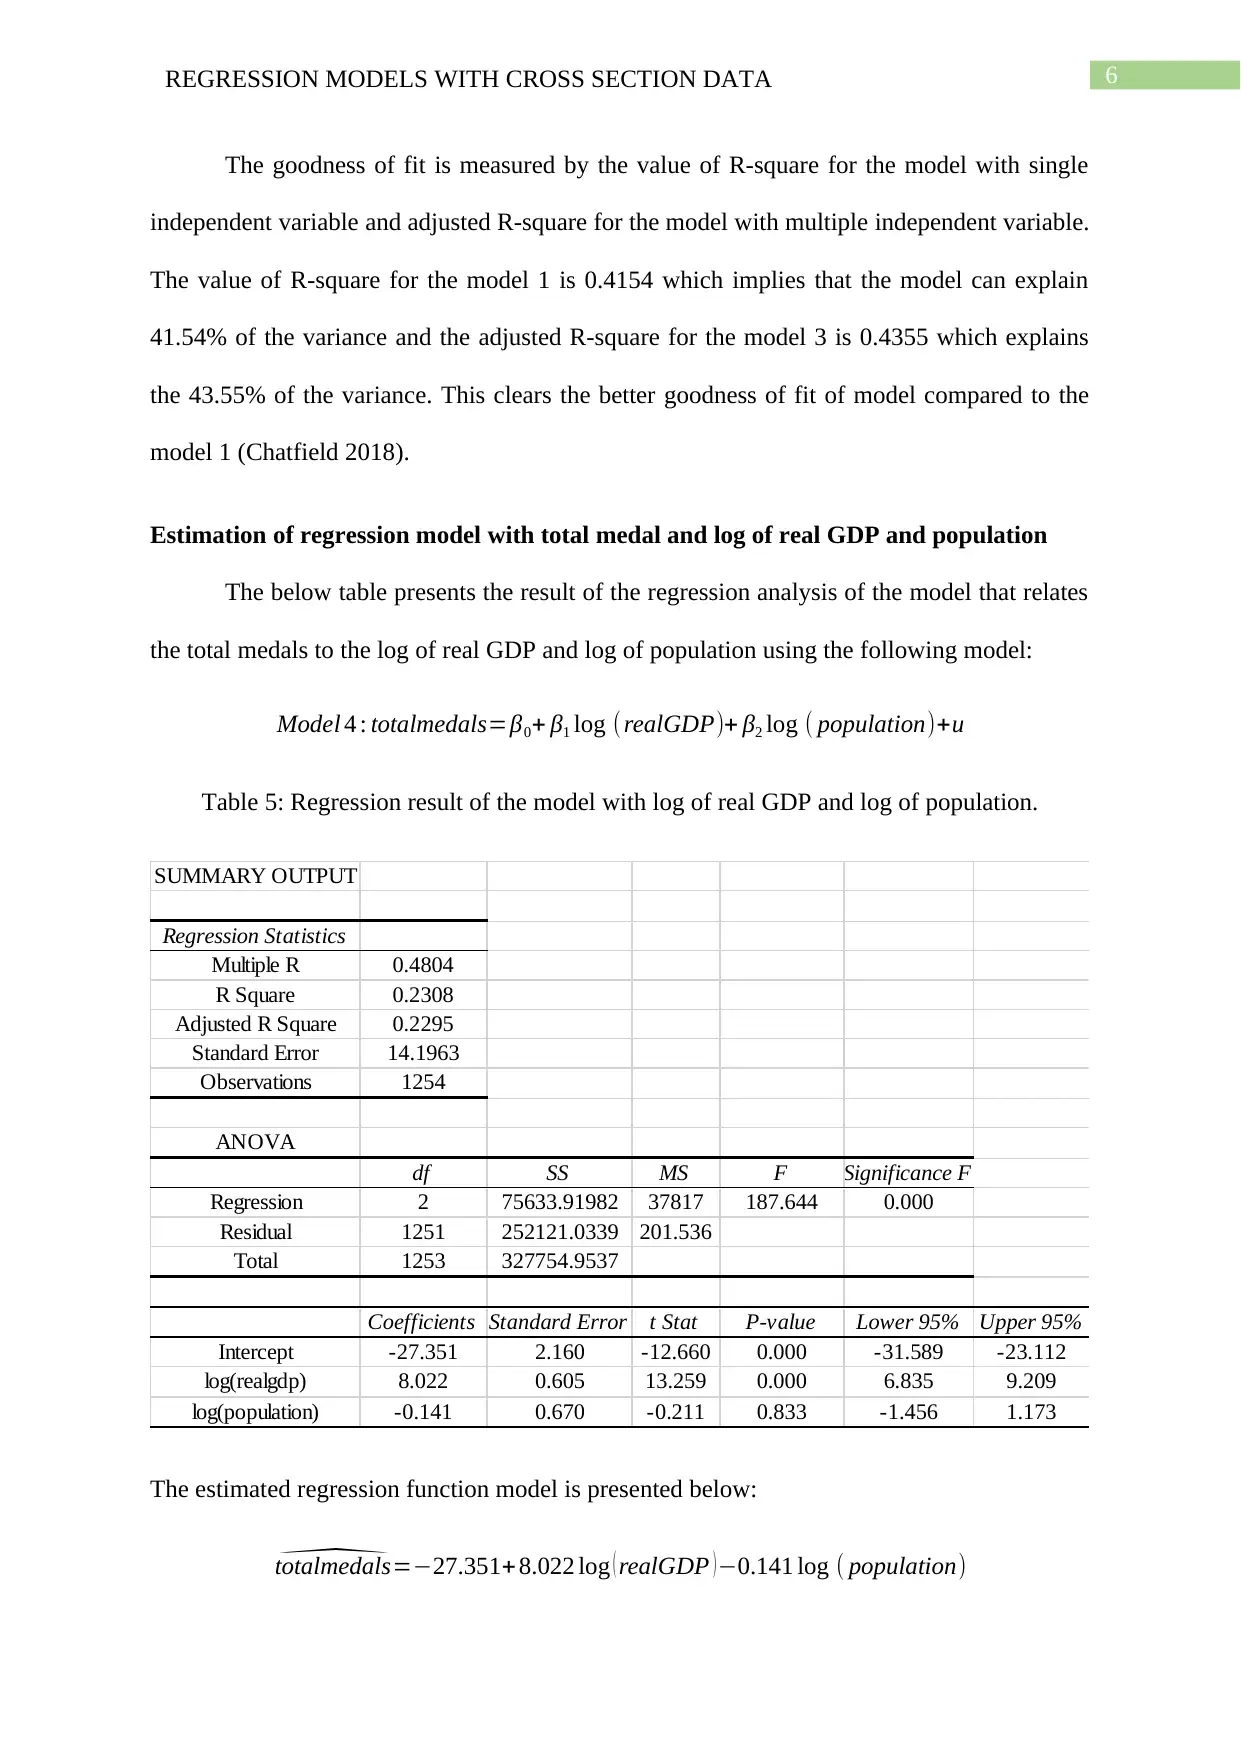
Estimation of regression model with total medal, real GDP and population
The below table presents the result of the regression analysis of the model that relates
the total medals to the real GDP and population using the following model:
Model 3 :totalmedals=β0 + β1 realGDP+ β2 population+ u
Table 4: Regression result of the model with real GDP and population.
SUMMARY OUTPUT
Regression Statistics
Multiple R 0.6606
R Square 0.4364
Adjusted R Square 0.4355
Standard Error 12.1515
Observations 1254
ANOVA
df SS MS F Significance F
Regression 2 143032.773 71516.387 484.333 0.000
Residual 1251 184722.181 147.660
Total 1253 327754.954
Coefficients Standard Error t Stat P-value Lower 95%
Intercept 1.9120 0.3627 5.2712 0.0000 1.2004
Real GDP (Millions of Dollars) 0.00002 0.0000 27.1807 0.0000 0.0000
Population (Millions of People) 0.0262 0.0038 6.8309 0.0000 0.0186
The estimated regression function model is presented below:
^totalmedals=1.9120+0.00002realGDP+ 0.0262 population
the log value of real GDP then the total number of medal will rise by one unit. The estimated
t-statistic is 19.3786 which is greater than the t-critical value at α=0.05 significance is 1.6461
which implies to reject the null hypothesis that indicates the coefficient value is not equal to
zero. The left tailed t-stat is -1.6461 and right tailed t-stat is 1.6461. The estimated t-stat is
greater than the right tallied t-stat. This all indicates that the sign of the coefficient is positive.
Estimation of regression model with total medal, real GDP and population
The below table presents the result of the regression analysis of the model that relates
the total medals to the real GDP and population using the following model:
Model 3 :totalmedals=β0 + β1 realGDP+ β2 population+ u
Table 4: Regression result of the model with real GDP and population.
SUMMARY OUTPUT
Regression Statistics
Multiple R 0.6606
R Square 0.4364
Adjusted R Square 0.4355
Standard Error 12.1515
Observations 1254
ANOVA
df SS MS F Significance F
Regression 2 143032.773 71516.387 484.333 0.000
Residual 1251 184722.181 147.660
Total 1253 327754.954
Coefficients Standard Error t Stat P-value Lower 95%
Intercept 1.9120 0.3627 5.2712 0.0000 1.2004
Real GDP (Millions of Dollars) 0.00002 0.0000 27.1807 0.0000 0.0000
Population (Millions of People) 0.0262 0.0038 6.8309 0.0000 0.0186
The estimated regression function model is presented below:
^totalmedals=1.9120+0.00002realGDP+ 0.0262 population
⊘ This is a preview!⊘
Do you want full access?
Subscribe today to unlock all pages.
Trusted by 1+ million students worldwide
6REGRESSION MODELS WITH CROSS SECTION DATA
The goodness of fit is measured by the value of R-square for the model with single
independent variable and adjusted R-square for the model with multiple independent variable.
The value of R-square for the model 1 is 0.4154 which implies that the model can explain
41.54% of the variance and the adjusted R-square for the model 3 is 0.4355 which explains
the 43.55% of the variance. This clears the better goodness of fit of model compared to the
model 1 (Chatfield 2018).
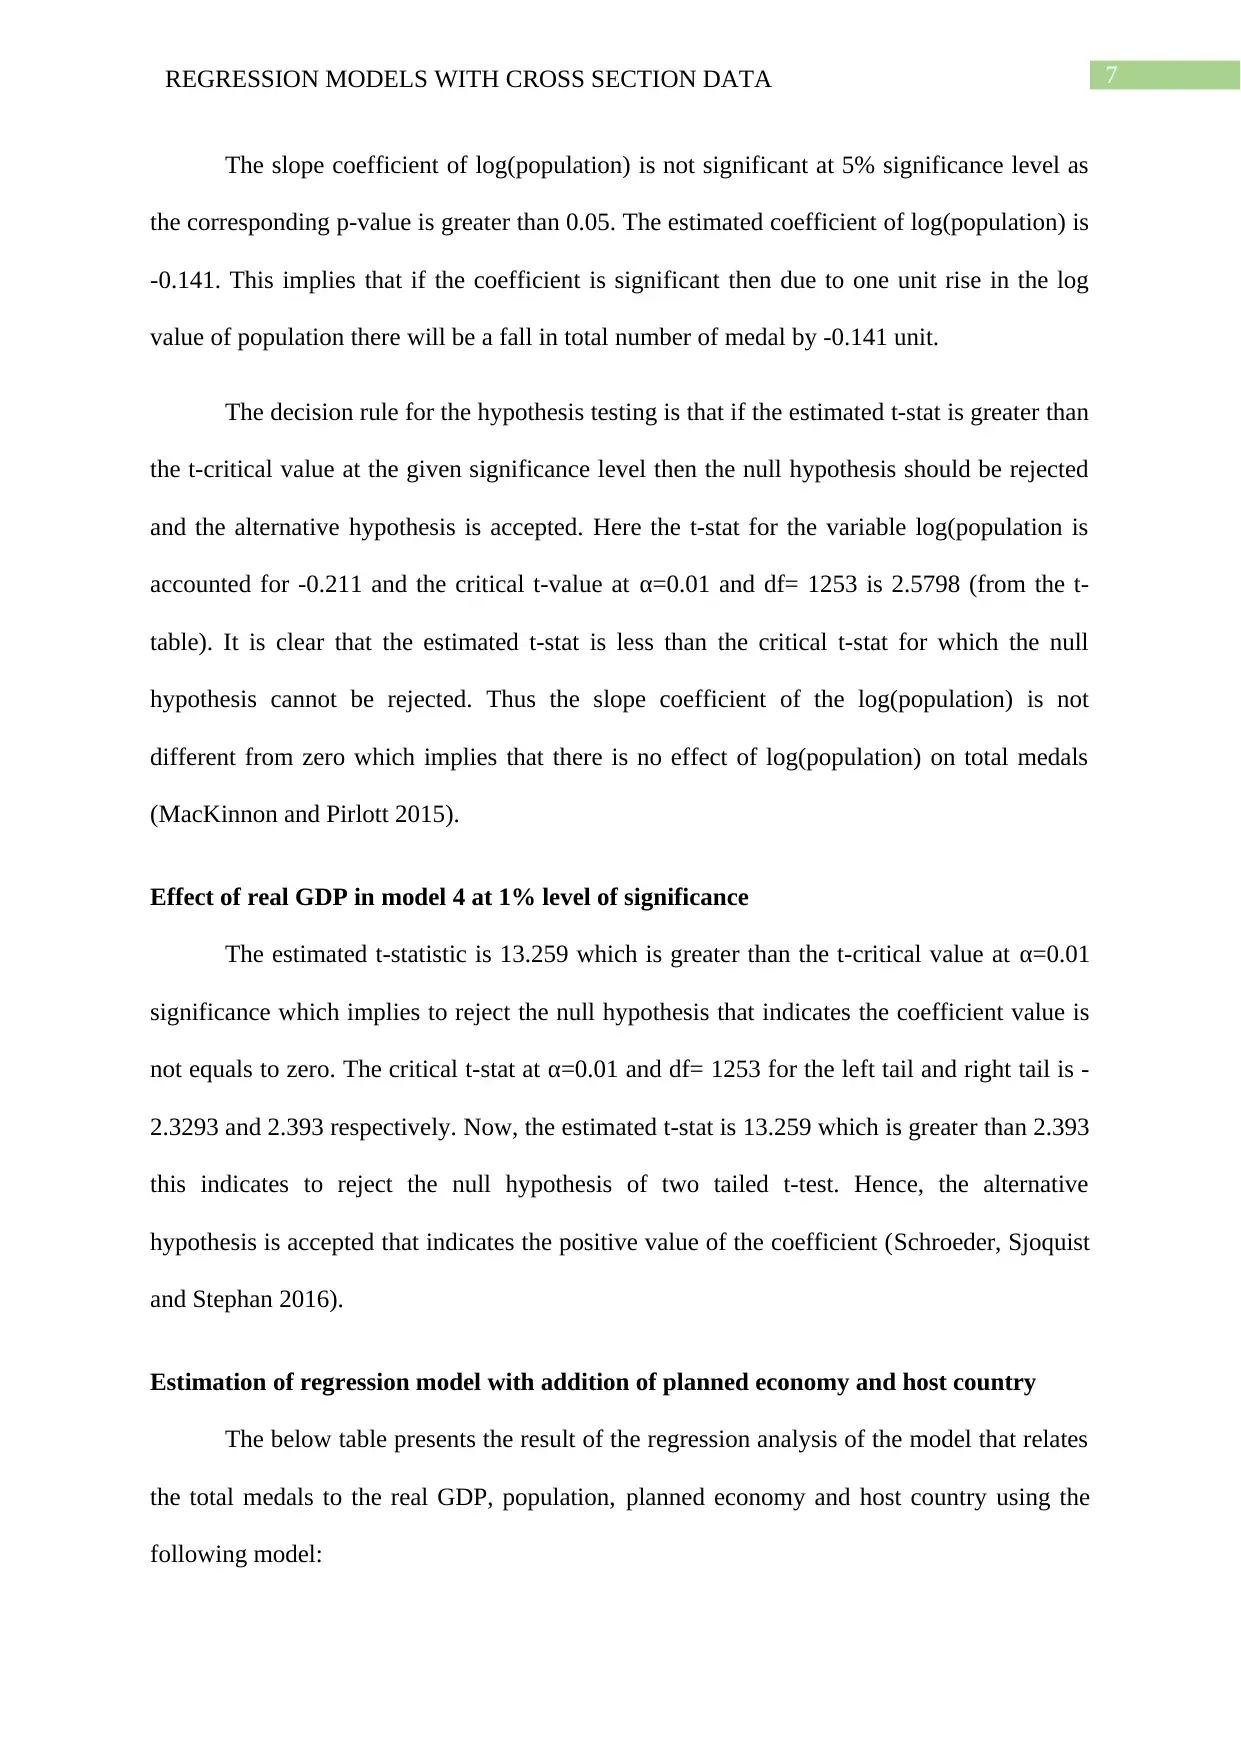
Estimation of regression model with total medal and log of real GDP and population
The below table presents the result of the regression analysis of the model that relates
the total medals to the log of real GDP and log of population using the following model:
Model 4 : totalmedals=β0+ β1 log ( realGDP)+ β2 log ( population)+u
Table 5: Regression result of the model with log of real GDP and log of population.
SUMMARY OUTPUT
Regression Statistics
Multiple R 0.4804
R Square 0.2308
Adjusted R Square 0.2295
Standard Error 14.1963
Observations 1254
ANOVA
df SS MS F Significance F
Regression 2 75633.91982 37817 187.644 0.000
Residual 1251 252121.0339 201.536
Total 1253 327754.9537
Coefficients Standard Error t Stat P-value Lower 95% Upper 95%
Intercept -27.351 2.160 -12.660 0.000 -31.589 -23.112
log(realgdp) 8.022 0.605 13.259 0.000 6.835 9.209
log(population) -0.141 0.670 -0.211 0.833 -1.456 1.173
The estimated regression function model is presented below:
^totalmedals=−27.351+ 8.022 log ( realGDP ) −0.141 log ( population)
The goodness of fit is measured by the value of R-square for the model with single
independent variable and adjusted R-square for the model with multiple independent variable.
The value of R-square for the model 1 is 0.4154 which implies that the model can explain
41.54% of the variance and the adjusted R-square for the model 3 is 0.4355 which explains
the 43.55% of the variance. This clears the better goodness of fit of model compared to the
model 1 (Chatfield 2018).
Estimation of regression model with total medal and log of real GDP and population
The below table presents the result of the regression analysis of the model that relates
the total medals to the log of real GDP and log of population using the following model:
Model 4 : totalmedals=β0+ β1 log ( realGDP)+ β2 log ( population)+u
Table 5: Regression result of the model with log of real GDP and log of population.
SUMMARY OUTPUT
Regression Statistics
Multiple R 0.4804
R Square 0.2308
Adjusted R Square 0.2295
Standard Error 14.1963
Observations 1254
ANOVA
df SS MS F Significance F
Regression 2 75633.91982 37817 187.644 0.000
Residual 1251 252121.0339 201.536
Total 1253 327754.9537
Coefficients Standard Error t Stat P-value Lower 95% Upper 95%
Intercept -27.351 2.160 -12.660 0.000 -31.589 -23.112
log(realgdp) 8.022 0.605 13.259 0.000 6.835 9.209
log(population) -0.141 0.670 -0.211 0.833 -1.456 1.173
The estimated regression function model is presented below:
^totalmedals=−27.351+ 8.022 log ( realGDP ) −0.141 log ( population)
Paraphrase This Document
Need a fresh take? Get an instant paraphrase of this document with our AI Paraphraser
7REGRESSION MODELS WITH CROSS SECTION DATA
The slope coefficient of log(population) is not significant at 5% significance level as
the corresponding p-value is greater than 0.05. The estimated coefficient of log(population) is
-0.141. This implies that if the coefficient is significant then due to one unit rise in the log
value of population there will be a fall in total number of medal by -0.141 unit.
The decision rule for the hypothesis testing is that if the estimated t-stat is greater than
the t-critical value at the given significance level then the null hypothesis should be rejected
and the alternative hypothesis is accepted. Here the t-stat for the variable log(population is
accounted for -0.211 and the critical t-value at α=0.01 and df= 1253 is 2.5798 (from the t-
table). It is clear that the estimated t-stat is less than the critical t-stat for which the null
hypothesis cannot be rejected. Thus the slope coefficient of the log(population) is not
different from zero which implies that there is no effect of log(population) on total medals
(MacKinnon and Pirlott 2015).
Effect of real GDP in model 4 at 1% level of significance
The estimated t-statistic is 13.259 which is greater than the t-critical value at α=0.01
significance which implies to reject the null hypothesis that indicates the coefficient value is
not equals to zero. The critical t-stat at α=0.01 and df= 1253 for the left tail and right tail is -
2.3293 and 2.393 respectively. Now, the estimated t-stat is 13.259 which is greater than 2.393
this indicates to reject the null hypothesis of two tailed t-test. Hence, the alternative
hypothesis is accepted that indicates the positive value of the coefficient (Schroeder, Sjoquist
and Stephan 2016).
Estimation of regression model with addition of planned economy and host country
The below table presents the result of the regression analysis of the model that relates
the total medals to the real GDP, population, planned economy and host country using the
following model:
8REGRESSION MODELS WITH CROSS SECTION DATA
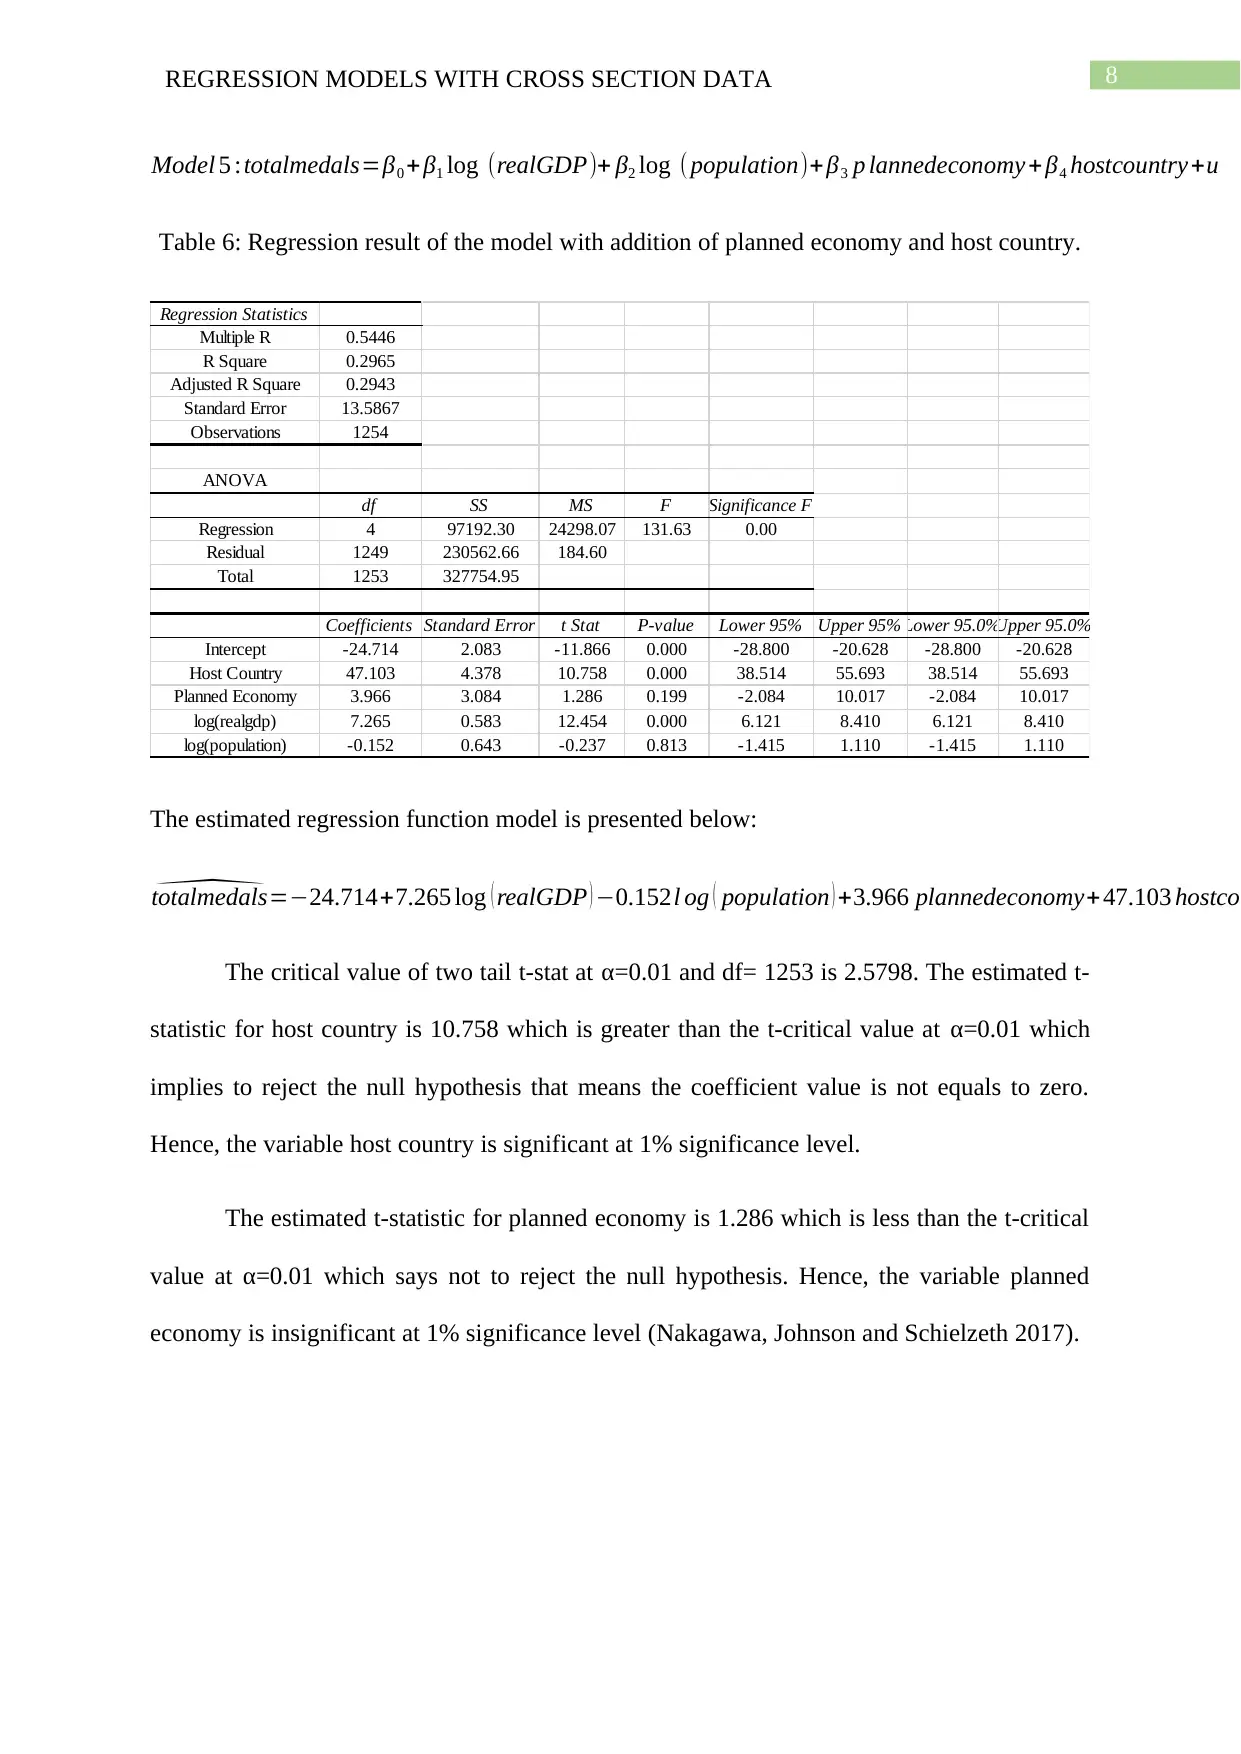
Model 5 :totalmedals=β0 + β1 log (realGDP)+ β2 log ( population)+ β3 p lannedeconomy + β4 hostcountry+u
Table 6: Regression result of the model with addition of planned economy and host country.
Regression Statistics
Multiple R 0.5446
R Square 0.2965
Adjusted R Square 0.2943
Standard Error 13.5867
Observations 1254
ANOVA
df SS MS F Significance F
Regression 4 97192.30 24298.07 131.63 0.00
Residual 1249 230562.66 184.60
Total 1253 327754.95
Coefficients Standard Error t Stat P-value Lower 95% Upper 95% Lower 95.0%Upper 95.0%
Intercept -24.714 2.083 -11.866 0.000 -28.800 -20.628 -28.800 -20.628
Host Country 47.103 4.378 10.758 0.000 38.514 55.693 38.514 55.693
Planned Economy 3.966 3.084 1.286 0.199 -2.084 10.017 -2.084 10.017
log(realgdp) 7.265 0.583 12.454 0.000 6.121 8.410 6.121 8.410
log(population) -0.152 0.643 -0.237 0.813 -1.415 1.110 -1.415 1.110
The estimated regression function model is presented below:
^totalmedals=−24.714+7.265 log ( realGDP ) −0.152l og ( population ) +3.966 plannedeconomy+ 47.103 hostcou
The critical value of two tail t-stat at α=0.01 and df= 1253 is 2.5798. The estimated t-
statistic for host country is 10.758 which is greater than the t-critical value at α=0.01 which
implies to reject the null hypothesis that means the coefficient value is not equals to zero.
Hence, the variable host country is significant at 1% significance level.
The estimated t-statistic for planned economy is 1.286 which is less than the t-critical
value at α=0.01 which says not to reject the null hypothesis. Hence, the variable planned
economy is insignificant at 1% significance level (Nakagawa, Johnson and Schielzeth 2017).
⊘ This is a preview!⊘
Do you want full access?
Subscribe today to unlock all pages.
Trusted by 1+ million students worldwide
9REGRESSION MODELS WITH CROSS SECTION DATA
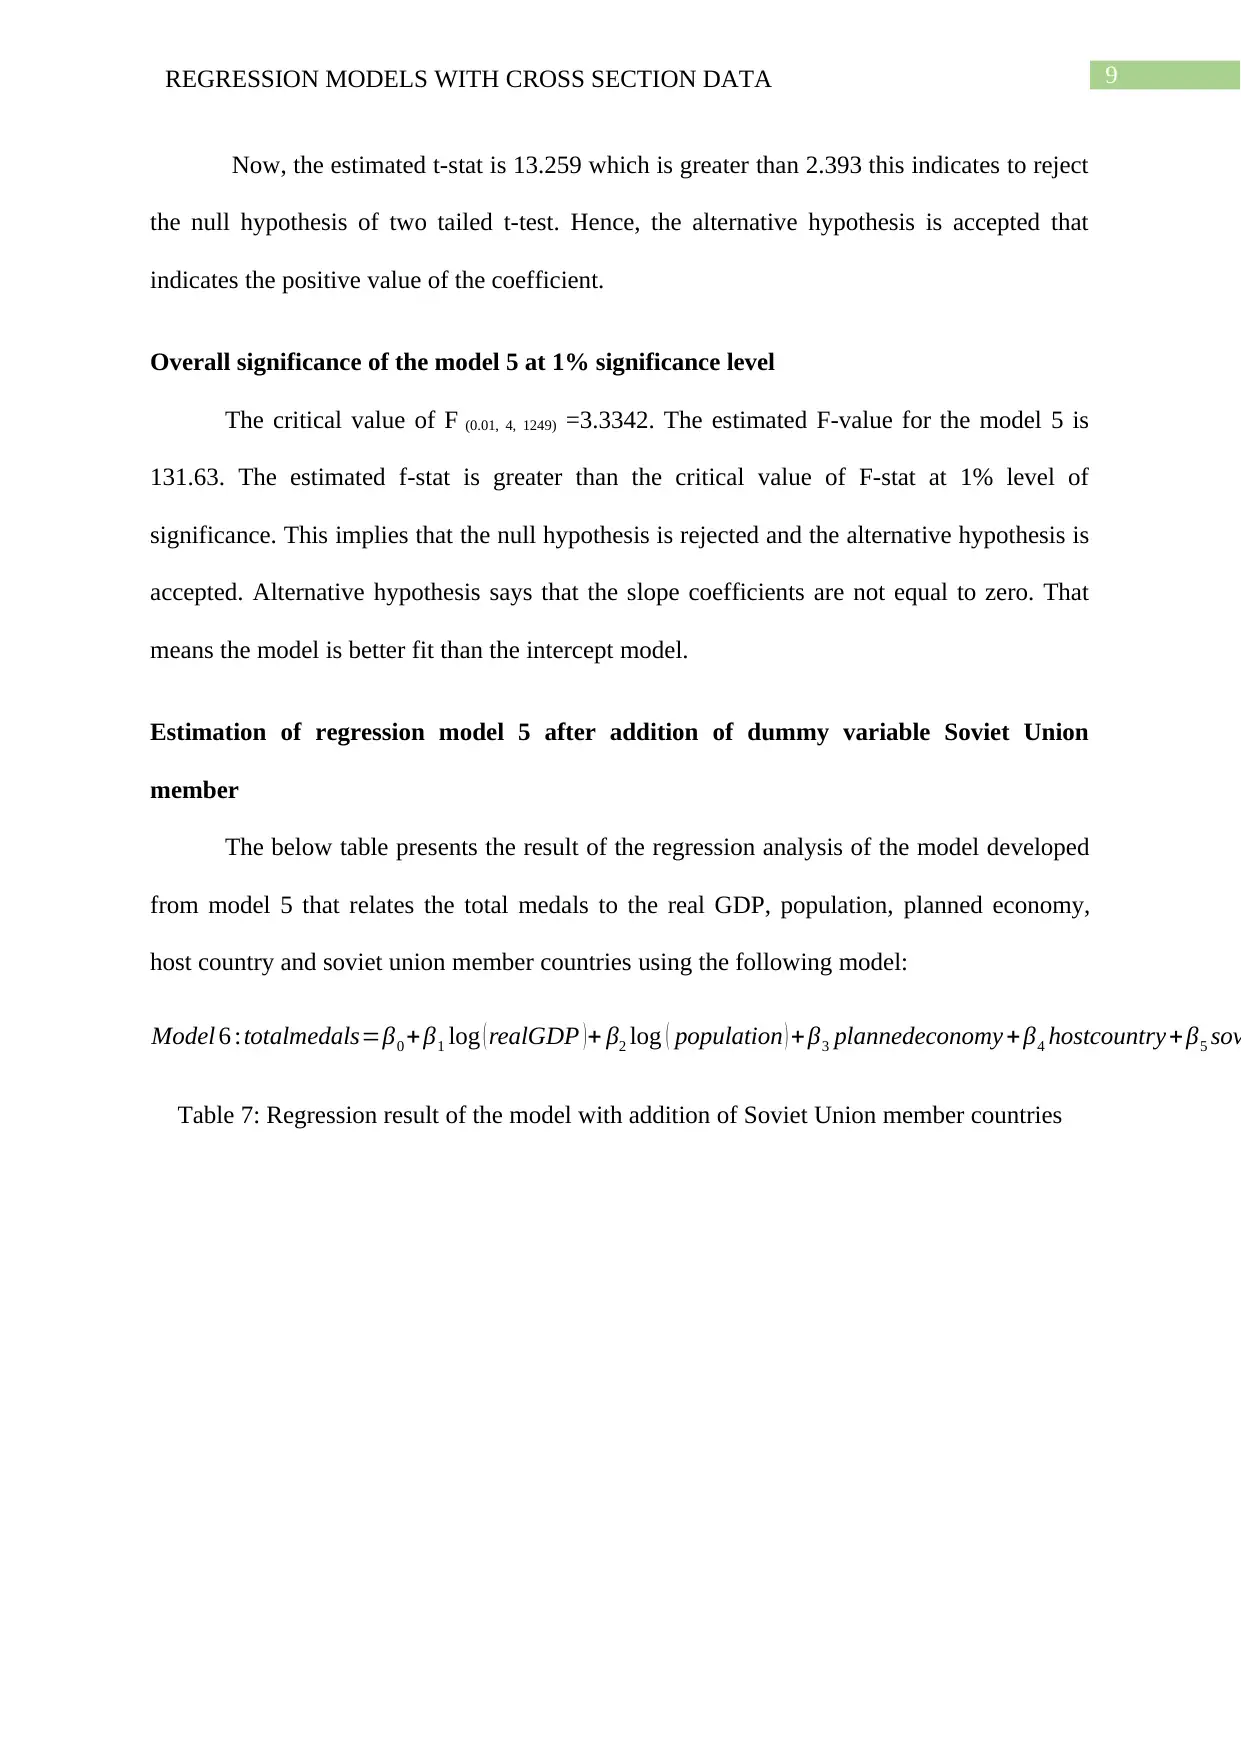
Now, the estimated t-stat is 13.259 which is greater than 2.393 this indicates to reject
the null hypothesis of two tailed t-test. Hence, the alternative hypothesis is accepted that
indicates the positive value of the coefficient.
Overall significance of the model 5 at 1% significance level
The critical value of F (0.01, 4, 1249) =3.3342. The estimated F-value for the model 5 is
131.63. The estimated f-stat is greater than the critical value of F-stat at 1% level of
significance. This implies that the null hypothesis is rejected and the alternative hypothesis is
accepted. Alternative hypothesis says that the slope coefficients are not equal to zero. That
means the model is better fit than the intercept model.
Estimation of regression model 5 after addition of dummy variable Soviet Union
member
The below table presents the result of the regression analysis of the model developed
from model 5 that relates the total medals to the real GDP, population, planned economy,
host country and soviet union member countries using the following model:
Model 6 :totalmedals=β0 +β1 log ( realGDP )+ β2 log ( population ) + β3 plannedeconomy +β4 hostcountry + β5 sov
Table 7: Regression result of the model with addition of Soviet Union member countries
Paraphrase This Document
Need a fresh take? Get an instant paraphrase of this document with our AI Paraphraser
10REGRESSION MODELS WITH CROSS SECTION DATA
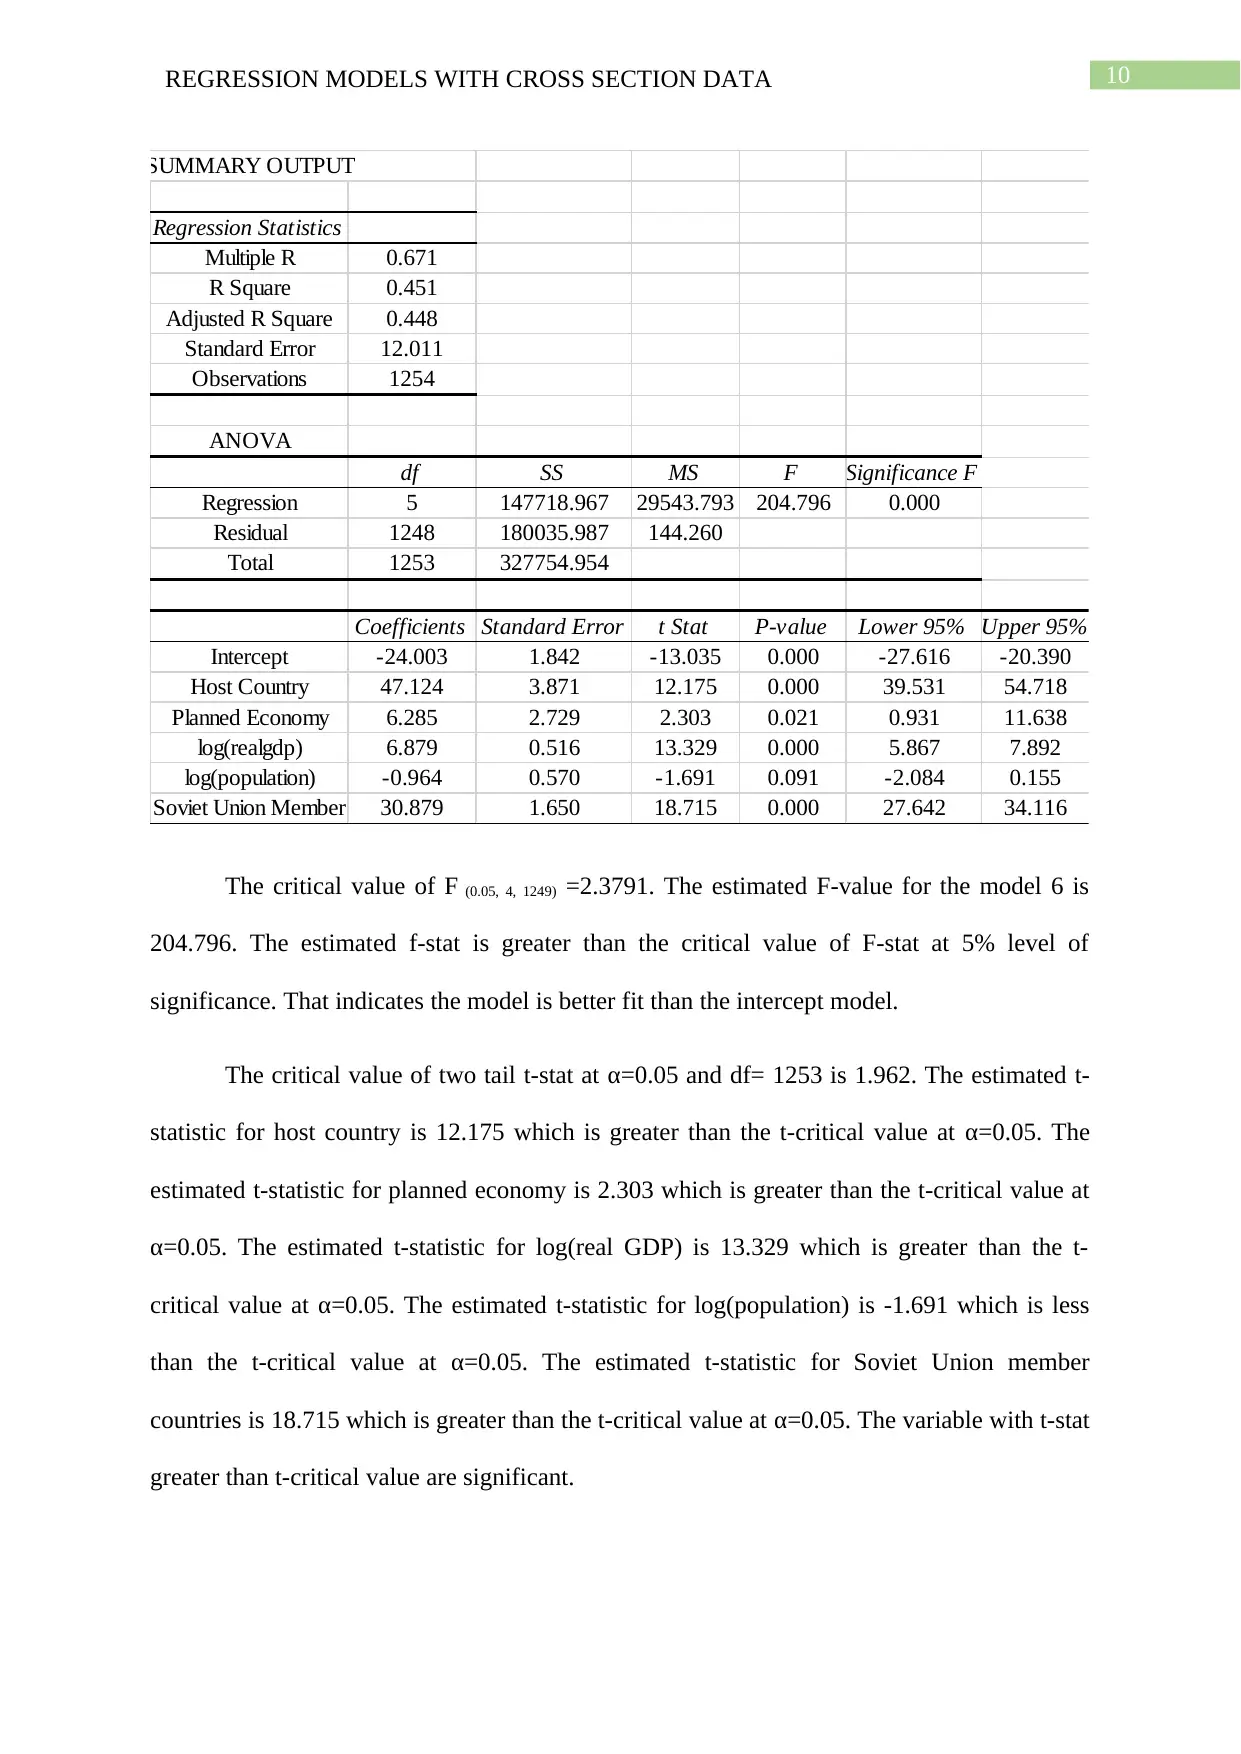
SUMMARY OUTPUT
Regression Statistics
Multiple R 0.671
R Square 0.451
Adjusted R Square 0.448
Standard Error 12.011
Observations 1254
ANOVA
df SS MS F Significance F
Regression 5 147718.967 29543.793 204.796 0.000
Residual 1248 180035.987 144.260
Total 1253 327754.954
Coefficients Standard Error t Stat P-value Lower 95% Upper 95%
Intercept -24.003 1.842 -13.035 0.000 -27.616 -20.390
Host Country 47.124 3.871 12.175 0.000 39.531 54.718
Planned Economy 6.285 2.729 2.303 0.021 0.931 11.638
log(realgdp) 6.879 0.516 13.329 0.000 5.867 7.892
log(population) -0.964 0.570 -1.691 0.091 -2.084 0.155
Soviet Union Member 30.879 1.650 18.715 0.000 27.642 34.116
The critical value of F (0.05, 4, 1249) =2.3791. The estimated F-value for the model 6 is
204.796. The estimated f-stat is greater than the critical value of F-stat at 5% level of
significance. That indicates the model is better fit than the intercept model.
The critical value of two tail t-stat at α=0.05 and df= 1253 is 1.962. The estimated t-
statistic for host country is 12.175 which is greater than the t-critical value at α=0.05. The
estimated t-statistic for planned economy is 2.303 which is greater than the t-critical value at
α=0.05. The estimated t-statistic for log(real GDP) is 13.329 which is greater than the t-
critical value at α=0.05. The estimated t-statistic for log(population) is -1.691 which is less
than the t-critical value at α=0.05. The estimated t-statistic for Soviet Union member
countries is 18.715 which is greater than the t-critical value at α=0.05. The variable with t-stat
greater than t-critical value are significant.

11REGRESSION MODELS WITH CROSS SECTION DATA
The coefficient of Soviet Union member countries is 30.879 which implies that the
Soviet Union member countries win 30.879≃31 medals more than other countries (Bollen et
al. 2016).
The coefficient of Soviet Union member countries is 30.879 which implies that the
Soviet Union member countries win 30.879≃31 medals more than other countries (Bollen et
al. 2016).
⊘ This is a preview!⊘
Do you want full access?
Subscribe today to unlock all pages.
Trusted by 1+ million students worldwide
1 out of 14
Related Documents


Your All-in-One AI-Powered Toolkit for Academic Success.
+13062052269
info@desklib.com
Available 24*7 on WhatsApp / Email
![[object Object]](/_next/static/media/star-bottom.7253800d.svg)
Unlock your academic potential
Copyright © 2020–2026 A2Z Services. All Rights Reserved. Developed and managed by ZUCOL.