MAF605 Accounting and Finance for Managers Assignment - September 2018
VerifiedAdded on 2023/06/04
|17
|3863
|205
Homework Assignment
AI Summary
This assignment solution for MAF605, Accounting and Finance for Managers, addresses key financial concepts and their applications. Part A explores budgetary control, flexible budgeting, the Economic Order Quantity (EOQ) model, agency theory, and financial ratios. It analyzes the benefits of budgetary control for a telecommunication company, discusses the EOQ model's role in inventory management, examines agency theory's impact on shareholder value, and highlights the importance of financial ratios for evaluating company performance. Part B delves into EOQ calculations, payback period, and Net Present Value (NPV) analysis for investment projects. The solution provides detailed calculations and explanations for each question, offering valuable insights into financial management principles and their practical application in business decision-making. The assignment covers topics such as inventory management, capital budgeting, and financial statement analysis, providing a comprehensive overview of financial concepts relevant to managers.
1
MAF 605
ACCOUNTING AND FINANCE FOR MANAGERS
MAF 605
ACCOUNTING AND FINANCE FOR MANAGERS
Paraphrase This Document
Need a fresh take? Get an instant paraphrase of this document with our AI Paraphraser
2
Part A:
Answer 1:
The increasing complexity within the business environment is causing the firms to adopt
better system of cost management for maximizing their operational efficiency. In this context,
the businesses are largely adopting the use of budgetary control for developing a sound financial
plan that helps in attaining the financial as well as operational goals. Budget can be regarded as
the framework that helps in determining the strategic plan of a firm that assists in attaining its
organizational goals and objectives (Shim, 2011). In this context, the application of flexible
budget and the budgetary control for demonstrating their usefulness to the management team of
the telecommunication company ‘Real Madrid Sdn Bhd’ can be discussed as follows:
Flexible Budget
Flexible budget can be described as a budget that can be adjusted as per the fluctuations
in the volume of the activity. The flexible budget provides the major advantage to the
management by taking accurate decisions based on its realistic position. It is associated with the
major benefit of providing adaptability to the businesses as the budget developed is highly
flexible and can be adjusted as per the changes in volume of production based on the
marketplace conditions. The flexible budget provides the major advantage to the management by
identifying the difference between fixed and variable costs on the basis of fluctuations in the
output achieved. It enables in providing different type of budgeted costs on the basis of various
level of activity of production. It enables the management in effectively classifying the expenses
between the variable and fixed expenses that assist the management in reducing the operational
expenses by eliminating the unnecessary activities (Dugdale, 2010).
However, the flexible budgeting method is also criticized by the business managers as it
requires tracking the changes in a continuous manner and as such the process can be time-
consuming. Also, it incurs high amount of cost for monitoring continuously the business changes
and therefore is not feasible method of budgeting for organizations all the time. The authenticity
of the flexible budgeting system is also questioned by the business managers on account of its
authenticity. This is because the outcome determined by the use of flexible budgeting system can
be inaccurate if the information gathered is not reliable.
Budgetary Control
Budgetary control refers to the method adopted by the business managers for monitoring
and controlling costs that helps in determining the financial and performance goals by comparing
the actual results with the budgeted outcomes. The major advantage that the method of budgetary
control provides to the management is finding out the discrepancies that help in taking proper
decisions. The major objective of the budgetary control is to develop future planning by
determining the various budgets and maximize the operational efficiency. The
3
telecommunication company involves different types of operational activities that can result in
consuming large amount of resources. Thus, development of budget will help in gaining an
estimate of overall cost to be realized in carrying out different business operations. This will help
in making accurate planning for meeting the expenses and thereby reducing the financial risk.
The major point of criticism for the method of budgetary control is that is lacks reliability as it
adopts the use of various estimates and thus the results can be misleading. The revision of the
budgets again and again can lead in enhancing the business expenses involved in development of
budgets (Weygandt, 2015).
Answer 2:
Economic order quantity (EOQ) model is used by businesses for managing the inventory
level by establishing a tradeoff between the holding and ordering costs of inventory. The model
is sued for reducing the overall inventory costs. The overall inventory cost can be minimized by
reducing both the ordering and holding costs of inventory. Holding cost refers to all the
significant costs that are associated with holding the inventory such as material handling or
logistic costs. On the other hand, ordering costs involves the cost that is associated with ordering
the inventory such as packaging or delivery cost (Choi, 2013). As given in the case scenario,
Tootenhand Berhad management is concerned related for maintaining the stock levels and thus
need to reduce the holding costs associated with inventory. Thus, the management team of the
company is recommended to adopt the use of EOQ model that will help in ordering the right
amount of inventory that help in reducing the costs involved in maintain the stock levels. The
accurate determination of required inventory can be done with the use of EOQ model by
determination of three variables that are, demand, ordering and carrying cost. The economic
ordered quantity is calculated by the use of following formula:
The economic ordered quantity determined will help in keeping the inventory costs as low as
possible. The determination of accurate inventory level will help in maintaining a budgetary
control and maximizing the operational efficiency. However, the method is criticized due to the
assumptions used in the model that are too simplistic. Also, it does not take into account the real
cost of stock in operations and is also regarded to be largely descriptive. In addition to this, the
model cannot be accurately used for the products that have seasonal fluctuations (Muckstadt,
2010).
Answer 3:
(a)The goal of the management as per the agency theory should be to maximize the share process
for creating enhanced value for the shareholders. Thus, it is essential for the management team to
⊘ This is a preview!⊘
Do you want full access?
Subscribe today to unlock all pages.
Trusted by 1+ million students worldwide
4
consider the future growth prospect of the firm before accepting the bid offer. The offer provided
by another company to pay RM40 is not worthy of accepting of the firm value is expected to
increase in the future years. This acceptance of this hostile bid will not prove to be worthy of
accepting as it will act against the interest of the owners by not considering the long-term value
that the firm can provide to them in the future (Ehrhardt & Brigham, 2016).
(b)The continued growth and success of an organization remains on its ability to realize profits
that is necessary for it to remain attractive for its investors. The increasing competition in the
external market is causing the business entities to deliver maximum profits for outperforming
their competitors. The pressure can derive the business managers to adopt the short-term growth
strategies for achieving the determined financial targets. The business companies for delivering
maximum results for its stakeholders tend to adopt the short-term growth strategy rather than
exploring the best long-term strategy. The decisions taken by business executives to drive larger
profits instantly can negatively impact the long-term growth and sustainability of a company.
This is because it can be at the expense of the sustainability of a company that is essential for
deriving its long-term growth. For example, the business managers if chooses to achieve the
short-term results by ignoring the business ethics that it can negatively impact the long-term
growth prospects of an organization. The long-term sustainability of an organization depends on
its ability to create profit and at the same time being ethically and morally responsible to all its
stakeholders. Thus, it involves promoting environmental, economic and social development and
not just placing emphasis on deriving its profitability by ignoring the interests and welfare of its
stakeholders (Eich, 2016).
(c) An agency relationship exists in the corporate form of an organization as it leads to an
establishment of a contract between the owners and the business managers. The contract is
established as a corporate form of an organization makes it legally recognized as a separate
entity. Thus, it requires that all the corporate actions are taken by the business managers, acting
as principal, on the behalf of the owners, who are the agents. This leads to the establishment of
an agency relationship in which the principal provides the decision-making authority to the agent
but the legal control is possesses by the owners that are the shareholders of a firm (Ross, 2014).
Answer 4:
The key financial ratios that can be used by the management team of Everton Sdn Berhad for
evaluating the company’s performance are profitability, solvency, efficiency and market ratios
that help in determining its future growth prospects. These key financial rations can help in
developing a benchmark for measuring the performance of all another players operating within
the same industry. The understanding of the ratios provides larger help to the business managers
and also to the investors for gaining an analysis of the strengths and weakness and thus facilitate
in their decision-making process. The weakness in the performance can help the management
team in developing effective strategies for overcoming it for driving the sustained growth of the
businesses. The ratio analysis can also prove to be useful for management team for acquiring
Paraphrase This Document
Need a fresh take? Get an instant paraphrase of this document with our AI Paraphraser
5
another entity operating within the similar industry as it provides standardized method for
comparing the companies and industries. It helps in adequately comparing the performance of a
firm in relation to its competitors so that business managers can effectively take decisions for
outperforming another company on the basis of its weakness and strengths analyzed with the use
of key financial ratios outcomes (Gibson, 2008).
6
Part B
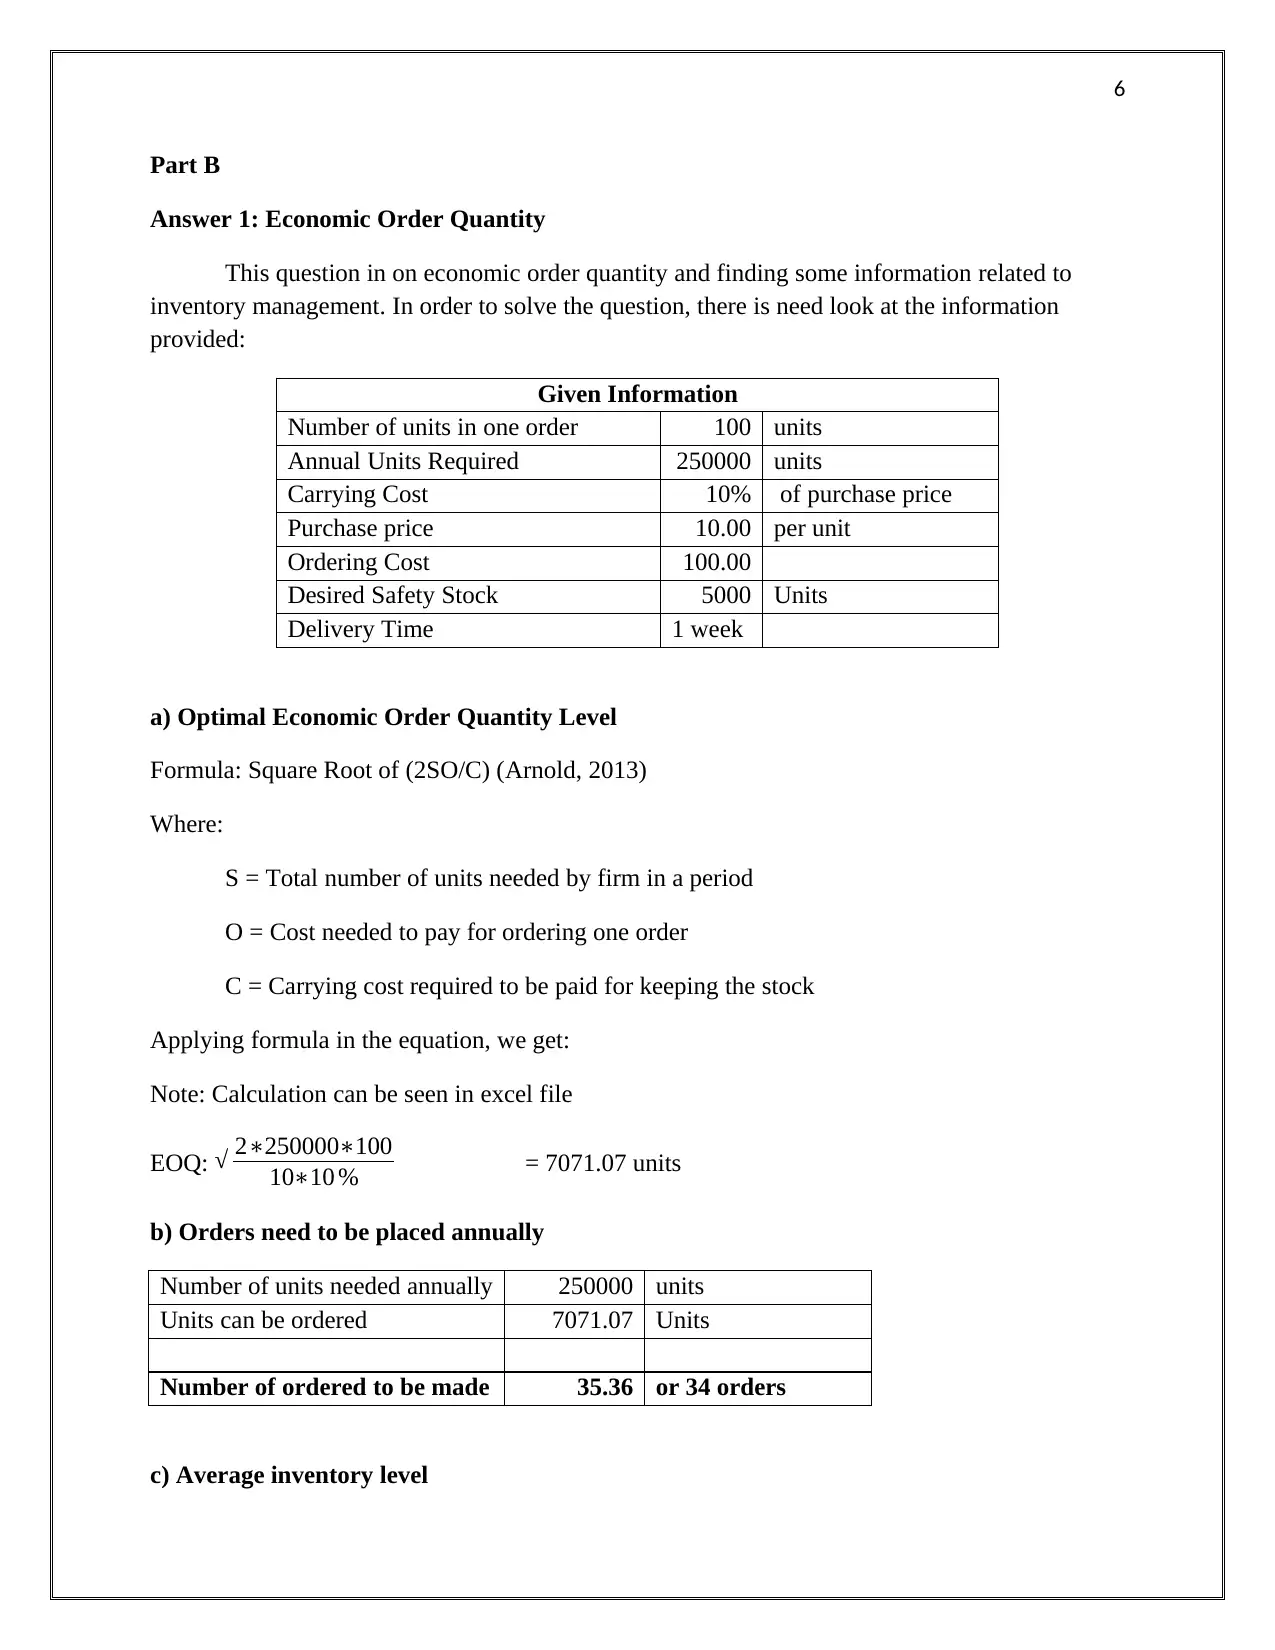
Answer 1: Economic Order Quantity
This question in on economic order quantity and finding some information related to
inventory management. In order to solve the question, there is need look at the information
provided:
Given Information
Number of units in one order 100 units
Annual Units Required 250000 units
Carrying Cost 10% of purchase price
Purchase price 10.00 per unit
Ordering Cost 100.00
Desired Safety Stock 5000 Units
Delivery Time 1 week
a) Optimal Economic Order Quantity Level
Formula: Square Root of (2SO/C) (Arnold, 2013)
Where:
S = Total number of units needed by firm in a period
O = Cost needed to pay for ordering one order
C = Carrying cost required to be paid for keeping the stock
Applying formula in the equation, we get:
Note: Calculation can be seen in excel file
EOQ: √ 2∗250000∗100
10∗10 % = 7071.07 units
b) Orders need to be placed annually
Number of units needed annually 250000 units
Units can be ordered 7071.07 Units
Number of ordered to be made 35.36 or 34 orders
c) Average inventory level
Part B
Answer 1: Economic Order Quantity
This question in on economic order quantity and finding some information related to
inventory management. In order to solve the question, there is need look at the information
provided:
Given Information
Number of units in one order 100 units
Annual Units Required 250000 units
Carrying Cost 10% of purchase price
Purchase price 10.00 per unit
Ordering Cost 100.00
Desired Safety Stock 5000 Units
Delivery Time 1 week
a) Optimal Economic Order Quantity Level
Formula: Square Root of (2SO/C) (Arnold, 2013)
Where:
S = Total number of units needed by firm in a period
O = Cost needed to pay for ordering one order
C = Carrying cost required to be paid for keeping the stock
Applying formula in the equation, we get:
Note: Calculation can be seen in excel file
EOQ: √ 2∗250000∗100
10∗10 % = 7071.07 units
b) Orders need to be placed annually
Number of units needed annually 250000 units
Units can be ordered 7071.07 Units
Number of ordered to be made 35.36 or 34 orders
c) Average inventory level
⊘ This is a preview!⊘
Do you want full access?
Subscribe today to unlock all pages.
Trusted by 1+ million students worldwide
7
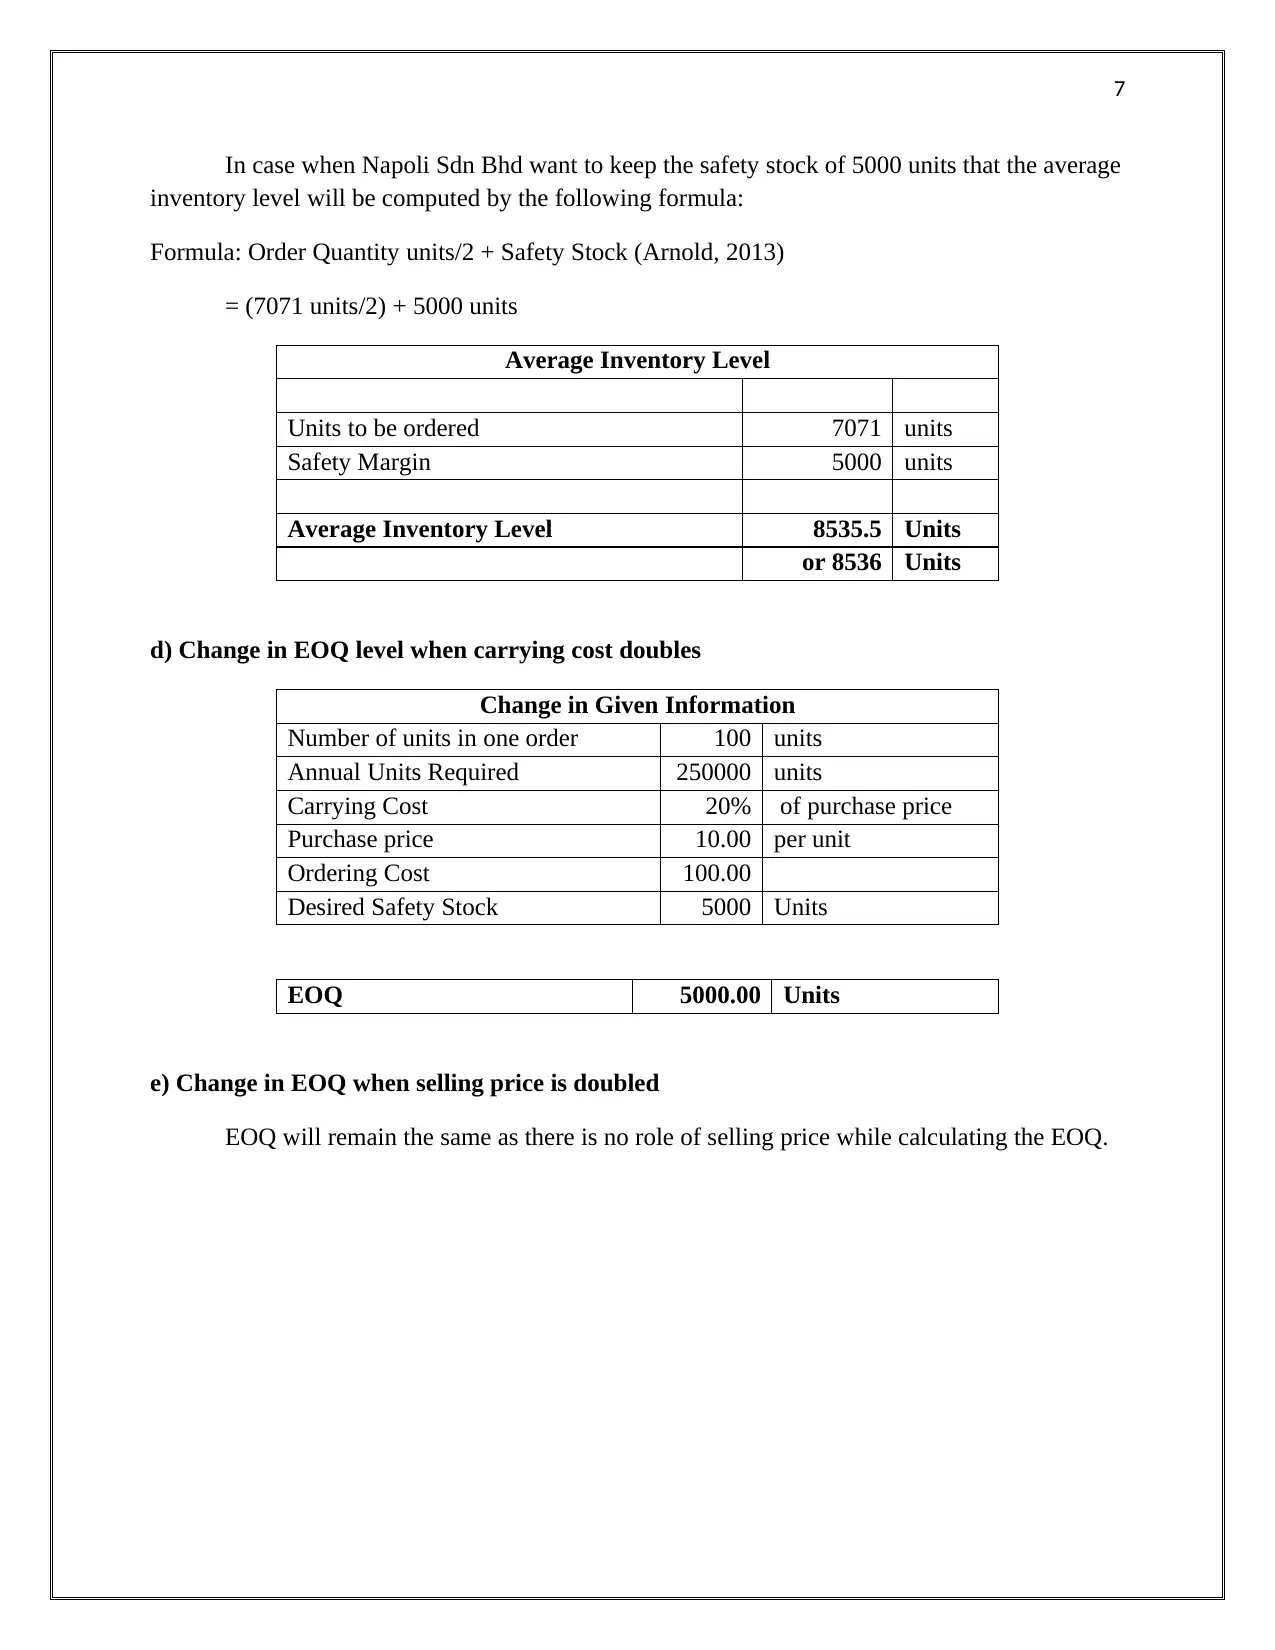
In case when Napoli Sdn Bhd want to keep the safety stock of 5000 units that the average
inventory level will be computed by the following formula:
Formula: Order Quantity units/2 + Safety Stock (Arnold, 2013)
= (7071 units/2) + 5000 units
Average Inventory Level
Units to be ordered 7071 units
Safety Margin 5000 units
Average Inventory Level 8535.5 Units
or 8536 Units
d) Change in EOQ level when carrying cost doubles
Change in Given Information
Number of units in one order 100 units
Annual Units Required 250000 units
Carrying Cost 20% of purchase price
Purchase price 10.00 per unit
Ordering Cost 100.00
Desired Safety Stock 5000 Units
EOQ 5000.00 Units
e) Change in EOQ when selling price is doubled
EOQ will remain the same as there is no role of selling price while calculating the EOQ.
Paraphrase This Document
Need a fresh take? Get an instant paraphrase of this document with our AI Paraphraser
8
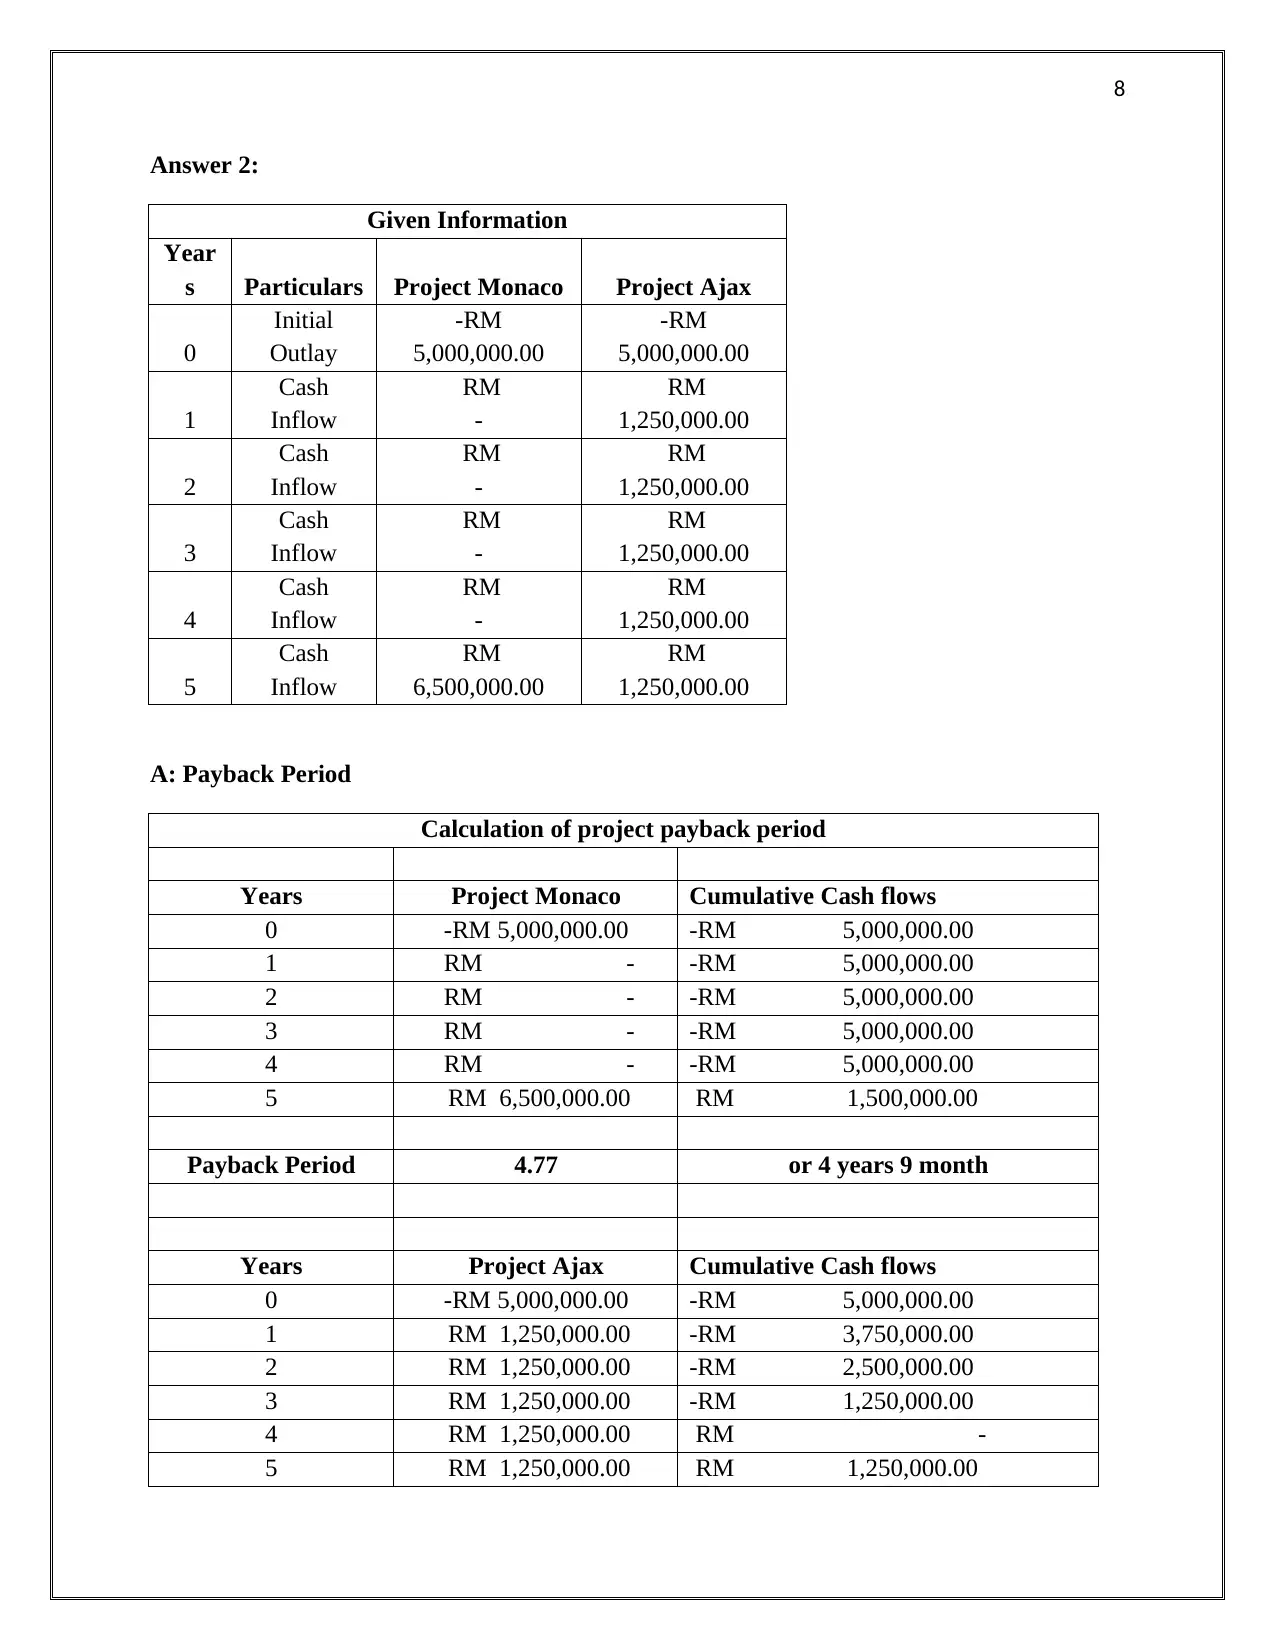
Answer 2:
Given Information
Year
s Particulars Project Monaco Project Ajax
0
Initial
Outlay
-RM
5,000,000.00
-RM
5,000,000.00
1
Cash
Inflow
RM
-
RM
1,250,000.00
2
Cash
Inflow
RM
-
RM
1,250,000.00
3
Cash
Inflow
RM
-
RM
1,250,000.00
4
Cash
Inflow
RM
-
RM
1,250,000.00
5
Cash
Inflow
RM
6,500,000.00
RM
1,250,000.00
A: Payback Period
Calculation of project payback period
Years Project Monaco Cumulative Cash flows
0 -RM 5,000,000.00 -RM 5,000,000.00
1 RM - -RM 5,000,000.00
2 RM - -RM 5,000,000.00
3 RM - -RM 5,000,000.00
4 RM - -RM 5,000,000.00
5 RM 6,500,000.00 RM 1,500,000.00
Payback Period 4.77 or 4 years 9 month
Years Project Ajax Cumulative Cash flows
0 -RM 5,000,000.00 -RM 5,000,000.00
1 RM 1,250,000.00 -RM 3,750,000.00
2 RM 1,250,000.00 -RM 2,500,000.00
3 RM 1,250,000.00 -RM 1,250,000.00
4 RM 1,250,000.00 RM -
5 RM 1,250,000.00 RM 1,250,000.00
9
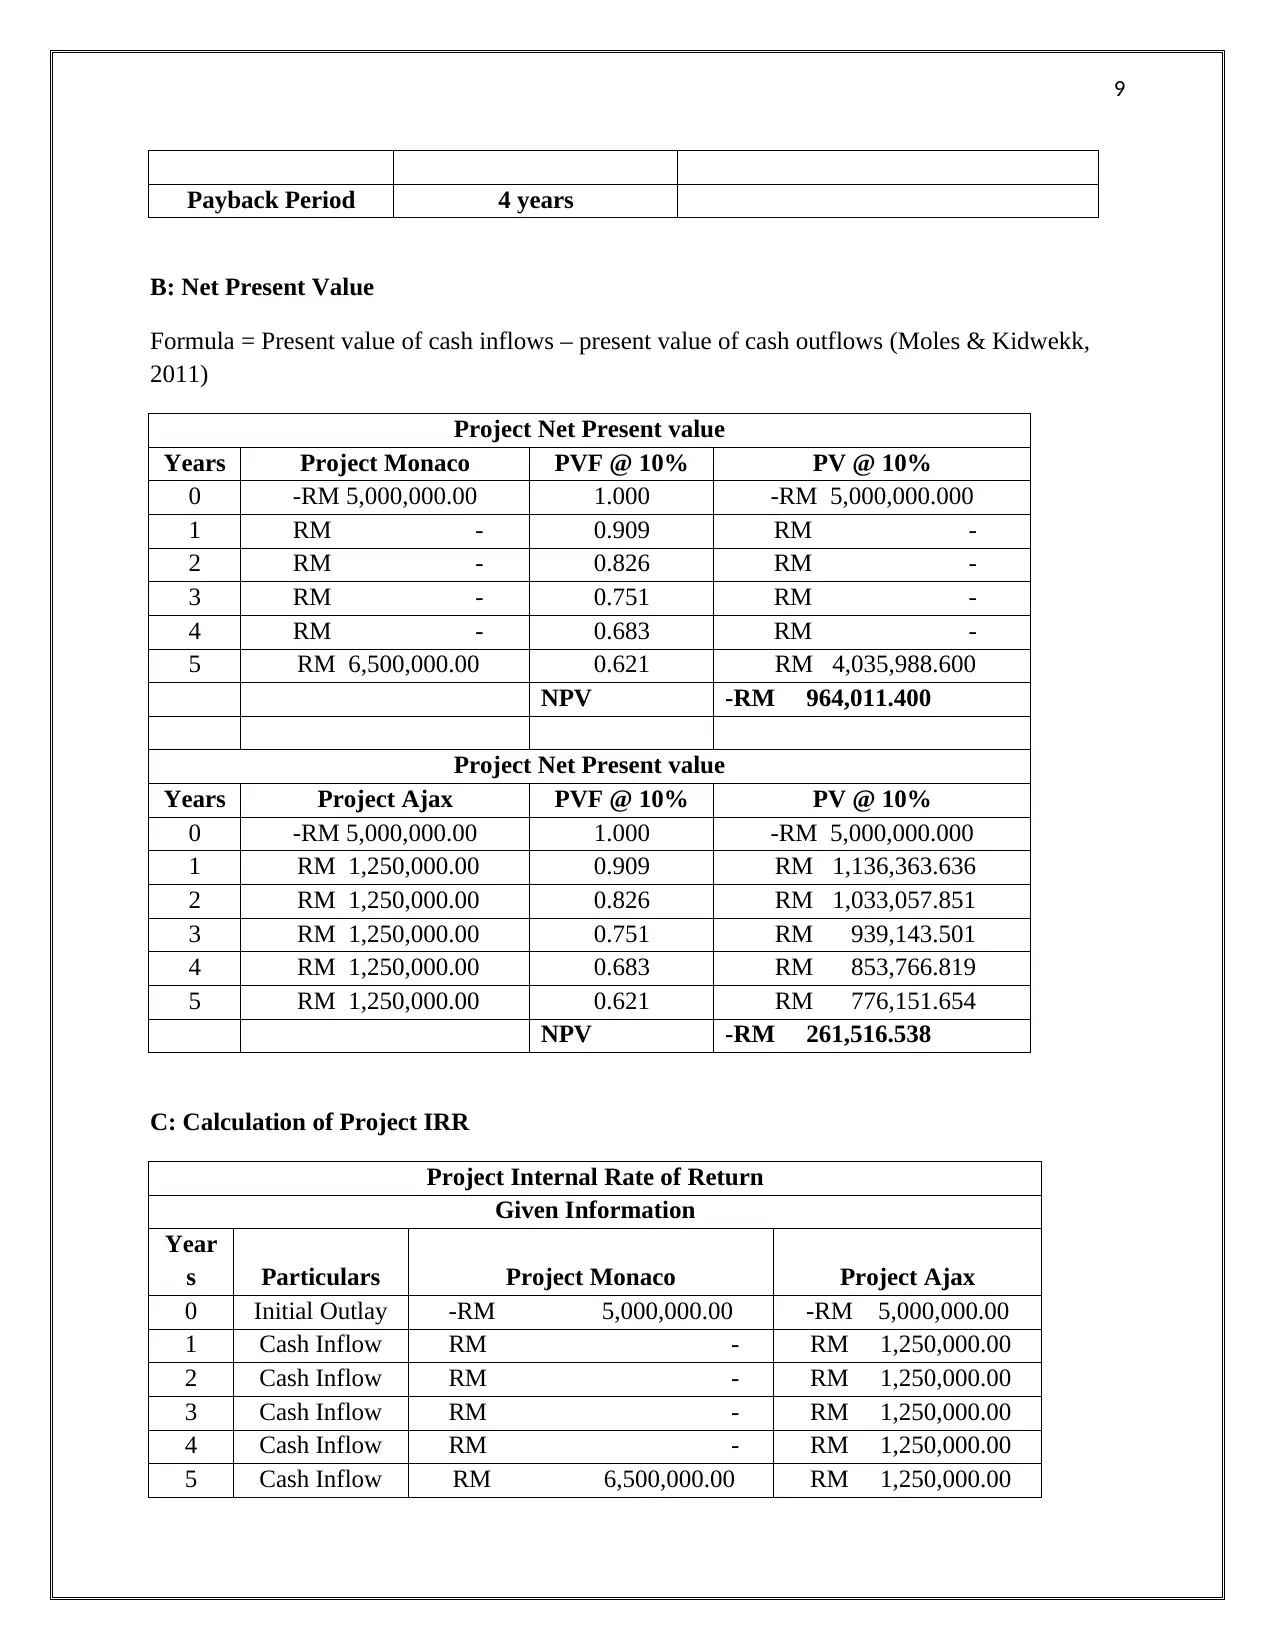
Payback Period 4 years
B: Net Present Value
Formula = Present value of cash inflows – present value of cash outflows (Moles & Kidwekk,
2011)
Project Net Present value
Years Project Monaco PVF @ 10% PV @ 10%
0 -RM 5,000,000.00 1.000 -RM 5,000,000.000
1 RM - 0.909 RM -
2 RM - 0.826 RM -
3 RM - 0.751 RM -
4 RM - 0.683 RM -
5 RM 6,500,000.00 0.621 RM 4,035,988.600
NPV -RM 964,011.400
Project Net Present value
Years Project Ajax PVF @ 10% PV @ 10%
0 -RM 5,000,000.00 1.000 -RM 5,000,000.000
1 RM 1,250,000.00 0.909 RM 1,136,363.636
2 RM 1,250,000.00 0.826 RM 1,033,057.851
3 RM 1,250,000.00 0.751 RM 939,143.501
4 RM 1,250,000.00 0.683 RM 853,766.819
5 RM 1,250,000.00 0.621 RM 776,151.654
NPV -RM 261,516.538
C: Calculation of Project IRR
Project Internal Rate of Return
Given Information
Year
s Particulars Project Monaco Project Ajax
0 Initial Outlay -RM 5,000,000.00 -RM 5,000,000.00
1 Cash Inflow RM - RM 1,250,000.00
2 Cash Inflow RM - RM 1,250,000.00
3 Cash Inflow RM - RM 1,250,000.00
4 Cash Inflow RM - RM 1,250,000.00
5 Cash Inflow RM 6,500,000.00 RM 1,250,000.00
⊘ This is a preview!⊘
Do you want full access?
Subscribe today to unlock all pages.
Trusted by 1+ million students worldwide
10
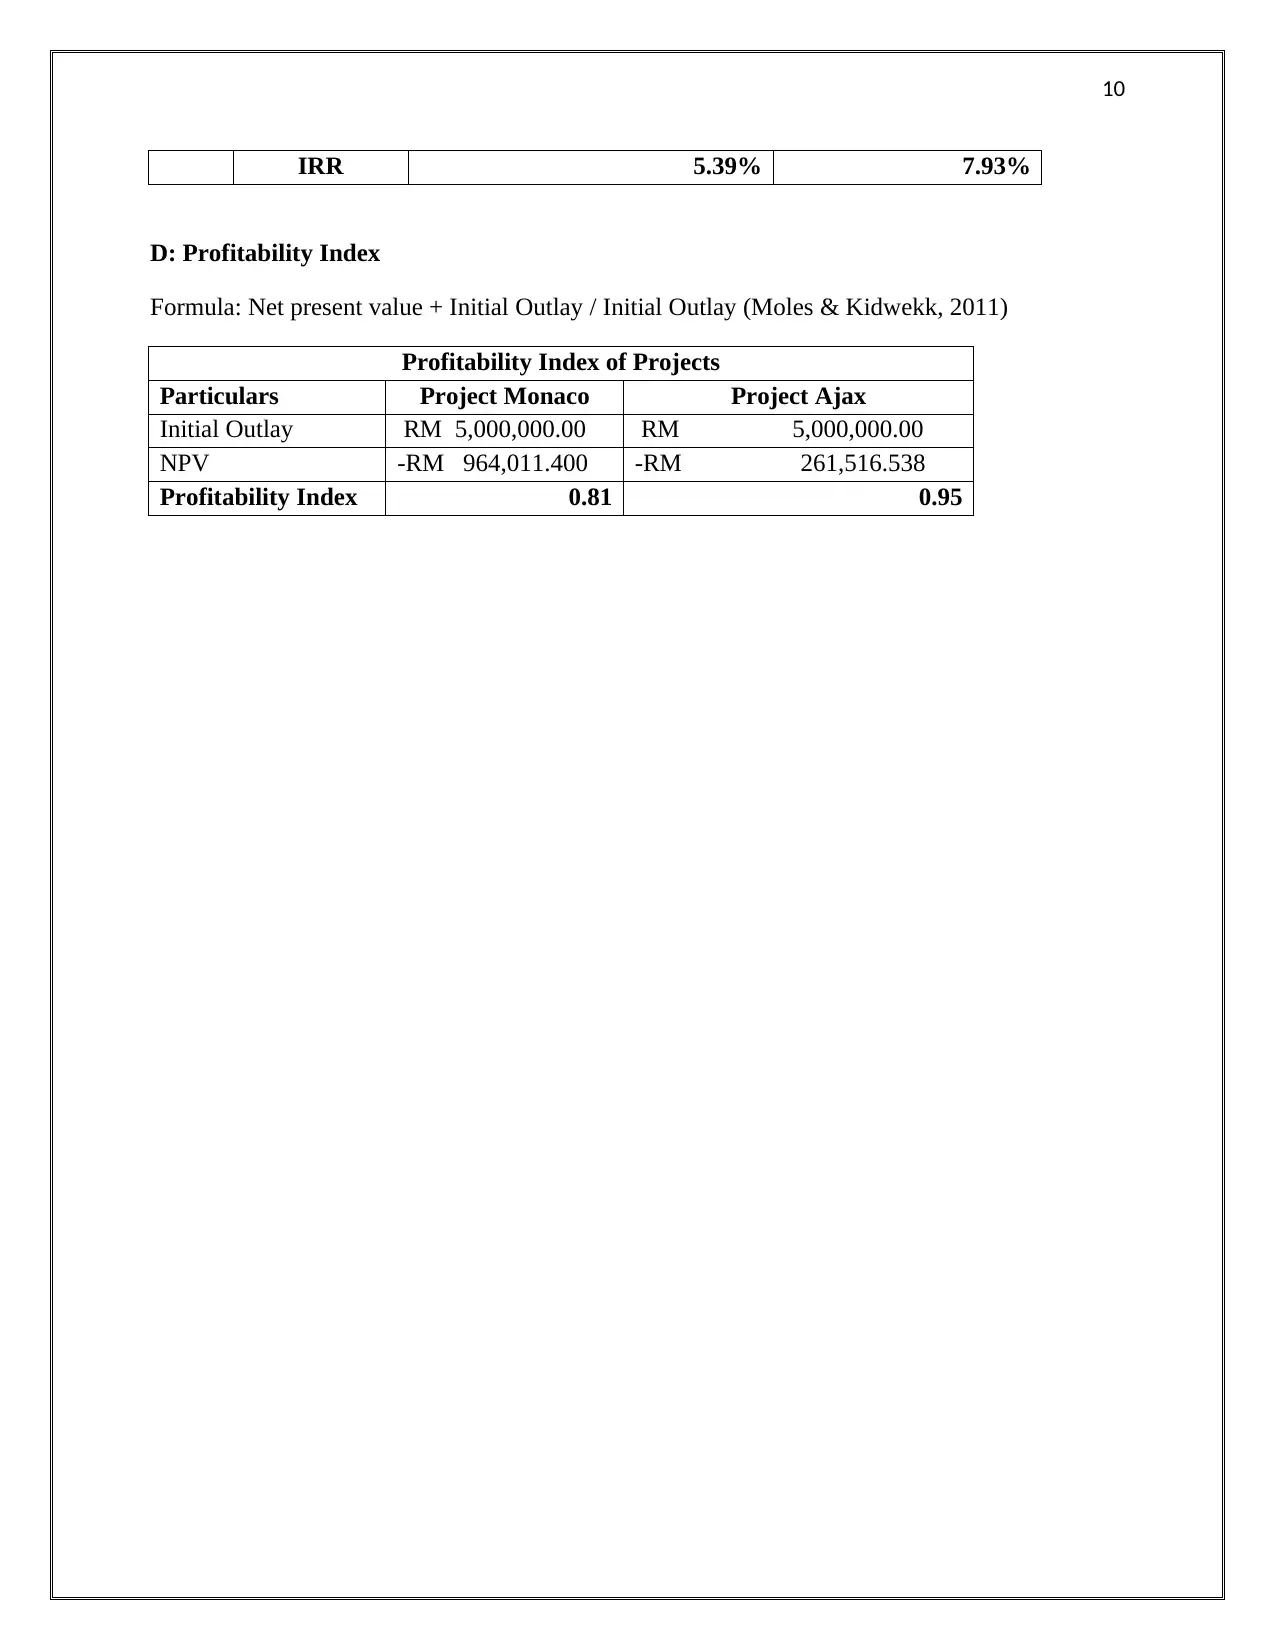
IRR 5.39% 7.93%
D: Profitability Index
Formula: Net present value + Initial Outlay / Initial Outlay (Moles & Kidwekk, 2011)
Profitability Index of Projects
Particulars Project Monaco Project Ajax
Initial Outlay RM 5,000,000.00 RM 5,000,000.00
NPV -RM 964,011.400 -RM 261,516.538
Profitability Index 0.81 0.95
Paraphrase This Document
Need a fresh take? Get an instant paraphrase of this document with our AI Paraphraser
11
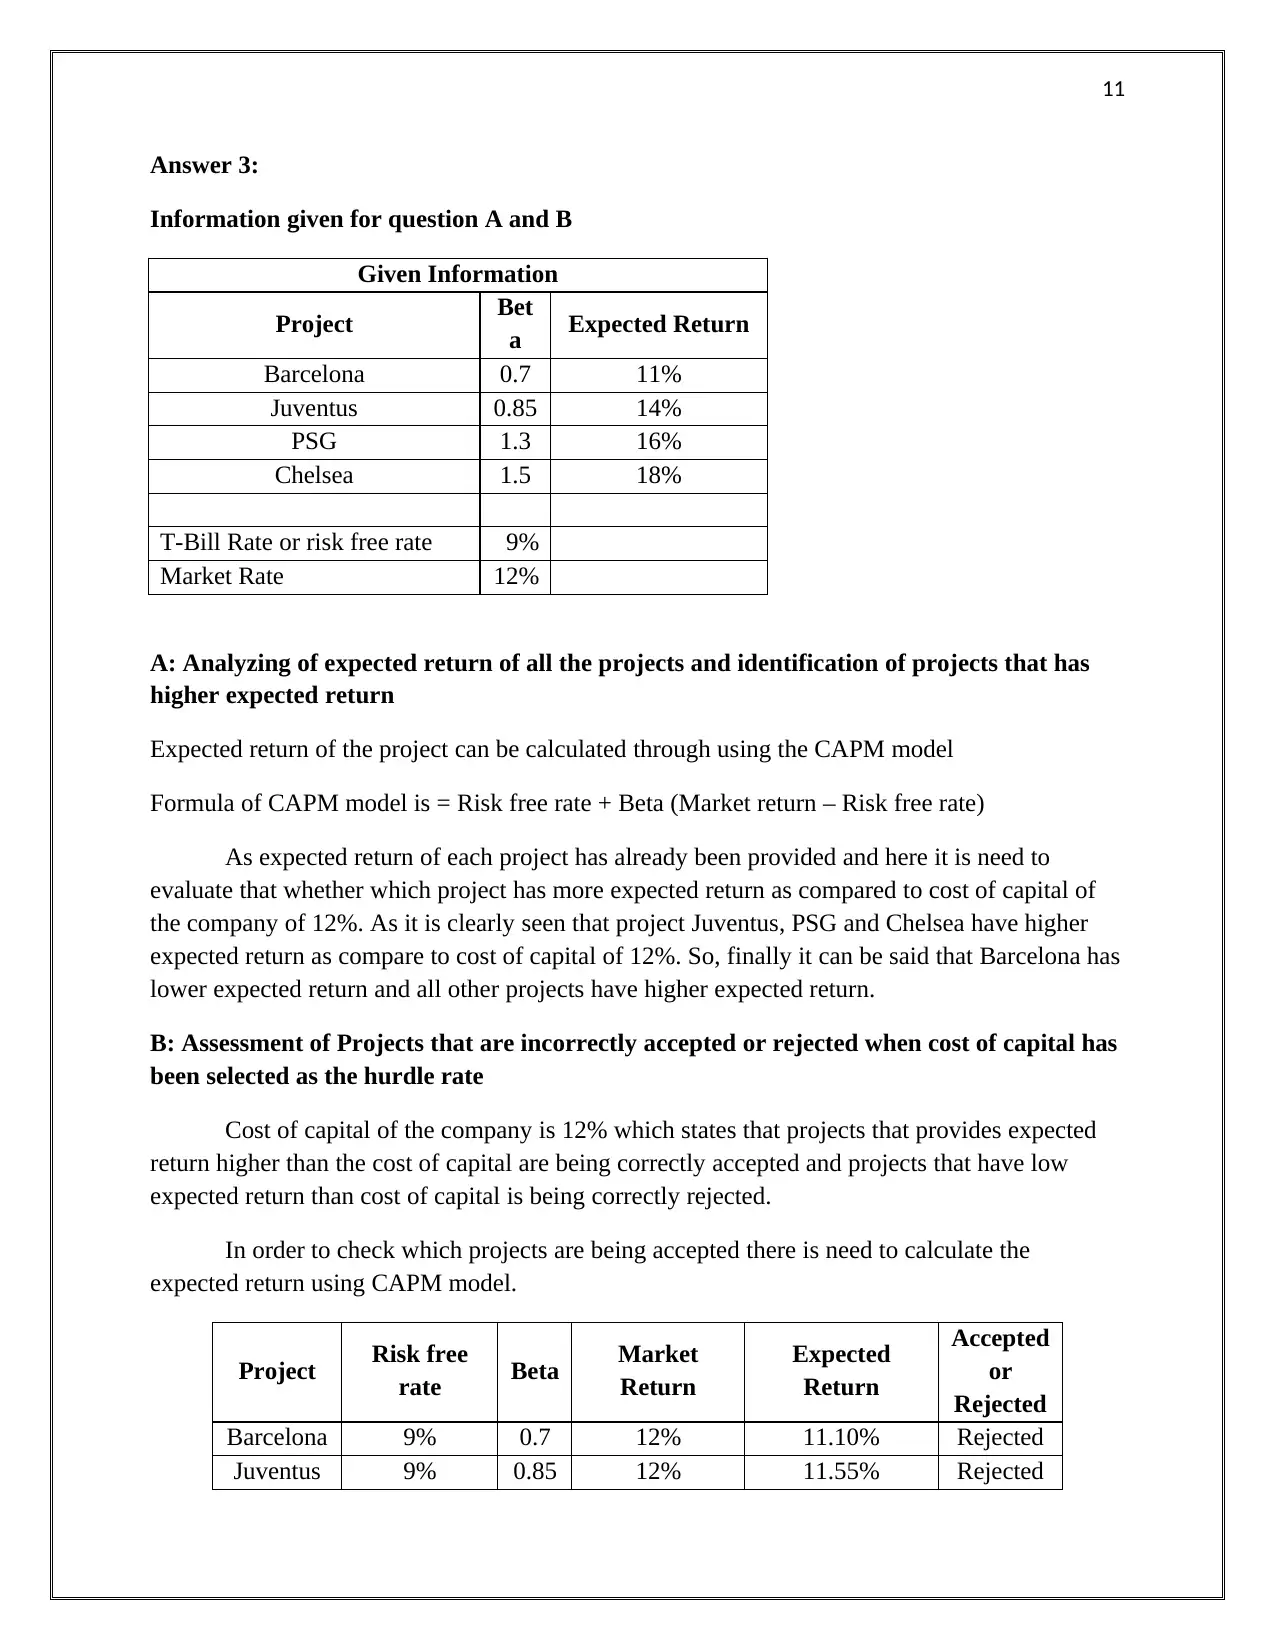
Answer 3:
Information given for question A and B
Given Information
Project Bet
a Expected Return
Barcelona 0.7 11%
Juventus 0.85 14%
PSG 1.3 16%
Chelsea 1.5 18%
T-Bill Rate or risk free rate 9%
Market Rate 12%
A: Analyzing of expected return of all the projects and identification of projects that has
higher expected return
Expected return of the project can be calculated through using the CAPM model
Formula of CAPM model is = Risk free rate + Beta (Market return – Risk free rate)
As expected return of each project has already been provided and here it is need to
evaluate that whether which project has more expected return as compared to cost of capital of
the company of 12%. As it is clearly seen that project Juventus, PSG and Chelsea have higher
expected return as compare to cost of capital of 12%. So, finally it can be said that Barcelona has
lower expected return and all other projects have higher expected return.
B: Assessment of Projects that are incorrectly accepted or rejected when cost of capital has
been selected as the hurdle rate
Cost of capital of the company is 12% which states that projects that provides expected
return higher than the cost of capital are being correctly accepted and projects that have low
expected return than cost of capital is being correctly rejected.
In order to check which projects are being accepted there is need to calculate the
expected return using CAPM model.
Project Risk free
rate Beta Market
Return
Expected
Return
Accepted
or
Rejected
Barcelona 9% 0.7 12% 11.10% Rejected
Juventus 9% 0.85 12% 11.55% Rejected
12
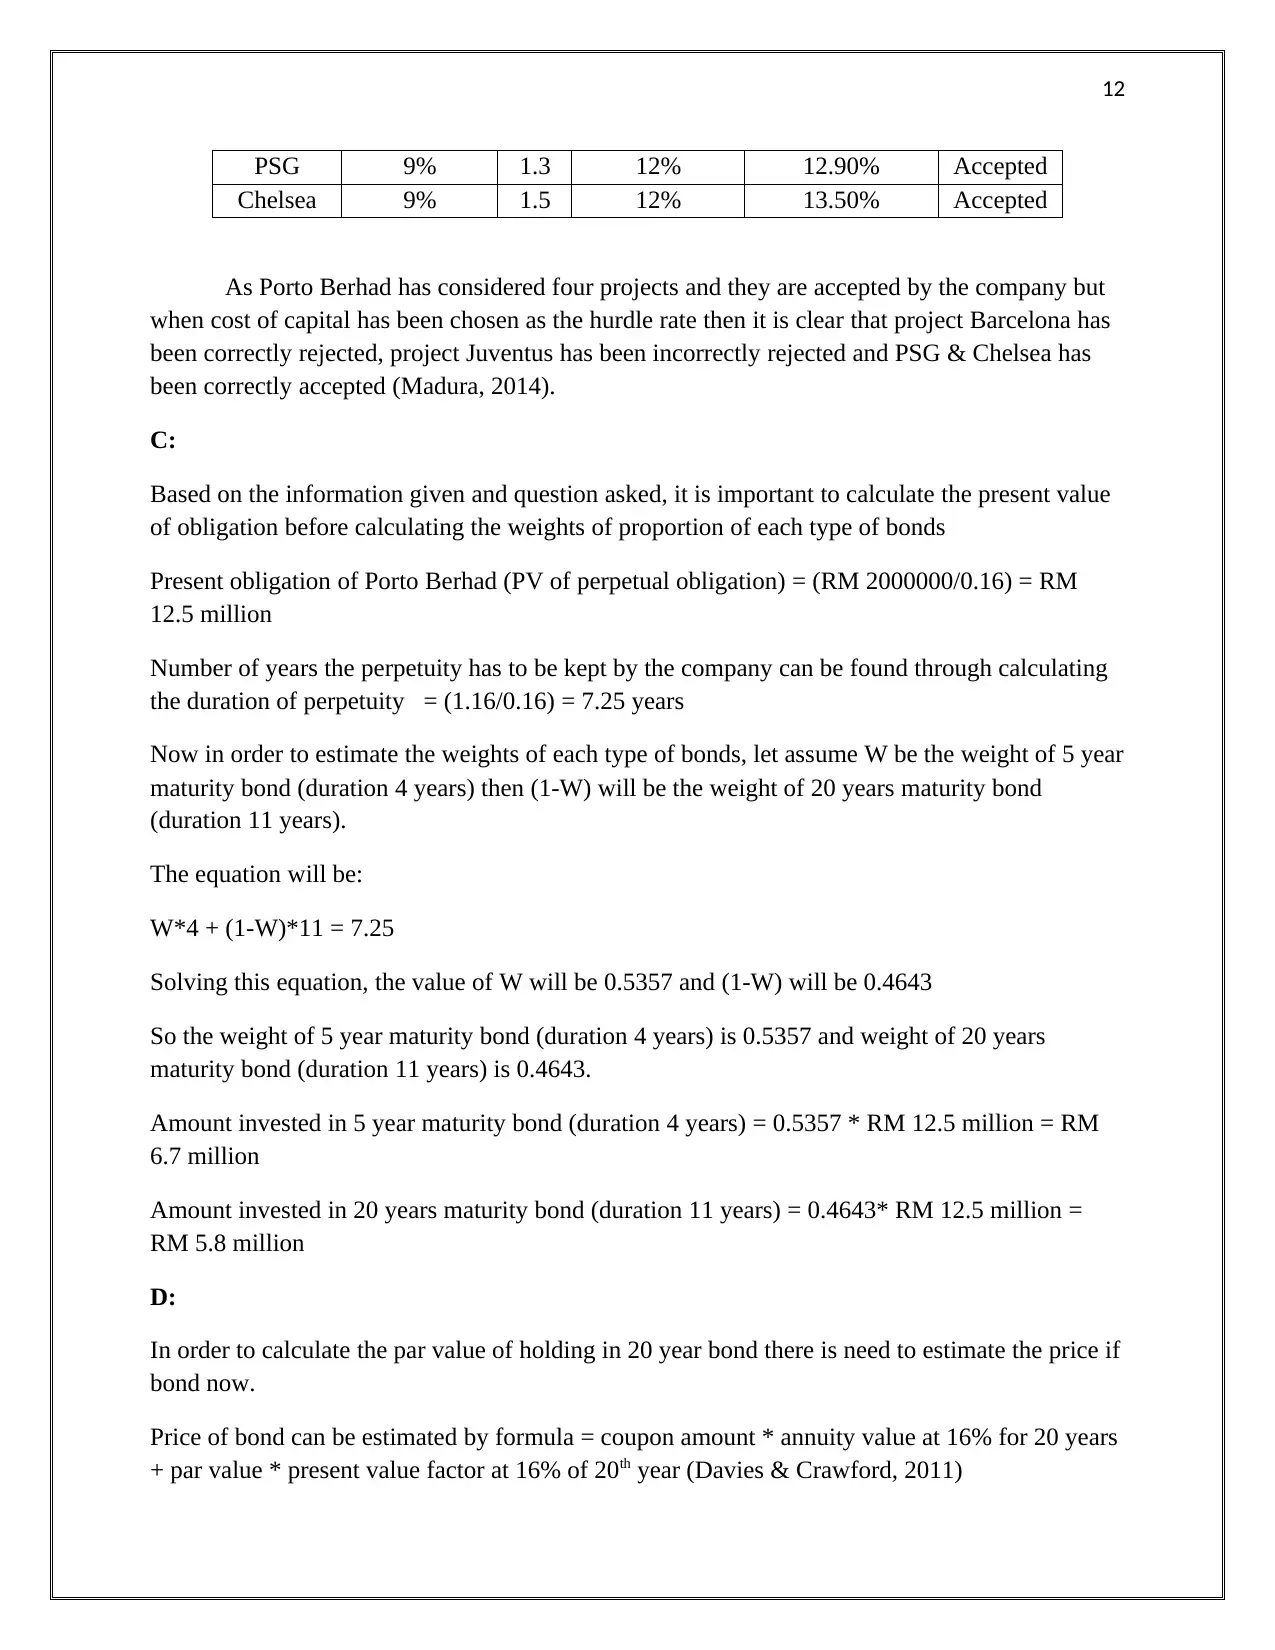
PSG 9% 1.3 12% 12.90% Accepted
Chelsea 9% 1.5 12% 13.50% Accepted
As Porto Berhad has considered four projects and they are accepted by the company but
when cost of capital has been chosen as the hurdle rate then it is clear that project Barcelona has
been correctly rejected, project Juventus has been incorrectly rejected and PSG & Chelsea has
been correctly accepted (Madura, 2014).
C:
Based on the information given and question asked, it is important to calculate the present value
of obligation before calculating the weights of proportion of each type of bonds
Present obligation of Porto Berhad (PV of perpetual obligation) = (RM 2000000/0.16) = RM
12.5 million
Number of years the perpetuity has to be kept by the company can be found through calculating
the duration of perpetuity = (1.16/0.16) = 7.25 years
Now in order to estimate the weights of each type of bonds, let assume W be the weight of 5 year
maturity bond (duration 4 years) then (1-W) will be the weight of 20 years maturity bond
(duration 11 years).
The equation will be:
W*4 + (1-W)*11 = 7.25
Solving this equation, the value of W will be 0.5357 and (1-W) will be 0.4643
So the weight of 5 year maturity bond (duration 4 years) is 0.5357 and weight of 20 years
maturity bond (duration 11 years) is 0.4643.
Amount invested in 5 year maturity bond (duration 4 years) = 0.5357 * RM 12.5 million = RM
6.7 million
Amount invested in 20 years maturity bond (duration 11 years) = 0.4643* RM 12.5 million =
RM 5.8 million
D:
In order to calculate the par value of holding in 20 year bond there is need to estimate the price if
bond now.
Price of bond can be estimated by formula = coupon amount * annuity value at 16% for 20 years
+ par value * present value factor at 16% of 20th year (Davies & Crawford, 2011)
⊘ This is a preview!⊘
Do you want full access?
Subscribe today to unlock all pages.
Trusted by 1+ million students worldwide
1 out of 17
Related Documents


Your All-in-One AI-Powered Toolkit for Academic Success.
+13062052269
info@desklib.com
Available 24*7 on WhatsApp / Email
![[object Object]](/_next/static/media/star-bottom.7253800d.svg)
Unlock your academic potential
Copyright © 2020–2026 A2Z Services. All Rights Reserved. Developed and managed by ZUCOL.