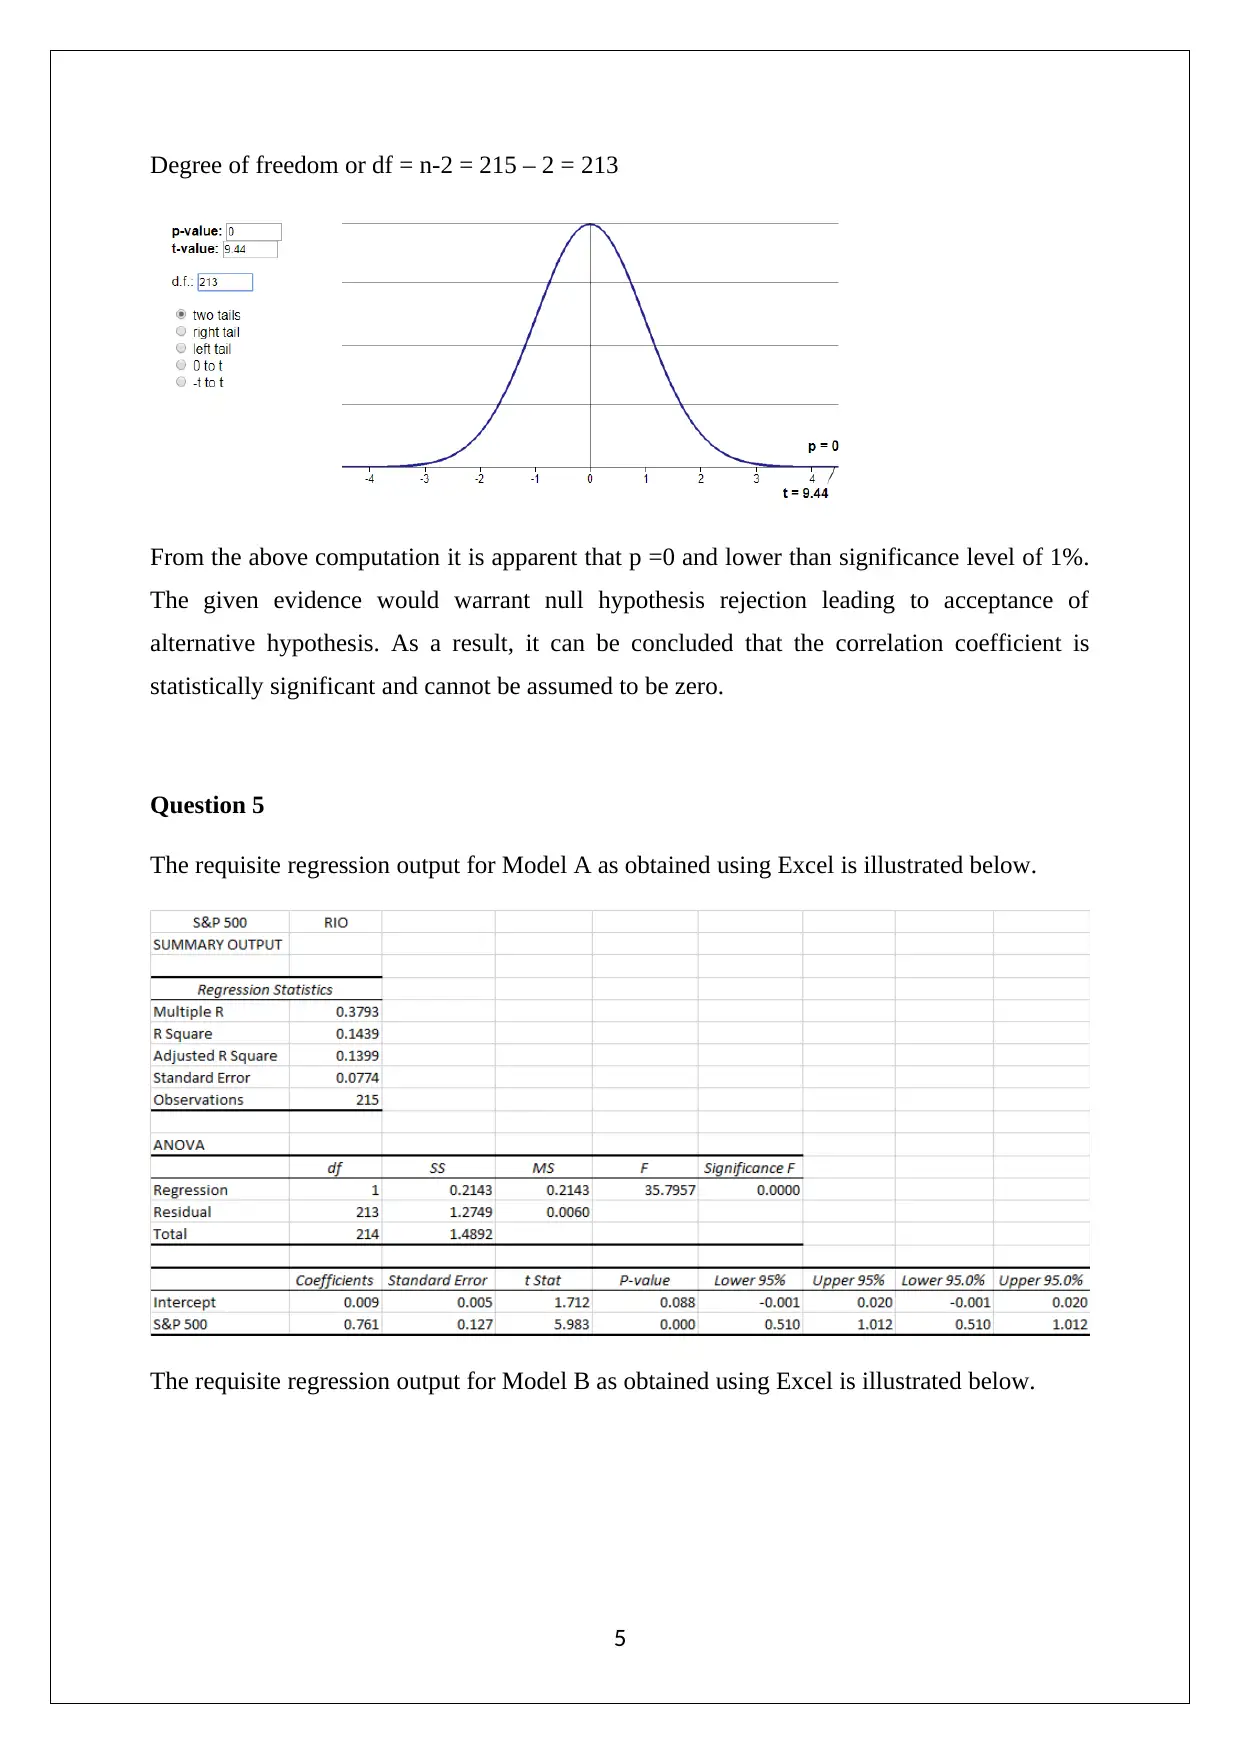
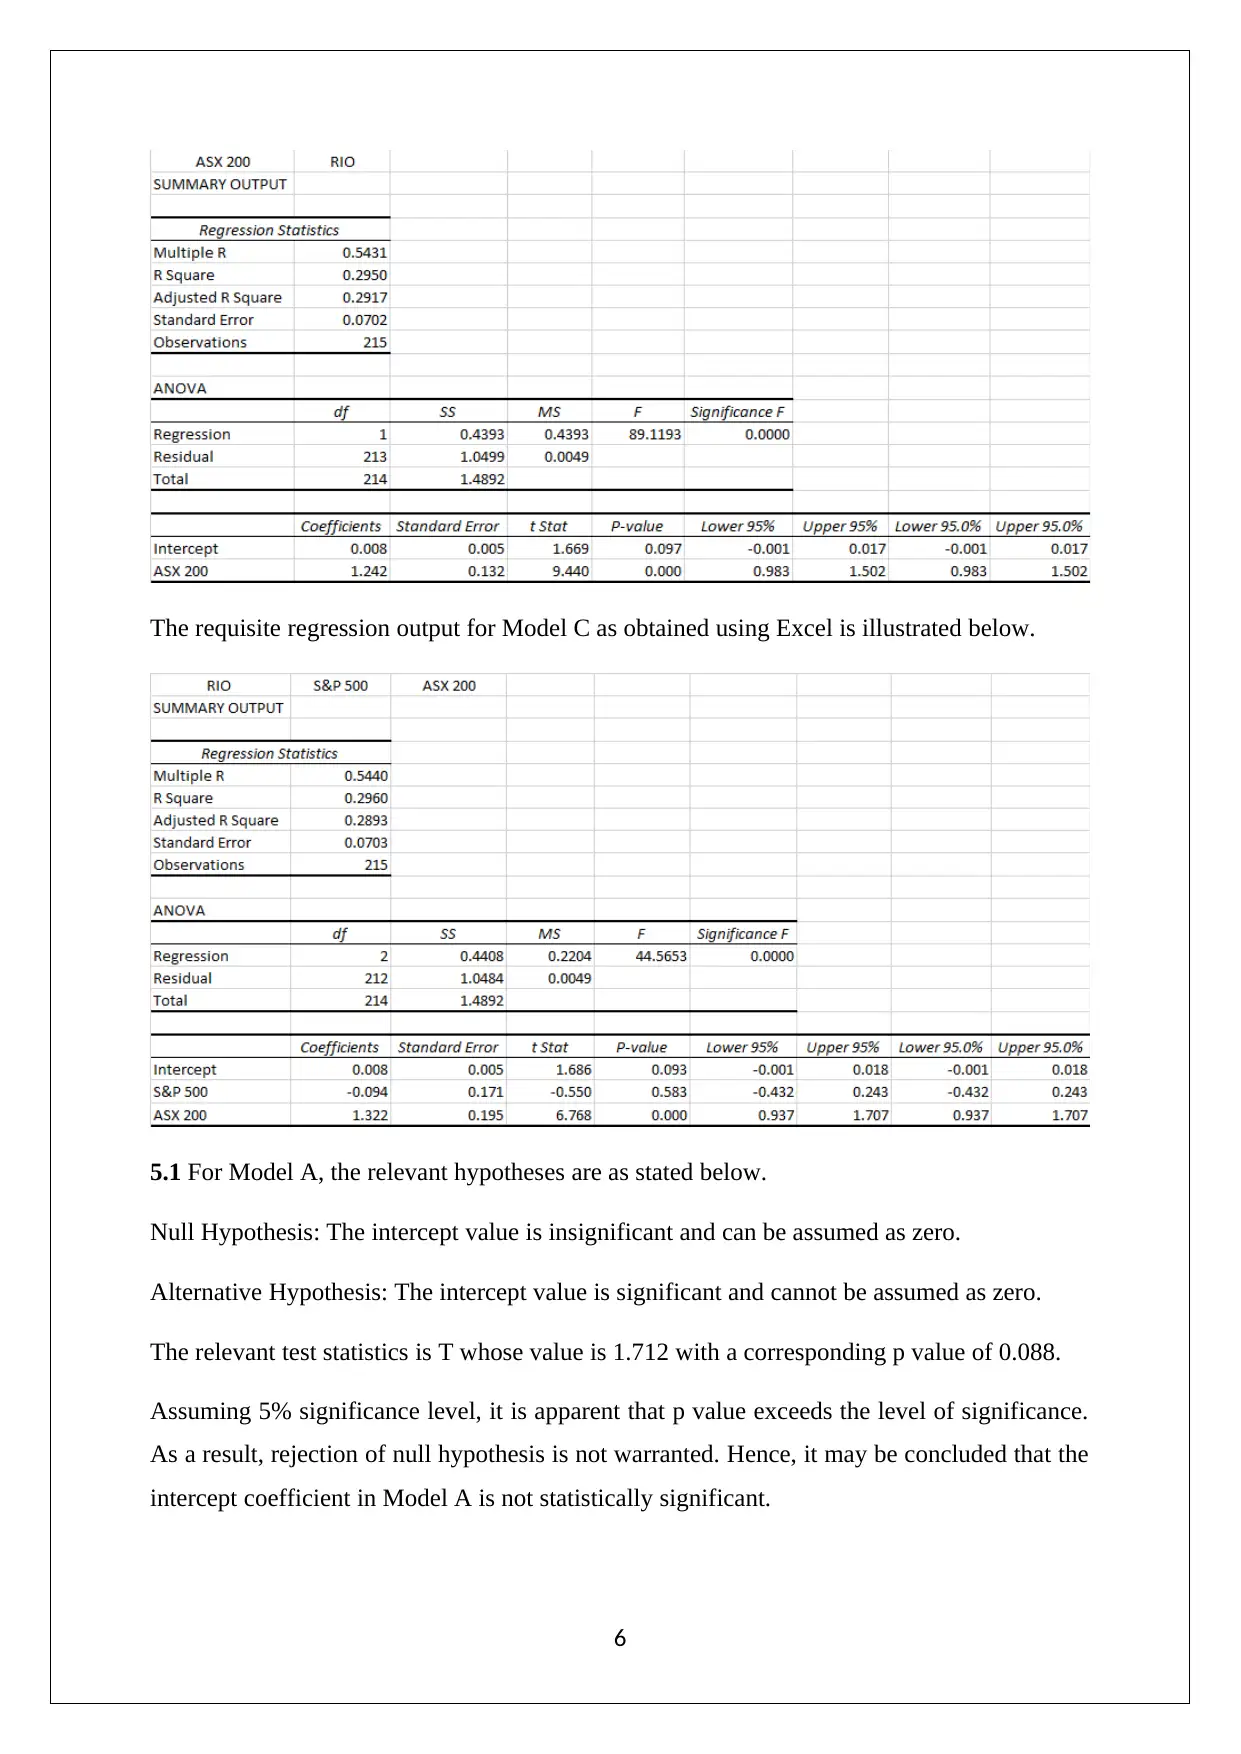
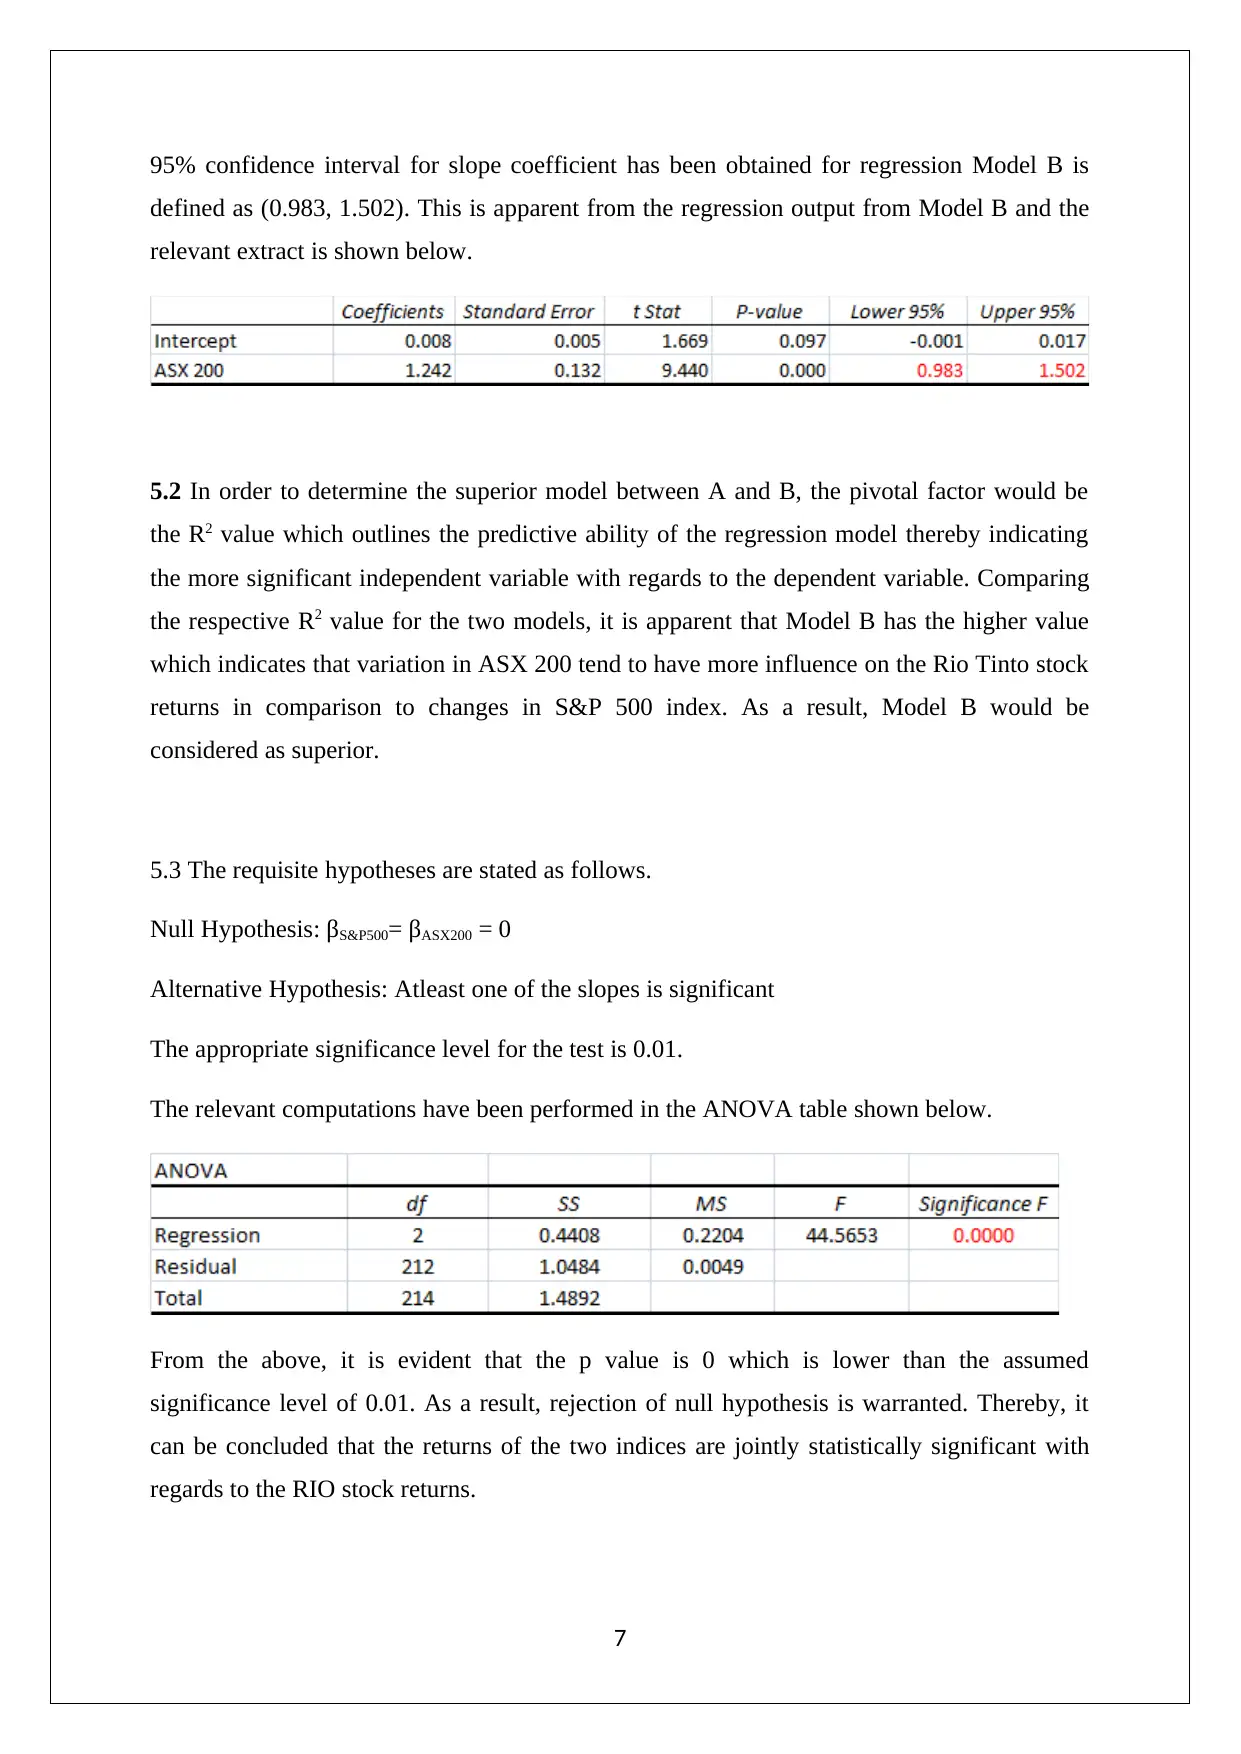
MAF759 Analytical Methods Assignment: Stock Performance Analysis
VerifiedAdded on 2023/03/17
|7
|840
|61
Homework Assignment
AI Summary
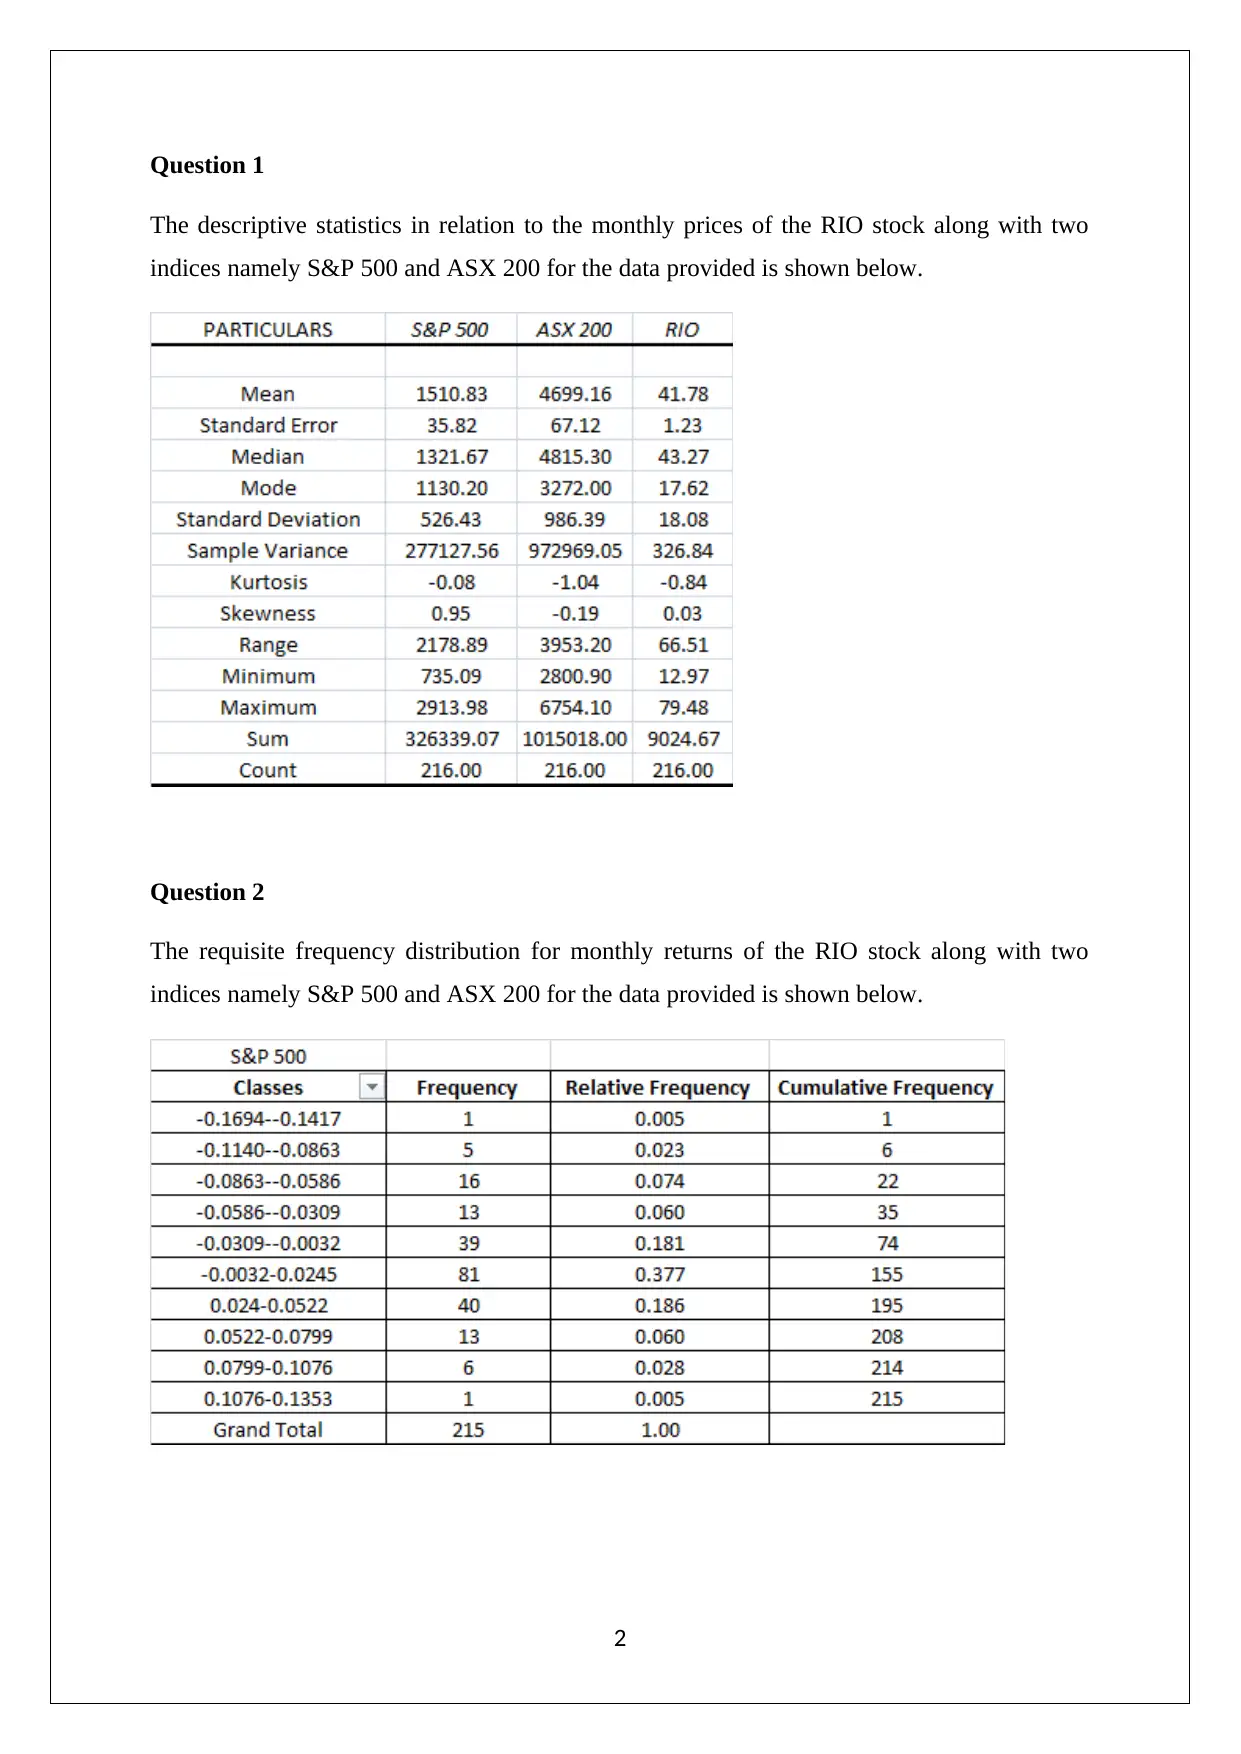
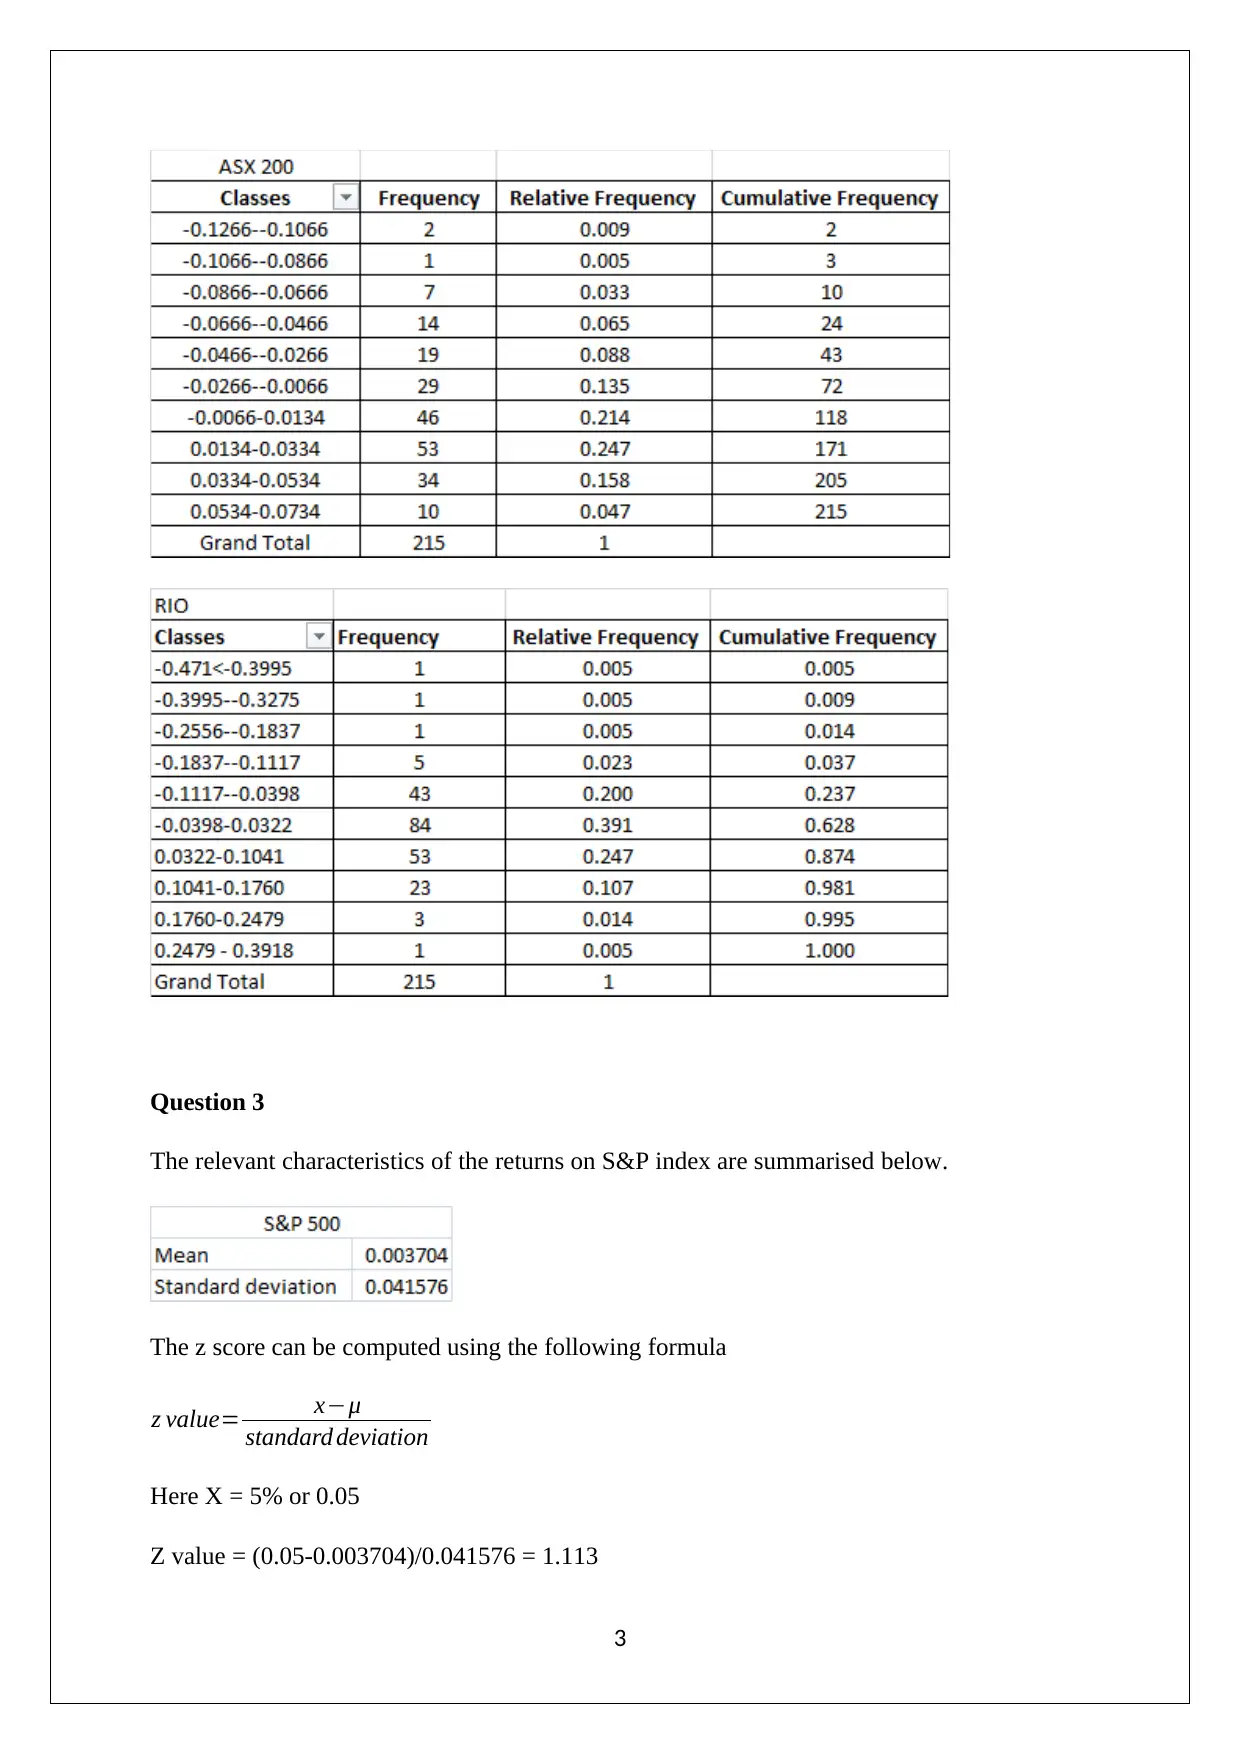
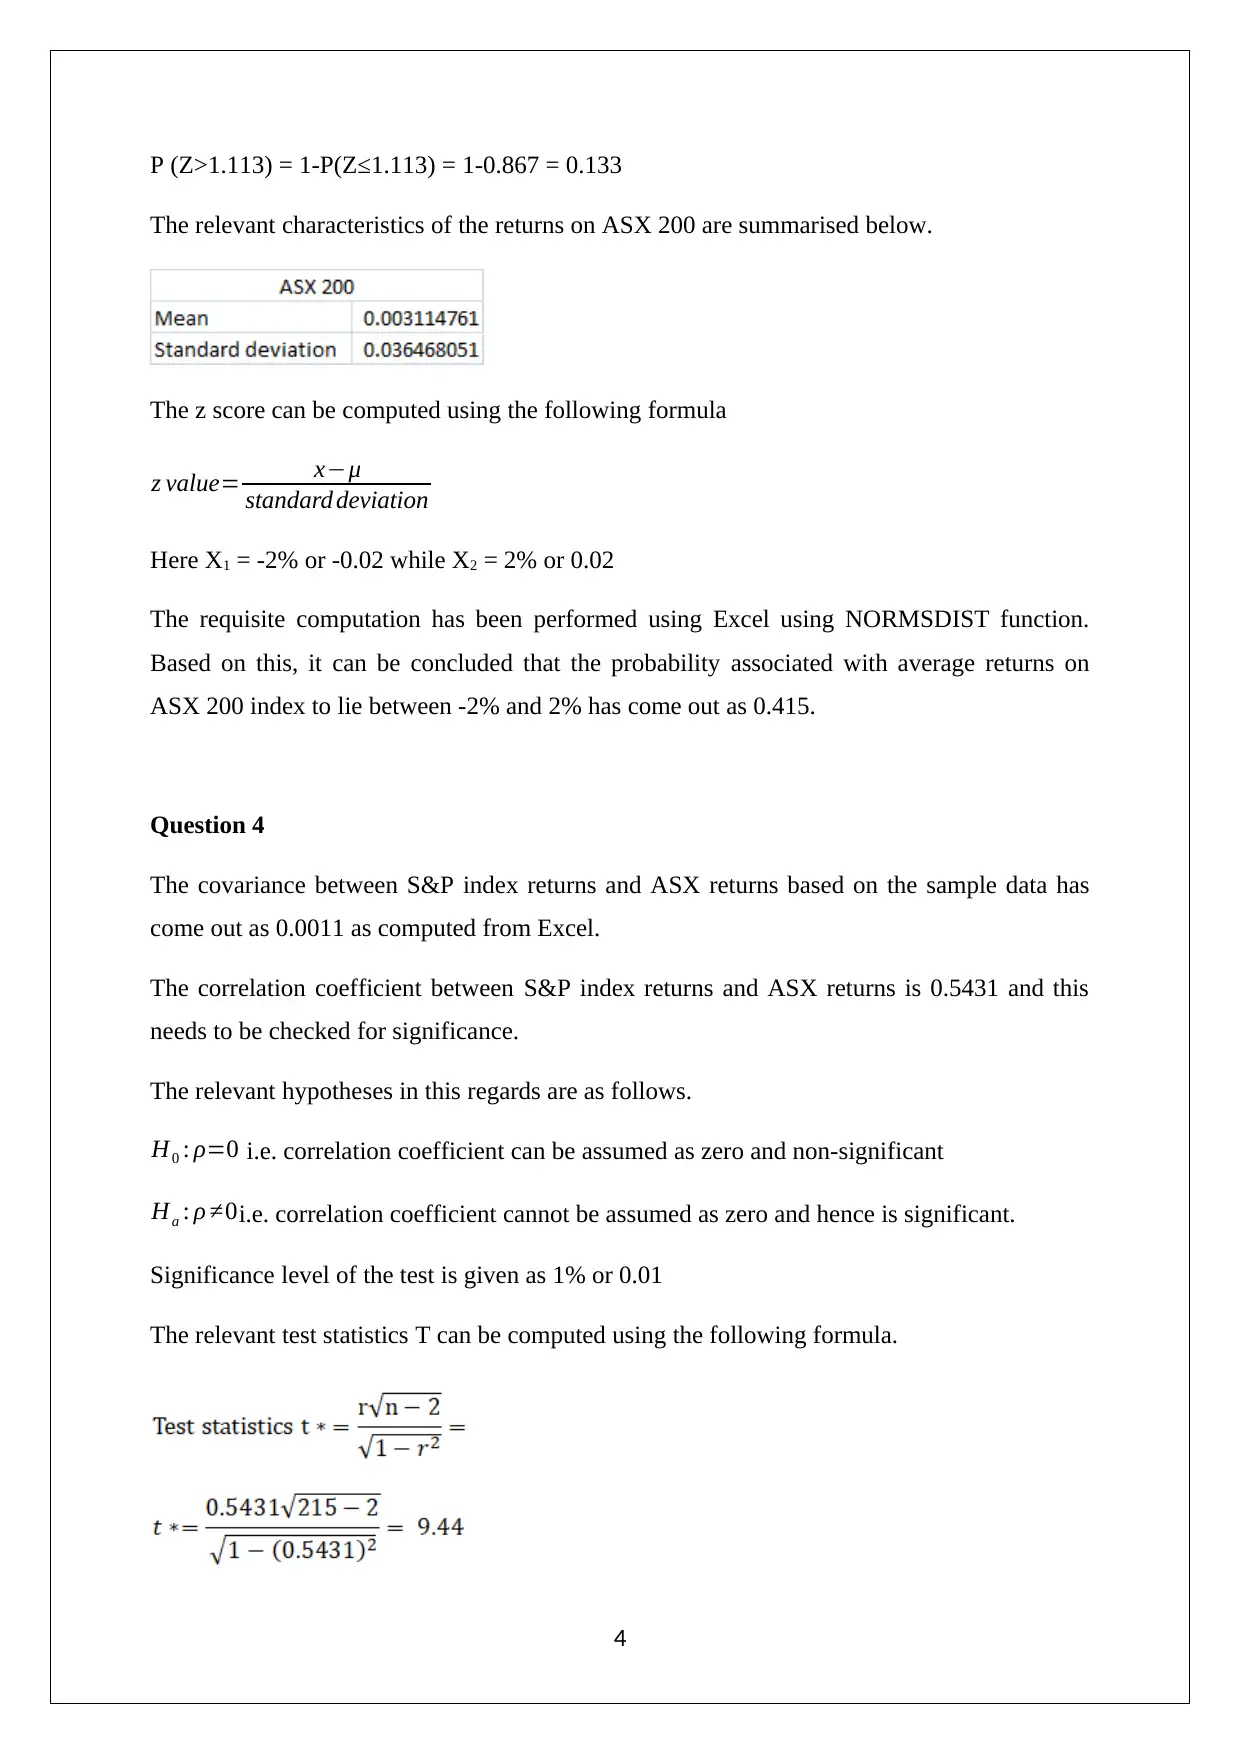
This assignment solution analyzes the performance of Rio Tinto Limited (RIO) stock, along with the S&P 500 and ASX 200 indices, using data from January 2001 to December 2018. The solution begins by computing descriptive statistics for monthly prices of RIO, S&P 500, and ASX 200. It then calculates monthly discrete returns and constructs frequency distributions for the same. The analysis includes the calculation of z-scores and probabilities for the S&P 500 and ASX 200 returns. Further, it determines the covariance and correlation coefficient between the S&P 500 and ASX 200 returns, testing for statistical significance. The solution also presents regression outputs for three models, comparing their predictive abilities based on R-squared values and testing the significance of intercept and slope coefficients. Finally, the solution uses ANOVA to assess the joint statistical significance of the two indices' returns on the RIO stock returns, providing a complete and detailed analysis of the financial data.
1 out of 7
Related Documents


Your All-in-One AI-Powered Toolkit for Academic Success.
+13062052269
info@desklib.com
Available 24*7 on WhatsApp / Email
![[object Object]](/_next/static/media/star-bottom.7253800d.svg)
Copyright © 2020–2026 A2Z Services. All Rights Reserved. Developed and managed by ZUCOL.