Analytics and Business Intelligence Platforms Magic Quadrant Report
VerifiedAdded on 2019/10/18
|8
|2557
|331
Report
AI Summary
This report provides an executive summary and detailed analysis of the Magic Quadrant for Analytics and Business Intelligence (BI) platforms, with a focus on TIBCO and Tableau. It highlights the increasing importance of data in today's world, emphasizing the need for robust data management and security. The report discusses data sources, management techniques, and the challenges associated with big data, including privacy concerns and ethical issues. A SWOT analysis of Tableau and TIBCO is presented, comparing their strengths, weaknesses, opportunities, and threats. The report also explores the role of tools like Hadoop and MapReduce. Furthermore, the report touches upon network performance management, the significance of virtualized infrastructure monitoring, and the utilization of big data for gaining knowledge and addressing various problems. The report concludes with the importance of adapting BI tools to meet evolving user needs and the quality considerations for connected car technology.
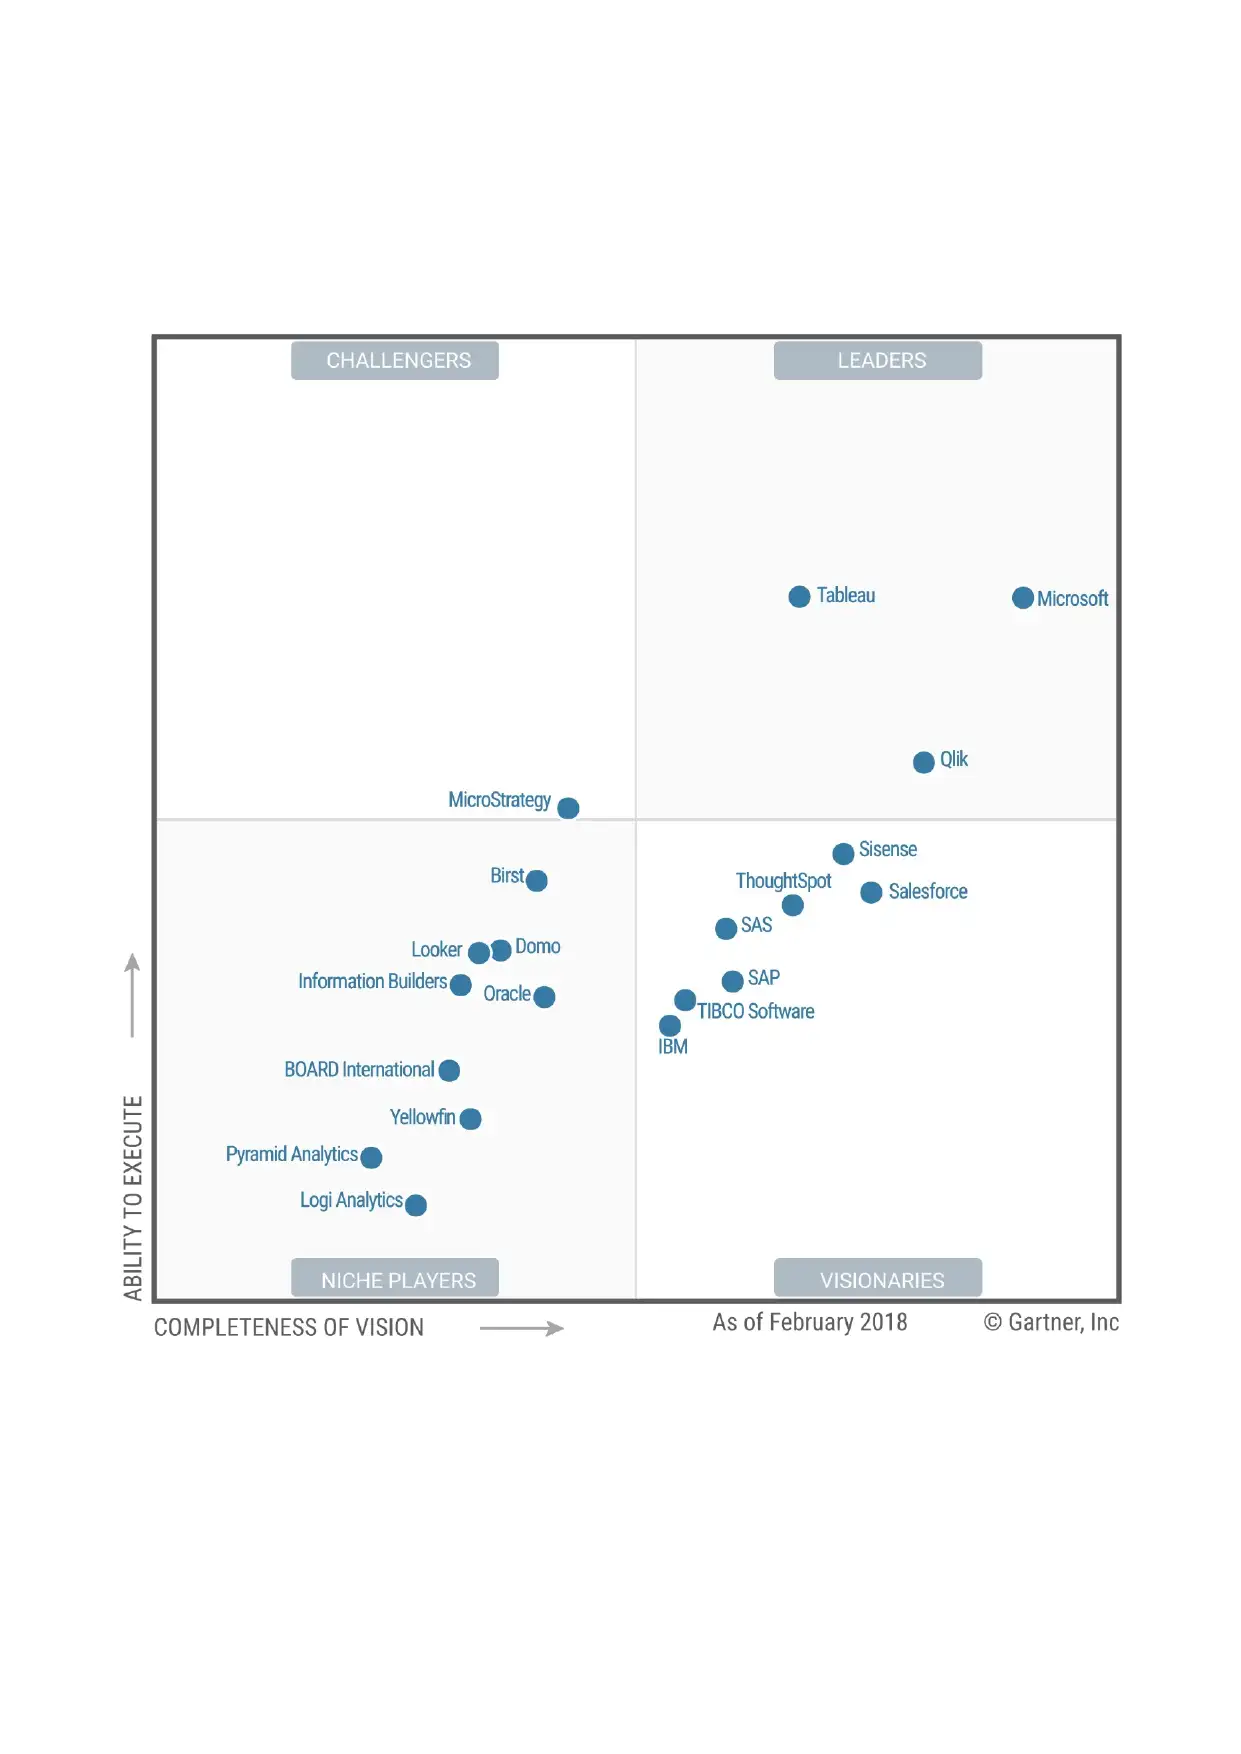
Magic Quadrant for Analytics and Business Intelligence Platforms
Paraphrase This Document
Need a fresh take? Get an instant paraphrase of this document with our AI Paraphraser
Executive Summary
In recent time data and information is knowledge and knowledge is power and invariably power
converts into money. Now the more the data you have the more money you make. It is proved that
data & information both work as a support system for both consumer and business. TIBCO and
Tableau is a powerful and well rounded platform with deployment and development capabilities.
The main problem arises when privacy is invaded, as well as sensitive information and data is lost
and stored. Due to this individual or company security and privacy ethics become very vulnerable.
Many of the business houses use so many advanced algorithmic analysis to extract data and
information so that they can use it to spot the trends of the market and also prevent the different
ethical issues. The way nowadays people use the internet, it is a very high probability that someone
out there knows more about the people than people know about himself. Misuse of information is
also coming under major risk. The information which is obtained ethically can be used for different
unethical purposes. If any one want to bring togather all the facilities in one umbrella then it is
TIBCO and Tableau. Here in this report ,all things are going to explain about magic quadrant for
analytics and Business Intelligence using SWOT analysis.
Introduction
In recent times due to rise in use of new internet and computer technology in every sector of life,
increases the problems related to the security and privacy of data and information during their
transmission period. Today in modern times so many people are working on distribution, collection,
and execution of data as well as information in every business they do. Due to this at the same time,
we are facing so many problems in this information age. As we know that data and information is
responsible for the formation of intellectual property by which people craft their lives and secure
their privacy and dignity. Personal data and information related to legal problems are collected by
court and other legal authority. Change from paper to electronic or digital record needs a change in
the security methods and various security measures to prevent this type of threat. The social
problem caused due to this can be solved with full dignity in this information age. In this there are
so many different types of ethical issues are present. Gartner report always praises TIBICO and
Tableau tools. According to Gartner analysis and business intelligence, TIBCO and Tableau are
powerful and well rounded tools for big data analytics. Due to its end to end and deployment
abilities , TIBCO and Tableau manage the data center of IOT analytics.
Data Sources And Management
Nowadays the amount of data in the world has been increasing at an exponential rate and
experiencing the growth of 50% per year. Due to this Data-set become so large and complex which
leads to the emergence of new database management tools such as 1)Open Innovations 2)Open Data
3)Open Source(e.g Hadoop). There are also three main characteristics of big data i)volume(data
quantity)(ii)Velocity(Data Speed) (iii)Variety(Datatypes) (P. Church, 2013)
A big player from the web like Facebook, Google and Amazon handled their data based upon
customer interactions with their services. They develop many big data tools to collect, store and
analyze large quantities of data like Dynamo DB, Big Table, Cassandra, and Hadoop. Facebook is a
popular social network with 1.2 billion users worldwide. Apart from google, facebook is the only
company which stores a high level of detailed customer information. To increase the result of data
collections agencies and researchers has access to many more variables which are strictly needed to
answer their original hypothesis. So many times the collected data are not fully explored or used by
the original research team due to the limitation in time, interest or resources. (Rita Sallam,2018)
SWOT Analysis Of Tableau And TIBCO Platform
⊘ This is a preview!⊘
Do you want full access?
Subscribe today to unlock all pages.
Trusted by 1+ million students worldwide
There is a big number of tools and techniques to Analyse, Manipulate, Aggregate and manage Big
Data. The choice of tools and technology depend a lot on the nature of data which needs to be
stored and the kind of analysis they want. Apache Hadoop is the main force behind the growth of
the big data industry. it was inspired by Google's MapReduce and Google File System (GFS)
papers. MapReduce is a programming framework developed by Google which supports the
underlying Hadoop platform to execute the big data sets residing on distributed servers in order to
create the aggregated data. MapReduce actually has two different and distinct works that Hadoop
programs perform. The first map job it takes a set of data and converts it into another set of data.
The less job takes the output from a map as input and adds those data into a smaller set of data.
Tableau
It is a software tool which is mainly used to discover and connect with different data sources. Due
to its user-friendly nature anyone can easily store and share data as well as information of any
enterprise. It is good in connect with any sources by using drag and drop facilities. It mainly focuses
on visualizations. It provides basic data to the user so that they can analyze it in an easy manner and
also at the same time download as a worksheet. It offers data analysis at the front end. It is a better
option when data visualizations are the requirements of business analytics.(Joao Tapadinhas,2018)
TIBCO
It provides integration, analytics and event process for the company in office as well as on cloud
environment. It mainly focuses on data manipulation then visualizations later. Whereas TIBCO
offers data selection first and visualization later. It offers data analysis at the back-end. It is very
same to database code with SQL access, but it is made on top of Hadoop and MapReduce for giving
data summarization, query, and analysis operations with many key differences.
Simply, there is no comparison is feasible between Tableau and Tibco according to their features.
There are so many things which can affect the performance of connected cars like a failure of
hardware parts, problems of changing environment and updates of the software. By discussing the
basic requirements and problems of the current technology with the user, the engineer can easily
plan the quality infrastructure design of this software. Due to which they benefitted both technically
and financially to the industry. (Carlie Idoine,2018)
Paraphrase This Document
Need a fresh take? Get an instant paraphrase of this document with our AI Paraphraser
Threats & Solutions
Organizations like Facebook,Google and Amazon is a massive gold mine of data and advertisers
stick their eyes on like hungry vultures. It's lead to a high level of privacy concern among the
users.due to this these organizations assured their users that information is shared with others only
after their permissions. Companies which rely more on big data often face these mistakes:
Sometimes they use big data to answer meaningless questions. If you don't know how the answer of
any specific question leads to profit in business practices then asking the question is worthless.
Facebook relies too much on Hadoop technology. It uses a bundle of low-cost servers to solve the
problems. Hadoop is one of the big data many technologies which is alone not enough. Technology
such as Map Reduce and Impala enables to run queries without going or changing the structures of
the data. Apart from all these we see that Big Data is already a part of $65 billion databases and
play a major role in the data analytics market. (Alys Woodward,2018)
One of the main features of this tool is shielded virtual environment which provides encryption
support due to which it makes the virtual server more protected than the previous one. Including
automated disk encryption as well as capacities to replace all the nonshielded virtual servers into the
shielded virtual server this application is going to provide to the IT infrastructure.
Conclusion
These tools nowadays play a major in the success of BI and analytics. In this current economic
system, there is a need to develop the product according to the requirement of the user. Nowadays
the main goal of this tool is to understand the user perception about the quality of the product.
(Peter N. Golder, 2006). Nowadays in most of the business patron want to use the applications in a
different way so that they can easily do their work with more accuracy and security. As we see that
when any type of business rise and evolve, then they need to develop their already existing software
as well as need to upgrade their software tools. To implement this we should analyze the currently
existing tools and also the needs of a new tool which is important to the company. By doing this we
can easily find out what new equipment and other related things are required to sure that the new
tools of the company fully supports the current and future requirements of the end user. On the
product level, the quality of connected cars is measured by its reliability and durability. Perceived
quality is also termed as the quality impression which consists of robustness, finish, comfort and the
overall functionality of these tools. (D. Che, M. Safran,2016)
⊘ This is a preview!⊘
Do you want full access?
Subscribe today to unlock all pages.
Trusted by 1+ million students worldwide
Part B
Summary
The networks of computer are the backbone of any IT infrastructure in current times.It mainly used
to scale and manage scattered IT infrastructure, to generate error report in advance and management
of their performance across all IoT resources.In today world the main source of external data is
government, commercial services, official statistics, technical reports, scholarly journals, trade
journals, review articles, reference books, and international or national institutions. Government
statistics provide data and information through their population issues,social surveys, agricultural
statistics, production statistics and by import/export statistics. It helps the network administrator to
troubleshoot and find out the delay network, data loss, as well as network performance. It manages
and specifies the performance levels of the network.The tableau software tool is mainly used to
discover and connect with different data sources. Due to its user-friendly nature anyone can easily
store and share data as well as information of any enterprise. Whereas TIBCO provides integration,
analytics and event process for the company in office as well as on cloud environment. It mainly
focuses on data manipulation then visualizations later. (Z. Peng, 2016)
Virtualized infrastructure needs a very specific type of monitoring. Network performance
management maintains, analyze, and control the performance according to the user requirements.
Key factors which include in network performance management are Delays in the network, loss of
packet, the transmission of packet, throughput, and failure rate. It mainly uses a synthetic type of
transactions to measure reachability and work with any network irrespective of their types. In this
according to TCP and ICMP reports the user to have the options to choose between best according
to their requirements. In this, a dashboard is shown which have information about network
performance at various levels and also have an interactive map which shows the routes between
nodes. It covers from server admin to the end user and everything which connect all the IT
infrastructure for good and bad purpose at the same time. (James Richardson, 2018)
It also gives permission to analyze alternative solutions and according to that, design the new
competing data model. It is also very helpful in removing similar research data. Big data can be a
very important source of information for gaining knowledge and provides insight into a big range of
problems and other things. Analysis and review of big data give cost-effective ways of handling
problems, conducting cross analysis, fixing the direction and magnitude of change trends. It is also
very helpful in describing the current situation. It offers methodological benefits and can contribute
to generating new knowledge. Successful big data analysis mainly require a systematic process
which mainly recognizes the problem of utilizing existing data and explains the different
characteristics of secondary analysis. (Cindi Howson,2018)
It is also helpful in monitoring devices like routers, switches, and various other network processes
by using SNMP protocols. Just like network performance management requirements it also
monitors the performance levels of CPU, network traffic, packet loss, and network delay. It mainly
provides alerting and monitoring services for servers and other infrastructure services. It will alert
the user at the time of the incident as well as after the problem solved. It also helps in monitoring of
host resources like loading of processor, disk usage, and remote monitoring. It also provides a web
interface to view the status of the current network, problem history, and error notification. It is
highly distributed scalable monitoring tool for network and high performance IT infrastructure. The
increasing growth of cybersecurity threats and attacks nowadays demands a new critical
infrastructure which has control and command system. To reduce the impact of above threats
organizations must have to explain and adopt a strong security policy without any interruption by a
strong commitment to high management and the policy must include corporate database security.
Paraphrase This Document
Need a fresh take? Get an instant paraphrase of this document with our AI Paraphraser
References
D. Che, M. Safran, and Z. Peng, (2016)“From Big Data to Big Data Mining: challenges, issues, and
opportunities,” in Database Systems for Advanced Applications, pp. 1–15
M. Chen, S. Mao, and Y. Liu,(2014) “Big data: a survey,” Mobile Networks and Applications, vol.
19, no. 2, pp. 171–209.
S. Kaisler, F. Armour, J. A. Espinosa, and W. Money, (2013) “Big data: issues and challenges
moving forward,” in Proceedings of the IEEE 46th Annual Hawaii International Conference on
System Sciences (HICSS '13), pp. 995–1004
R. Cumbley and P. Church, (2013) “Is “Big Data” creepy?” Computer Law and Security Review,
vol. 29, no. 5, pp. 601–609
1 out of 8
Related Documents


Your All-in-One AI-Powered Toolkit for Academic Success.
+13062052269
info@desklib.com
Available 24*7 on WhatsApp / Email
![[object Object]](/_next/static/media/star-bottom.7253800d.svg)
Unlock your academic potential
Copyright © 2020–2026 A2Z Services. All Rights Reserved. Developed and managed by ZUCOL.