Impact of Employee Benefit Expenses on Mahindra & Mahindra Revenue
VerifiedAdded on 2022/12/19
|20
|4703
|1
Report
AI Summary
This report examines the impact of employee benefit expenses on the financial performance of Mahindra & Mahindra. The study utilizes secondary data, primarily from the company's annual reports over an eleven-year period, to assess the correlation between employee benefit expenses and revenue generation. The research employs SPSS for data analysis, focusing on regression analysis and correlation to determine the relationship between the two variables. The findings indicate a positive relationship, suggesting that increased investment in employee benefits correlates with higher revenue. The report explores the justification for this relationship, reviews relevant literature on employee benefits and revenue, and discusses the implications for employee motivation, job satisfaction, and retention. The methodology includes a deductive research approach with an exploratory design, using secondary data analysis. The conclusion and recommendations address the importance of employee benefits for financial success, with limitations acknowledged regarding data sources and research tools.
Impact of Employee Benefit Expenses on the
Financial Performance of Business
A Study on Mahindra & Mahindra
Financial Performance of Business
A Study on Mahindra & Mahindra
Paraphrase This Document
Need a fresh take? Get an instant paraphrase of this document with our AI Paraphraser
EXECUTIVE SUMMARY
The job satisfaction among employees has become greater concern for firms to attain
desired performance. In present research report, relationship among employee benefit expenses
and revenue of Mahindra & Mahindra has been analysed. The results are derived from SPSS
tool. It shows that as spending of firm increases in employee benefits, revenue increases at a
greater pace as well. This implies that strong correlation is found among both variables.
TABLE OF CONTENTS
INTRODUCTION...........................................................................................................................1
Problem Statement.......................................................................................................................1
Justification..................................................................................................................................1
Research Aim and Objectives......................................................................................................1
Research Questions......................................................................................................................2
Research Hypothesis....................................................................................................................2
CRITICAL LITERATURE REVIEW.............................................................................................2
Overview of the Employee Benefit Expenses.............................................................................2
Interrelationship between revenue generation and employee benefit expenses..........................3
Impact on the motivation and employees engagement................................................................4
RESEARCH METHODOLOGY....................................................................................................4
Research Type.............................................................................................................................4
Research Approach......................................................................................................................5
Research Design..........................................................................................................................5
Data collection.............................................................................................................................5
Data Analysis...............................................................................................................................6
Research Limitations...................................................................................................................6
FINDINGS AND DATA ANALYSIS............................................................................................6
Discussion....................................................................................................................................9
CONCLUSION AND RECOMMENDATIONS............................................................................9
Conclusion...................................................................................................................................9
Recommendations......................................................................................................................10
REFERENCES..............................................................................................................................11
APPENDIX....................................................................................................................................13
⊘ This is a preview!⊘
Do you want full access?
Subscribe today to unlock all pages.
Trusted by 1+ million students worldwide
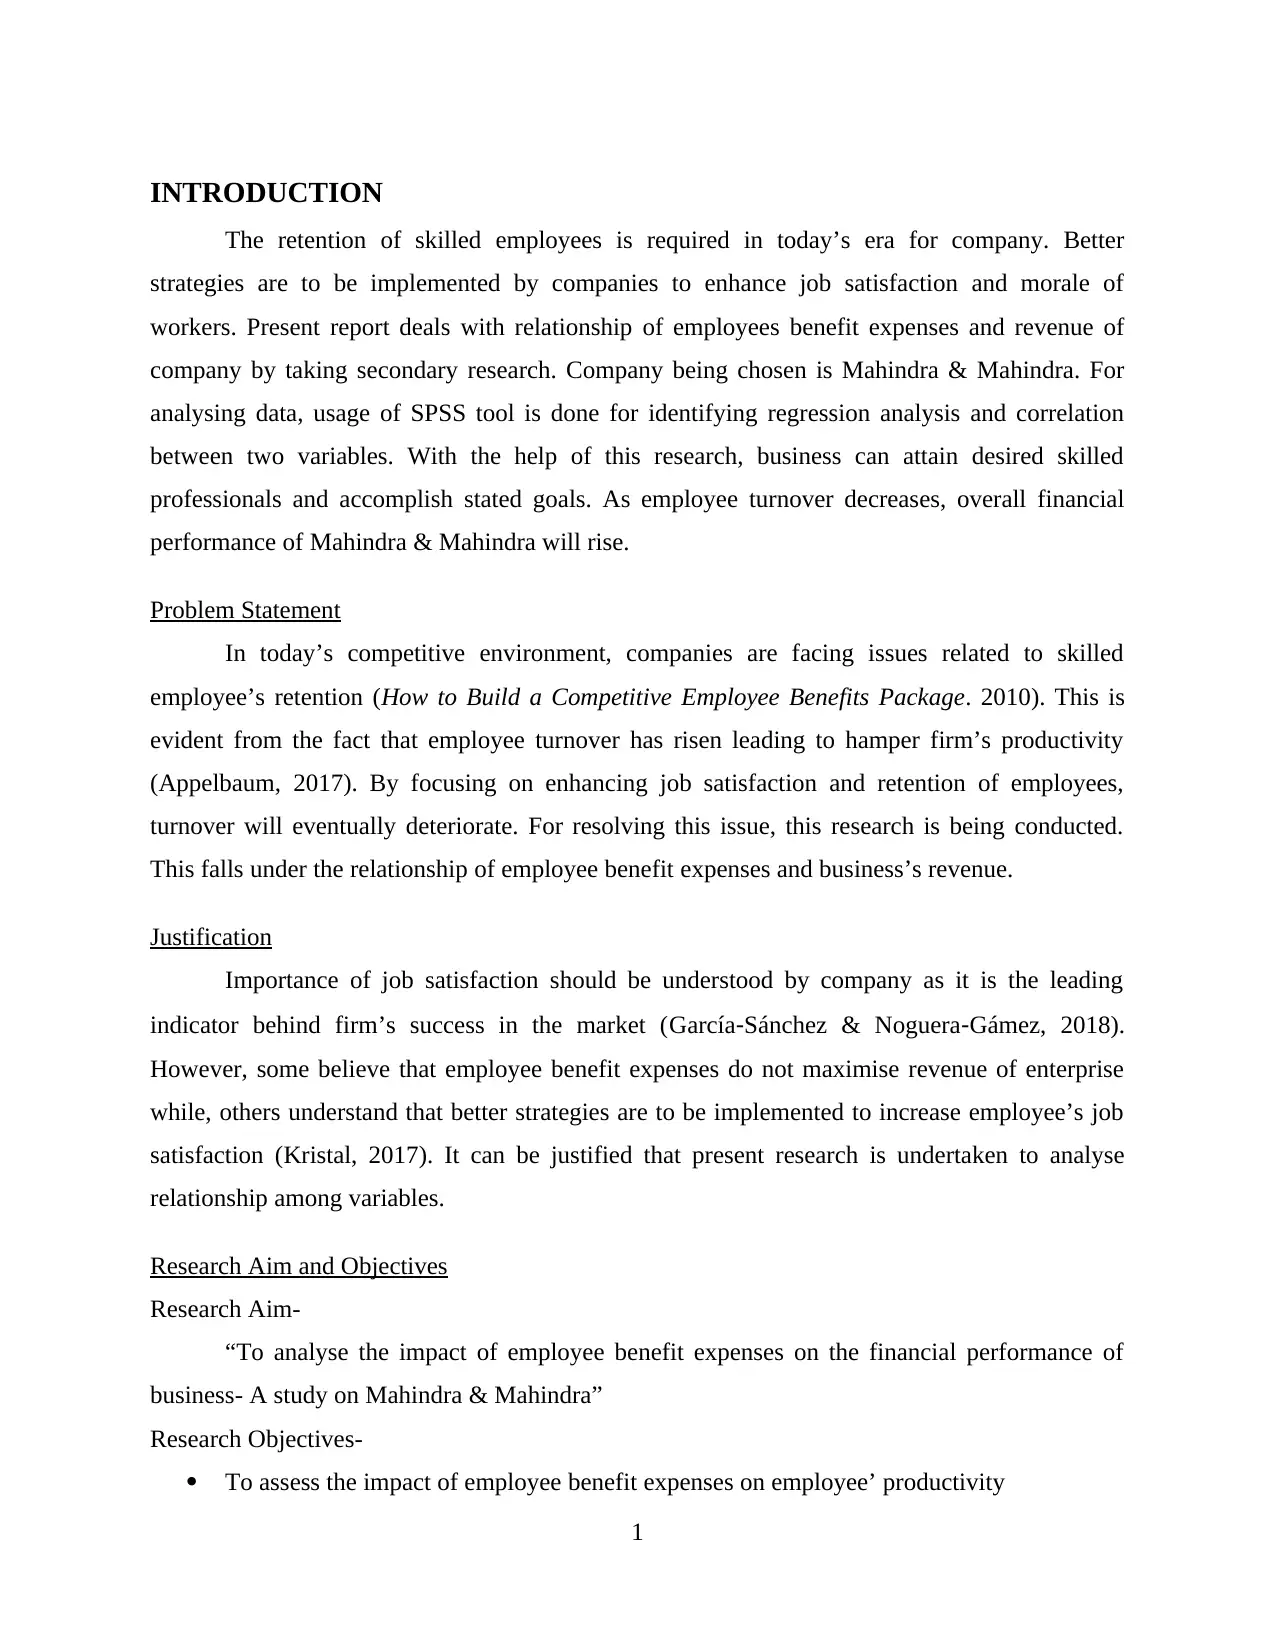
INTRODUCTION
The retention of skilled employees is required in today’s era for company. Better
strategies are to be implemented by companies to enhance job satisfaction and morale of
workers. Present report deals with relationship of employees benefit expenses and revenue of
company by taking secondary research. Company being chosen is Mahindra & Mahindra. For
analysing data, usage of SPSS tool is done for identifying regression analysis and correlation
between two variables. With the help of this research, business can attain desired skilled
professionals and accomplish stated goals. As employee turnover decreases, overall financial
performance of Mahindra & Mahindra will rise.
Problem Statement
In today’s competitive environment, companies are facing issues related to skilled
employee’s retention (How to Build a Competitive Employee Benefits Package. 2010). This is
evident from the fact that employee turnover has risen leading to hamper firm’s productivity
(Appelbaum, 2017). By focusing on enhancing job satisfaction and retention of employees,
turnover will eventually deteriorate. For resolving this issue, this research is being conducted.
This falls under the relationship of employee benefit expenses and business’s revenue.
Justification
Importance of job satisfaction should be understood by company as it is the leading
indicator behind firm’s success in the market (García‐Sánchez & Noguera‐Gámez, 2018).
However, some believe that employee benefit expenses do not maximise revenue of enterprise
while, others understand that better strategies are to be implemented to increase employee’s job
satisfaction (Kristal, 2017). It can be justified that present research is undertaken to analyse
relationship among variables.
Research Aim and Objectives
Research Aim-
“To analyse the impact of employee benefit expenses on the financial performance of
business- A study on Mahindra & Mahindra”
Research Objectives-
To assess the impact of employee benefit expenses on employee’ productivity
1
Paraphrase This Document
Need a fresh take? Get an instant paraphrase of this document with our AI Paraphraser
To ascertain how job satisfaction of workers is impacted by employee benefit expenses
To evaluate how firm’s revenue is increased by incurring employee benefit expenses
Research Questions
Q1. What is the relationship between employee benefit expenses and revenue of Mahindra &
Mahindra?
Q2. How job satisfaction is impacted by employee benefit expenses?
Research Hypothesis
The hypothesis being formulated for current research is highlighted below-
H0 (Null hypothesis)- There is negative relationship between employee benefit expenses and
business’s revenue
H1 (Alternative hypothesis) There is positive relationship between employee benefit expenses
and business’s revenue
Based on the above hypothesis, research has been conducted to find out which of the
hypothesis is selected and whether revenue is increased by incurring employee benefit expenses
or not.
CRITICAL LITERATURE REVIEW
This section focuses on the ongoing research works and other theoretical contributions in
context to a subject. Primarily it is based on the analysis part of secondary sources which are
related to findings of the methodical knowledge or the analytical survey of existing data. Herein
the subject is regards to the impact of the employee benefit expenses on the revenue generation
of Mahindra Company.
Overview of the Employee Benefit Expenses
According to Jackson, Looney & Ramnath (2017), it is clearly understandable that
benefit expenses is one of the lucrative points to attract any experienced or skilled employee.
Companies understand that the employees are the assets who must be valued and given benefits
for their growth and development. This is also important to meet with the expectations and needs
of the employees’ while taking up their services to complete the assigned tasks. Moreover,
Thompson, Gilbert & Hernandez (2012) emphasized that it acts as a protective shield to the
workers based on income protection deliverables such as medical insurance, retirement schemes,
2
involuntary unemployment income replacement, disability income replacement etc. These help
in outlining the flexibility and reliability factors between the administrations and the employees.
For instance, advance leave helps the employees to accommodate the personal emergencies that
further assist in maintaining the relations in positive way.
Alongside, Osibanjo, Adeniji, Falola & Heirsmac (2014) stated that the focus is on giving
a high level of living standards and bring a work-life balance of the taskforce. It also includes
incentives and rewards that lay the path of fulfilling the preferences, needs and requirements of
the employees. Moreover, it also improves the productivity levels and maintains the
communication channels as well. There is an unseen trust and loyalty that gets build up in the
employees’ attitude towards achieving the organizational goals and objectives. It not only
improves the potentiality in terms of economic benefits to both the employer and employees but
also emphasis on increasing the overall reputation and credibility among the competitors at both
local and global markets.
Interrelationship between revenue generation and employee benefit expenses
Novy-Marx & Rauh (2014) highlighted the focus on the recent developmental works in
the revenue generation due to the high number of employees’ benefits expenses. It is seen that
there is a positive correlation between these benefit schemes and the overall profitability of the
company. There is a direct proportionality between the amount of the pressure on the employees
to perform and reach the target on time and the estimated revenues. However, Horváthová (2012)
elucidated if the employees are given a flexible environment to work in, the results have
exceeded the estimated value whereas in the opposite environment of high-pressure levels has
resulted in terminations, resignations and a dip in the overall revenue management.
Furthermore, Adhvaryu, Chari & Sharma (2013) added that the government interventions
have played a pivotal role in making the companies especially from the private sector to be more
encouraging and understanding towards the employees’ needs. Here the government has raised
the upper limit from current 10 percent to 15 percent in the apprenticeship in order to provide
cohesive surroundings for growth and development. Regarding this, there is also an upsurge of
minimal charges on the corporate tax to relax the pressure belts and helping the job markets to
come out of the depressing zones. Therefore, the relationship is clear that positive employees’
relations through the adoption of several benefits and schemes would fetch the organization to
reach the desired economic gains of the prevailing competition.
3
⊘ This is a preview!⊘
Do you want full access?
Subscribe today to unlock all pages.
Trusted by 1+ million students worldwide
Impact on the motivation and employee’s engagement
Butts, Casper & Yang (2013) has shed light on the number of pros of giving a large pool
of schemes or benefits to the employees. The engagement levels with the motivating factor is
always on the positive side of the scale that aids in making the employees feel valuable and an
important part of the company. Additionally, the transparency and communication also get
fostered that makes the performance management more compact and effective in reaching the
optimum levels of revenues and financial gains. Their overall efforts are also in increasing
direction that helps in analysing their dedication and sincerity in attaining the expected
outcomes. With additional bonuses, incentives and rewards systems has not only promoted a
healthy competitive environment for the employees to up skill and outshine themselves but also
given a platform to maintain the desired levels. In addition to this, Kwon & Hein (2013) stated
that the employees’ benefit expenses have built a security for a better future for the people
working including their families. The medical insurance plans, retirement scheme, parental care
plans etc. have minimised the pressures on the employees and gave an assurance to overcome
any unforeseen challenge or situational crisis. Therefore, this is the catalyst that makes the
employees work with complete dedication.
RESEARCH METHODOLOGY
Research Type
The research type consists of quantitative and qualitative. As the name suggests,
qualitative data is used for determining theoretical aspect of study in hand (Bresler & Stake,
2017). However, quantitative type of research helps to ascertain numerical data, facts and figures
in effectual manner. In addition to this, present research is based on relationship between
employee benefit expenses and revenue of Mahindra & Mahindra. In order to perform this
research, quantitative research has been used by taking facts and figures on last eleven years
data. This means that relationship is of quantitative in nature and adequate results can be
obtained from it.
4
Paraphrase This Document
Need a fresh take? Get an instant paraphrase of this document with our AI Paraphraser
Research Approach
The research approaches that are used by scholars are namely inductive and deductive
research approaches. The deductive goes through stage of theory, then hypothesis is made
(Kumar, 2019). Thereafter, observation or testing of hypothesis is done in order to accept or
reject the same. While, inductive approach is particularly used for forming general theory. In
current report, use of deductive approach has been used in order to attain desirable results from
the formulated hypothesis. Thus, whether employee benefit expenses and revenue possess
relationship or not can be determined with the help of this research approach with ease.
Research Design
The research design is used for providing overall schema of the research study. It
provides proper direction to researcher in the best manner possible. It consists mainly of two
types such as descriptive design and exploratory design (Ledford & Gast, 2018). It can be
analysed that descriptive is used to describe in detail regarding the issue. However, exploratory is
used for exploring issue being identified up to a major extent and as a result; scholar can attain
outcomes. In present report, exploratory design has been used for gathering results in effective
manner. This will help in getting outcome as to what relationship prevails between revenue of
Mahindra & Mahindra and employee benefit expenses.
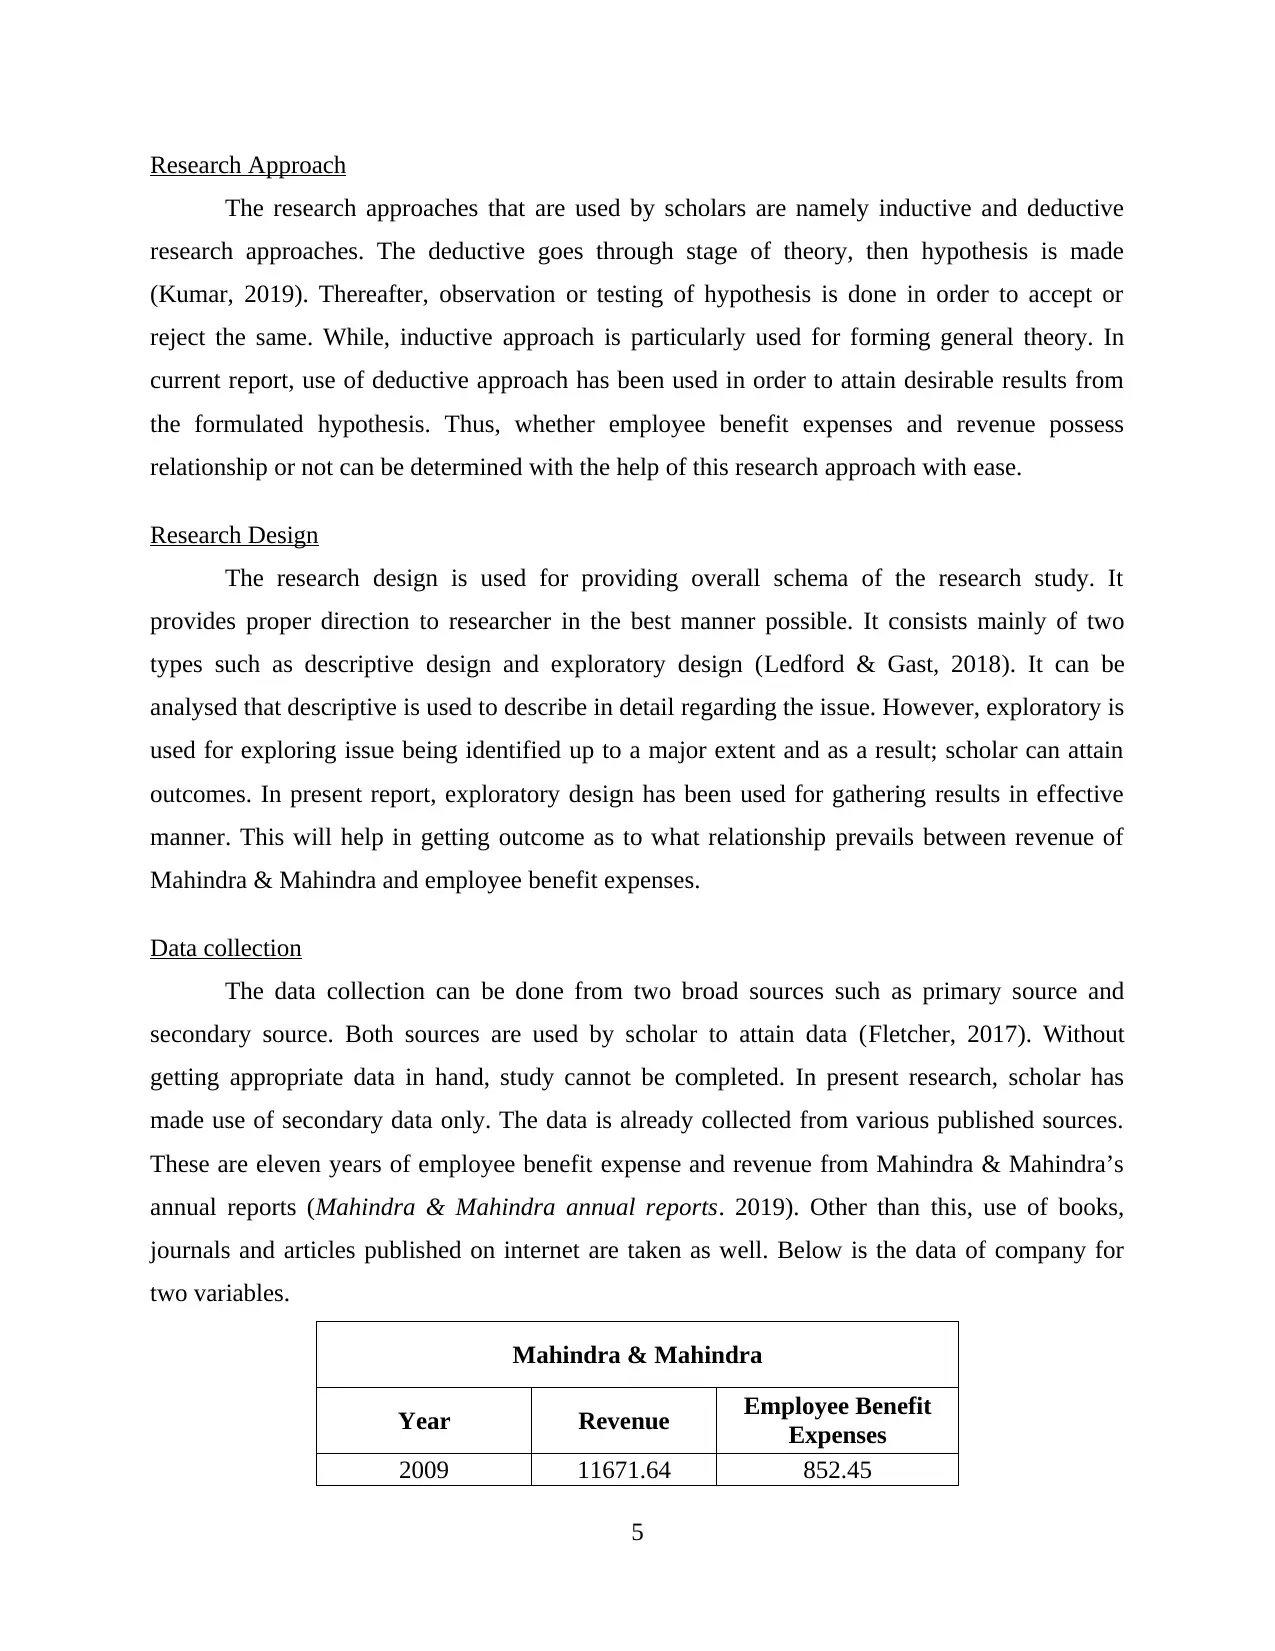
Data collection
The data collection can be done from two broad sources such as primary source and
secondary source. Both sources are used by scholar to attain data (Fletcher, 2017). Without
getting appropriate data in hand, study cannot be completed. In present research, scholar has
made use of secondary data only. The data is already collected from various published sources.
These are eleven years of employee benefit expense and revenue from Mahindra & Mahindra’s
annual reports (Mahindra & Mahindra annual reports. 2019). Other than this, use of books,
journals and articles published on internet are taken as well. Below is the data of company for
two variables.
Mahindra & Mahindra
Year Revenue Employee Benefit
Expenses
2009 11671.64 852.45
5
The research approaches that are used by scholars are namely inductive and deductive
research approaches. The deductive goes through stage of theory, then hypothesis is made
(Kumar, 2019). Thereafter, observation or testing of hypothesis is done in order to accept or
reject the same. While, inductive approach is particularly used for forming general theory. In
current report, use of deductive approach has been used in order to attain desirable results from
the formulated hypothesis. Thus, whether employee benefit expenses and revenue possess
relationship or not can be determined with the help of this research approach with ease.
Research Design
The research design is used for providing overall schema of the research study. It
provides proper direction to researcher in the best manner possible. It consists mainly of two
types such as descriptive design and exploratory design (Ledford & Gast, 2018). It can be
analysed that descriptive is used to describe in detail regarding the issue. However, exploratory is
used for exploring issue being identified up to a major extent and as a result; scholar can attain
outcomes. In present report, exploratory design has been used for gathering results in effective
manner. This will help in getting outcome as to what relationship prevails between revenue of
Mahindra & Mahindra and employee benefit expenses.
Data collection
The data collection can be done from two broad sources such as primary source and
secondary source. Both sources are used by scholar to attain data (Fletcher, 2017). Without
getting appropriate data in hand, study cannot be completed. In present research, scholar has
made use of secondary data only. The data is already collected from various published sources.
These are eleven years of employee benefit expense and revenue from Mahindra & Mahindra’s
annual reports (Mahindra & Mahindra annual reports. 2019). Other than this, use of books,
journals and articles published on internet are taken as well. Below is the data of company for
two variables.
Mahindra & Mahindra
Year Revenue Employee Benefit
Expenses
2009 11671.64 852.45
5
2010 18801.46 1198.47
2011 23894.41 1431.52
2012 32319.31 1701.78
2013 40990.33 1866.45
2014 74506.02 2163.72
2015 39293.77 2317.00
2016 41739.83 2342.00
2017 47093.04 2595.00
2018 49444.99 2840.39
2019 53614.00 2980.22
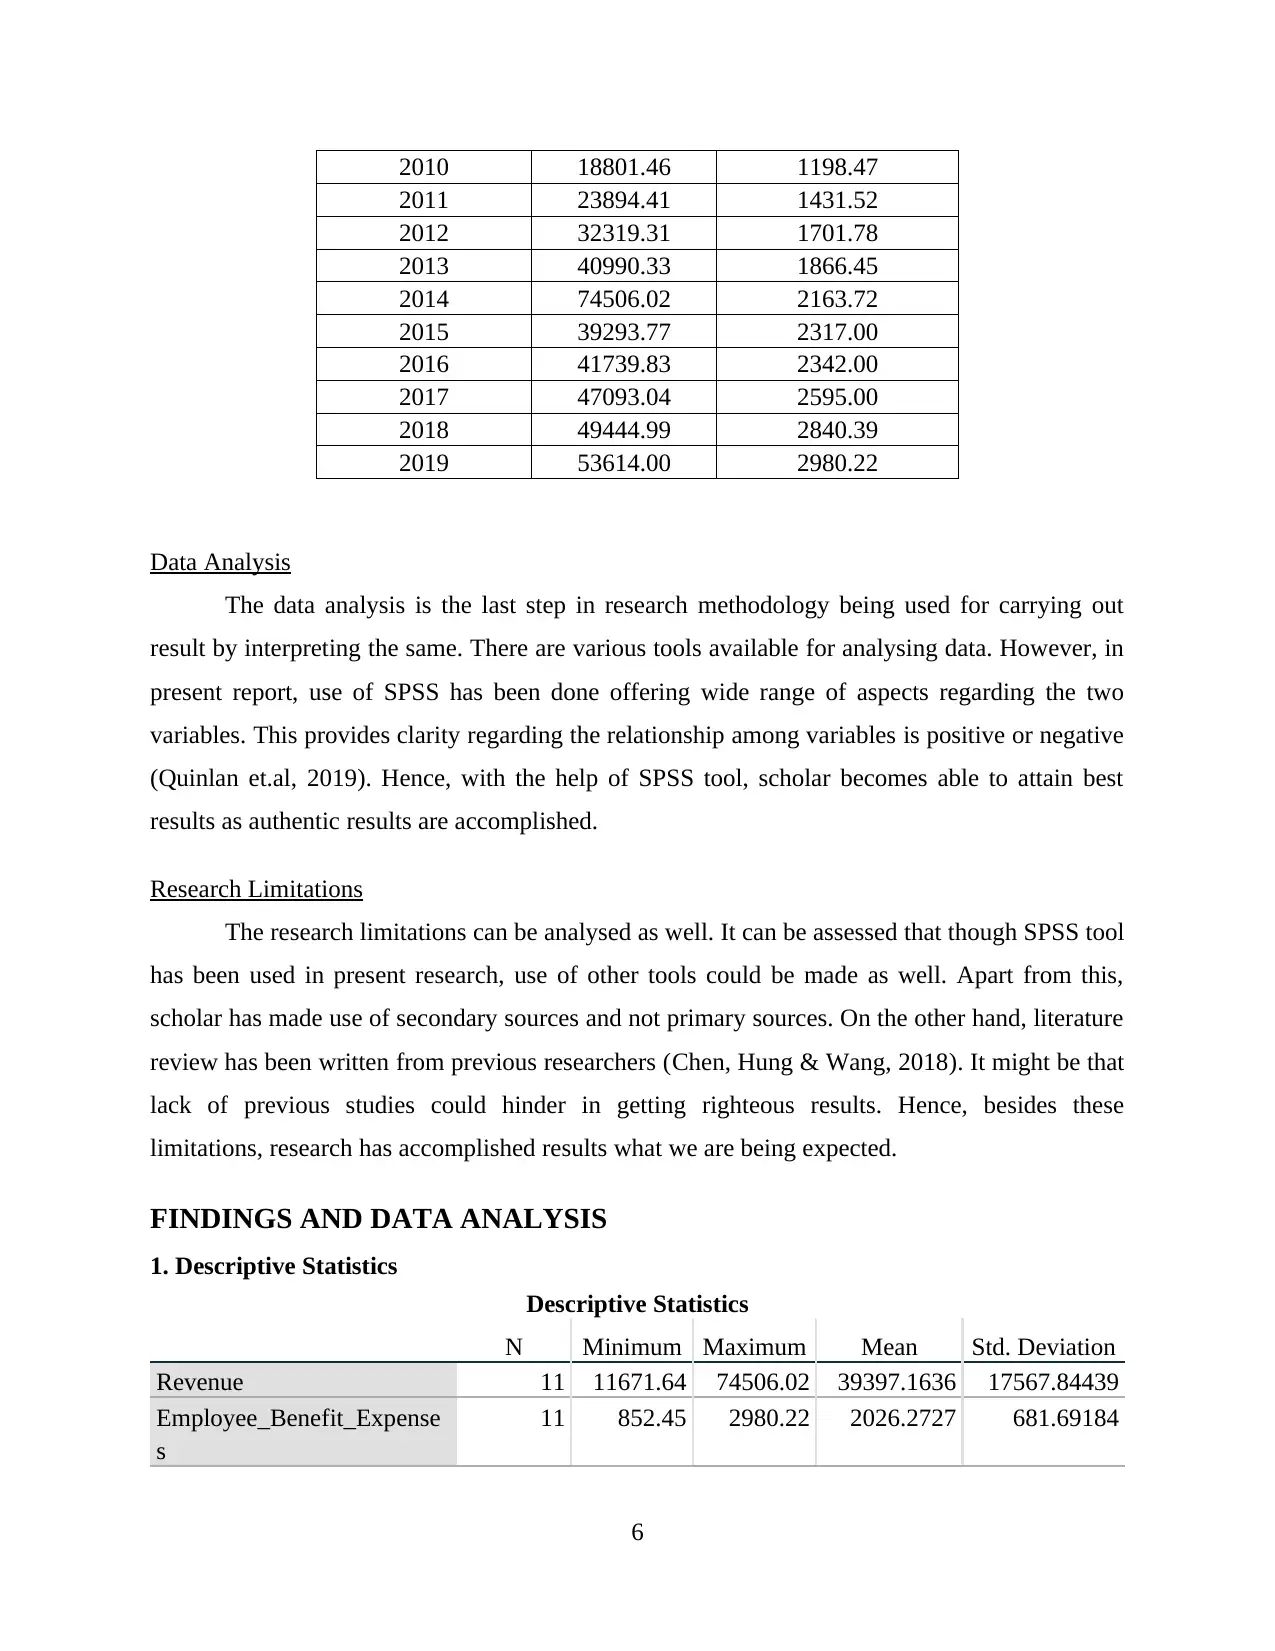
Data Analysis
The data analysis is the last step in research methodology being used for carrying out
result by interpreting the same. There are various tools available for analysing data. However, in
present report, use of SPSS has been done offering wide range of aspects regarding the two
variables. This provides clarity regarding the relationship among variables is positive or negative
(Quinlan et.al, 2019). Hence, with the help of SPSS tool, scholar becomes able to attain best
results as authentic results are accomplished.
Research Limitations
The research limitations can be analysed as well. It can be assessed that though SPSS tool
has been used in present research, use of other tools could be made as well. Apart from this,
scholar has made use of secondary sources and not primary sources. On the other hand, literature
review has been written from previous researchers (Chen, Hung & Wang, 2018). It might be that
lack of previous studies could hinder in getting righteous results. Hence, besides these
limitations, research has accomplished results what we are being expected.
FINDINGS AND DATA ANALYSIS
1. Descriptive Statistics
Descriptive Statistics
N Minimum Maximum Mean Std. Deviation
Revenue 11 11671.64 74506.02 39397.1636 17567.84439
Employee_Benefit_Expense
s
11 852.45 2980.22 2026.2727 681.69184
6
2011 23894.41 1431.52
2012 32319.31 1701.78
2013 40990.33 1866.45
2014 74506.02 2163.72
2015 39293.77 2317.00
2016 41739.83 2342.00
2017 47093.04 2595.00
2018 49444.99 2840.39
2019 53614.00 2980.22
Data Analysis
The data analysis is the last step in research methodology being used for carrying out
result by interpreting the same. There are various tools available for analysing data. However, in
present report, use of SPSS has been done offering wide range of aspects regarding the two
variables. This provides clarity regarding the relationship among variables is positive or negative
(Quinlan et.al, 2019). Hence, with the help of SPSS tool, scholar becomes able to attain best
results as authentic results are accomplished.
Research Limitations
The research limitations can be analysed as well. It can be assessed that though SPSS tool
has been used in present research, use of other tools could be made as well. Apart from this,
scholar has made use of secondary sources and not primary sources. On the other hand, literature
review has been written from previous researchers (Chen, Hung & Wang, 2018). It might be that
lack of previous studies could hinder in getting righteous results. Hence, besides these
limitations, research has accomplished results what we are being expected.
FINDINGS AND DATA ANALYSIS
1. Descriptive Statistics
Descriptive Statistics
N Minimum Maximum Mean Std. Deviation
Revenue 11 11671.64 74506.02 39397.1636 17567.84439
Employee_Benefit_Expense
s
11 852.45 2980.22 2026.2727 681.69184
6
⊘ This is a preview!⊘
Do you want full access?
Subscribe today to unlock all pages.
Trusted by 1+ million students worldwide
Valid N (listwise) 11
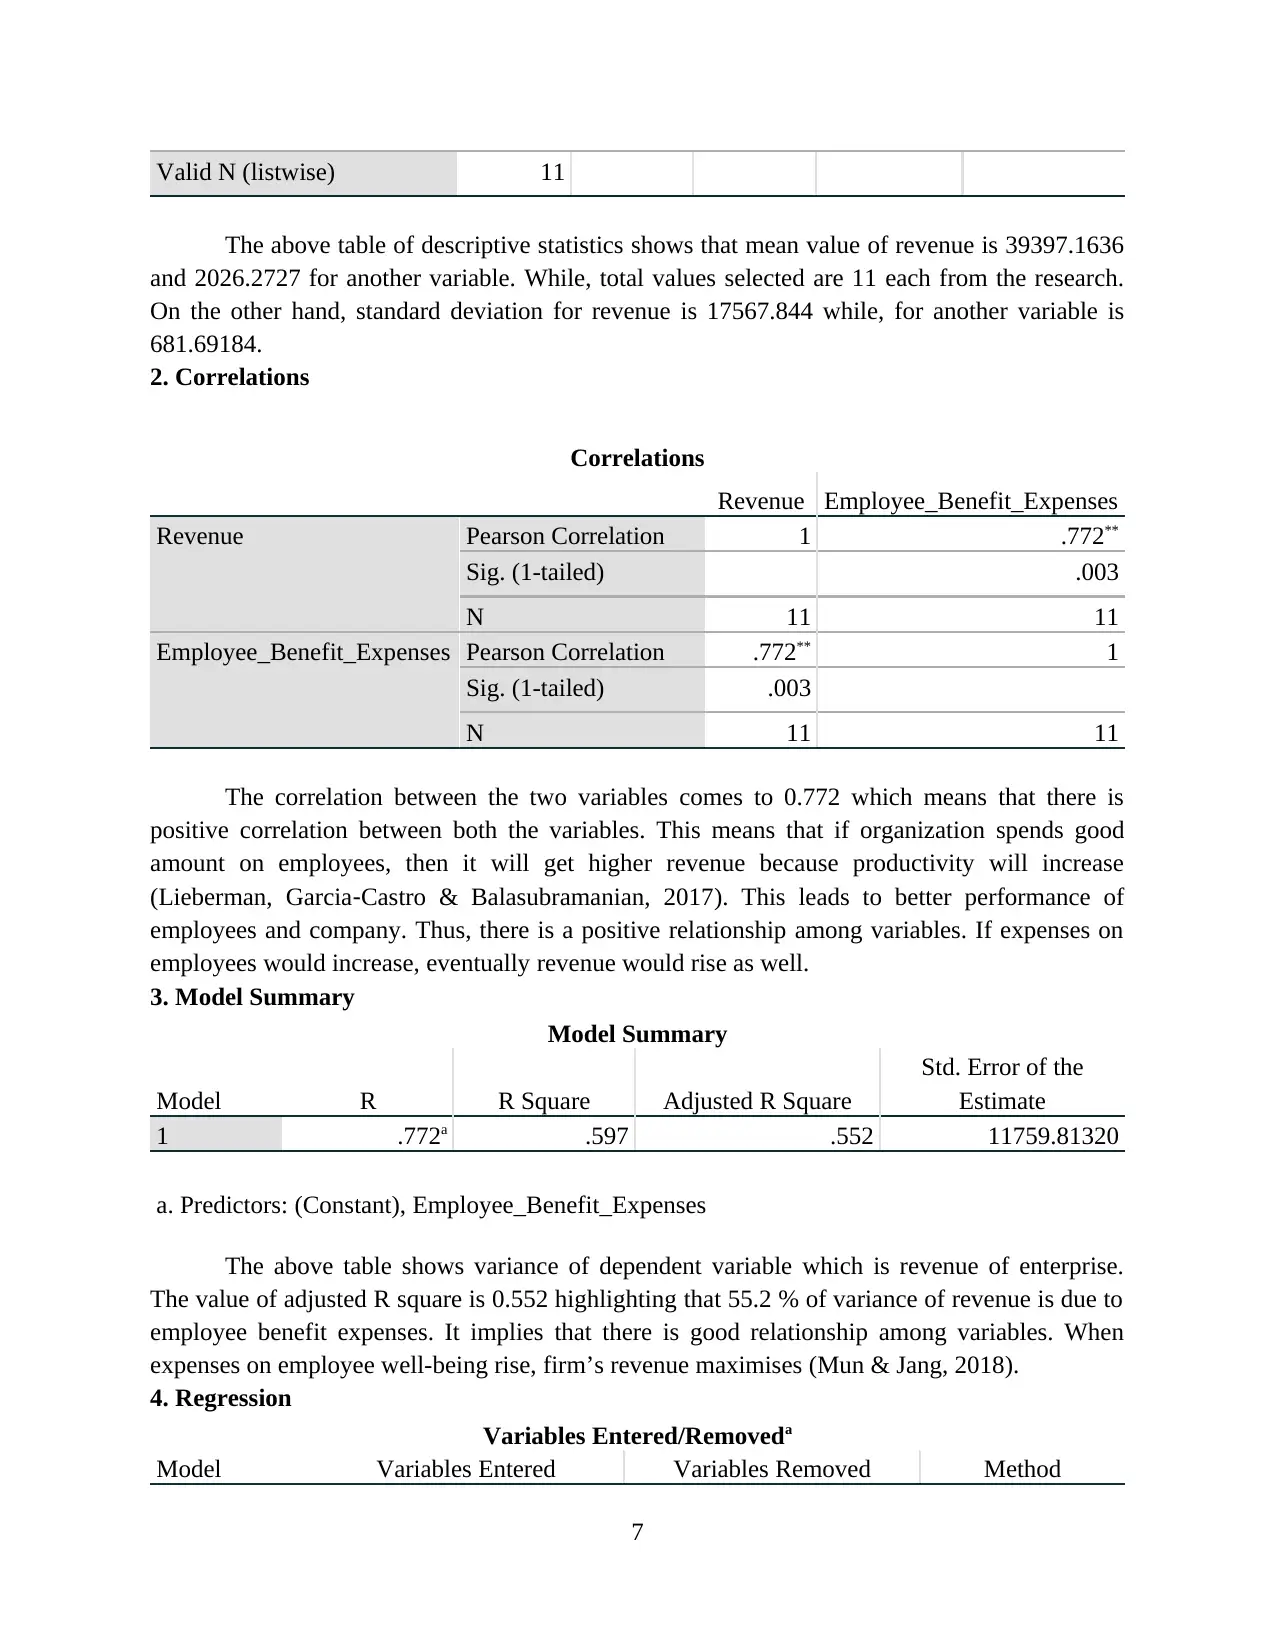
The above table of descriptive statistics shows that mean value of revenue is 39397.1636
and 2026.2727 for another variable. While, total values selected are 11 each from the research.
On the other hand, standard deviation for revenue is 17567.844 while, for another variable is
681.69184.
2. Correlations
Correlations
Revenue Employee_Benefit_Expenses
Revenue Pearson Correlation 1 .772**
Sig. (1-tailed) .003
N 11 11
Employee_Benefit_Expenses Pearson Correlation .772** 1
Sig. (1-tailed) .003
N 11 11
The correlation between the two variables comes to 0.772 which means that there is
positive correlation between both the variables. This means that if organization spends good
amount on employees, then it will get higher revenue because productivity will increase
(Lieberman, Garcia‐Castro & Balasubramanian, 2017). This leads to better performance of
employees and company. Thus, there is a positive relationship among variables. If expenses on
employees would increase, eventually revenue would rise as well.
3. Model Summary
Model Summary
Model R R Square Adjusted R Square
Std. Error of the
Estimate
1 .772a .597 .552 11759.81320
a. Predictors: (Constant), Employee_Benefit_Expenses
The above table shows variance of dependent variable which is revenue of enterprise.
The value of adjusted R square is 0.552 highlighting that 55.2 % of variance of revenue is due to
employee benefit expenses. It implies that there is good relationship among variables. When
expenses on employee well-being rise, firm’s revenue maximises (Mun & Jang, 2018).
4. Regression
Variables Entered/Removeda
Model Variables Entered Variables Removed Method
7
Paraphrase This Document
Need a fresh take? Get an instant paraphrase of this document with our AI Paraphraser
1 Employee_Benefit_Expensesb . Enter
a. Dependent Variable: Revenue
b. All requested variables entered.
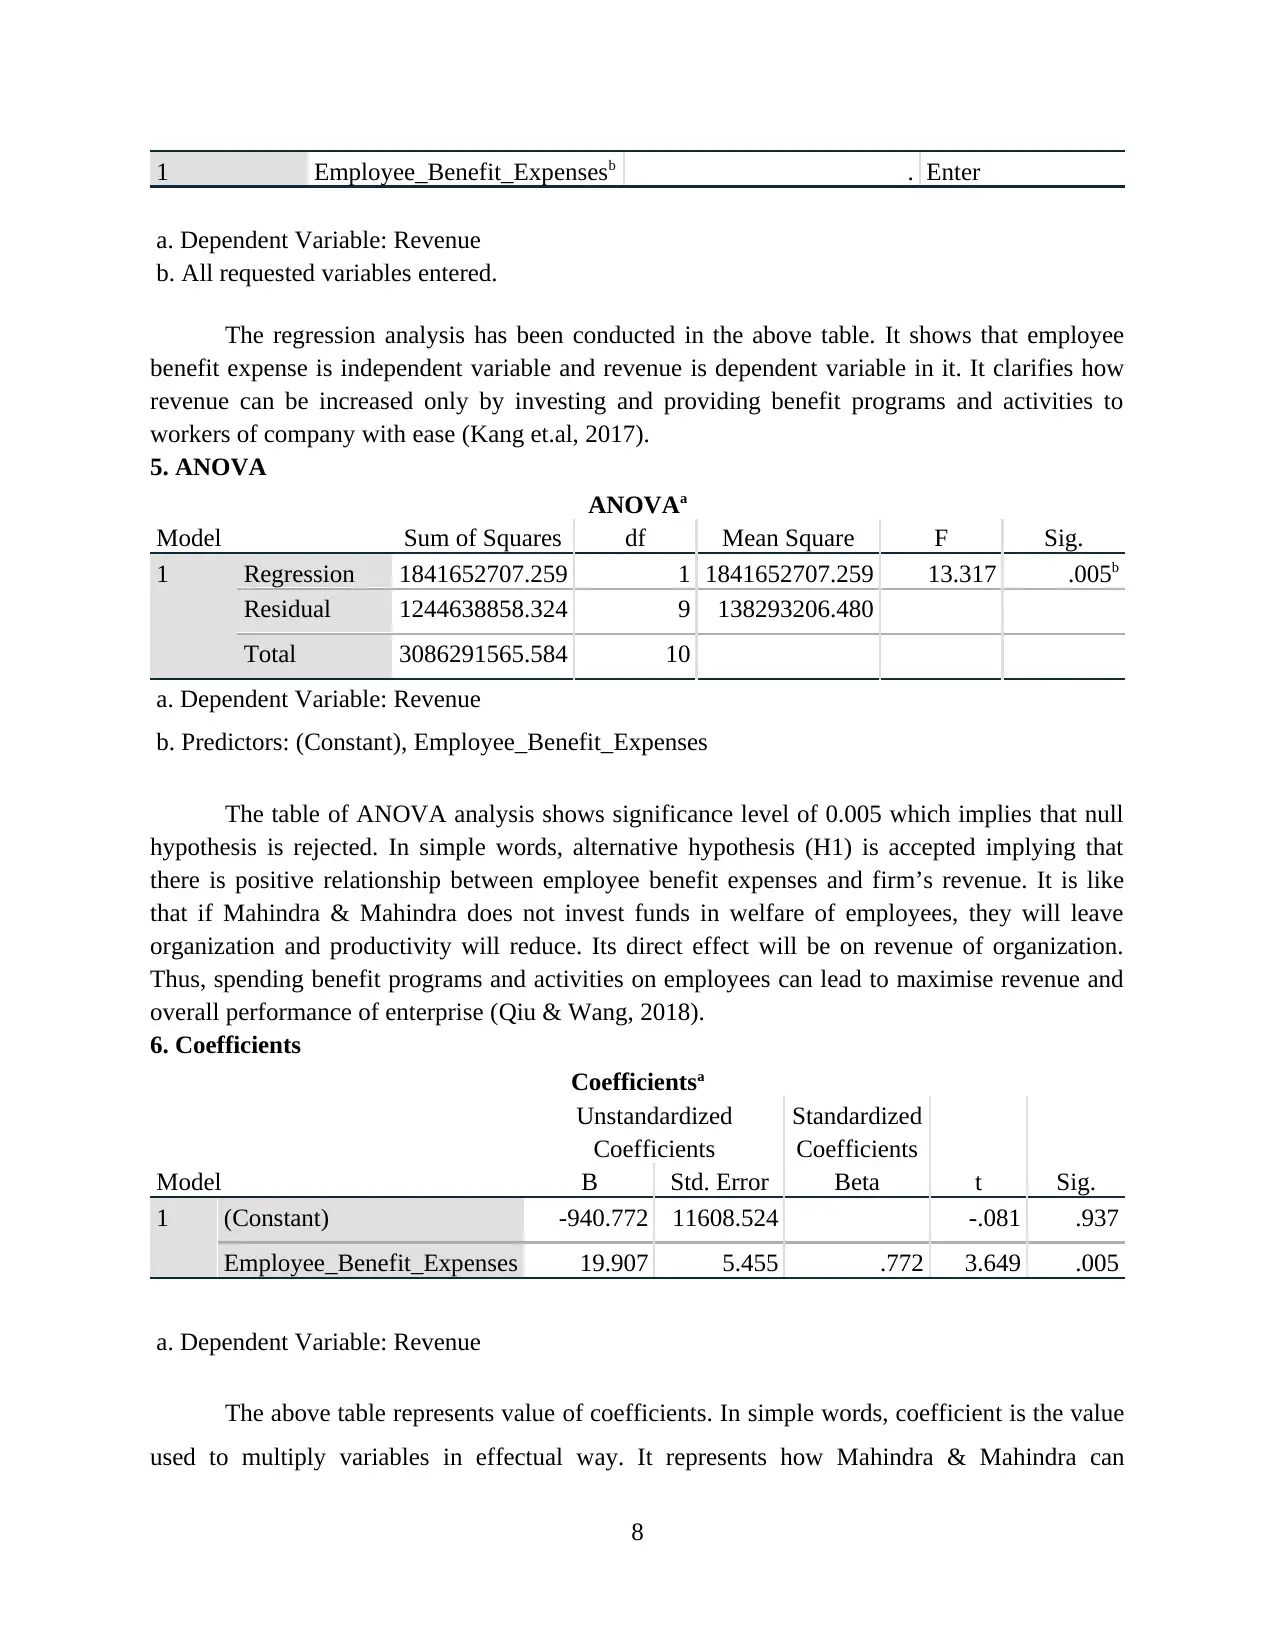
The regression analysis has been conducted in the above table. It shows that employee
benefit expense is independent variable and revenue is dependent variable in it. It clarifies how
revenue can be increased only by investing and providing benefit programs and activities to
workers of company with ease (Kang et.al, 2017).
5. ANOVA
ANOVAa
Model Sum of Squares df Mean Square F Sig.
1 Regression 1841652707.259 1 1841652707.259 13.317 .005b
Residual 1244638858.324 9 138293206.480
Total 3086291565.584 10
a. Dependent Variable: Revenue
b. Predictors: (Constant), Employee_Benefit_Expenses
The table of ANOVA analysis shows significance level of 0.005 which implies that null
hypothesis is rejected. In simple words, alternative hypothesis (H1) is accepted implying that
there is positive relationship between employee benefit expenses and firm’s revenue. It is like
that if Mahindra & Mahindra does not invest funds in welfare of employees, they will leave
organization and productivity will reduce. Its direct effect will be on revenue of organization.
Thus, spending benefit programs and activities on employees can lead to maximise revenue and
overall performance of enterprise (Qiu & Wang, 2018).
6. Coefficients
Coefficientsa
Model
Unstandardized
Coefficients
Standardized
Coefficients
t Sig.B Std. Error Beta
1 (Constant) -940.772 11608.524 -.081 .937
Employee_Benefit_Expenses 19.907 5.455 .772 3.649 .005
a. Dependent Variable: Revenue
The above table represents value of coefficients. In simple words, coefficient is the value
used to multiply variables in effectual way. It represents how Mahindra & Mahindra can
8
a. Dependent Variable: Revenue
b. All requested variables entered.
The regression analysis has been conducted in the above table. It shows that employee
benefit expense is independent variable and revenue is dependent variable in it. It clarifies how
revenue can be increased only by investing and providing benefit programs and activities to
workers of company with ease (Kang et.al, 2017).
5. ANOVA
ANOVAa
Model Sum of Squares df Mean Square F Sig.
1 Regression 1841652707.259 1 1841652707.259 13.317 .005b
Residual 1244638858.324 9 138293206.480
Total 3086291565.584 10
a. Dependent Variable: Revenue
b. Predictors: (Constant), Employee_Benefit_Expenses
The table of ANOVA analysis shows significance level of 0.005 which implies that null
hypothesis is rejected. In simple words, alternative hypothesis (H1) is accepted implying that
there is positive relationship between employee benefit expenses and firm’s revenue. It is like
that if Mahindra & Mahindra does not invest funds in welfare of employees, they will leave
organization and productivity will reduce. Its direct effect will be on revenue of organization.
Thus, spending benefit programs and activities on employees can lead to maximise revenue and
overall performance of enterprise (Qiu & Wang, 2018).
6. Coefficients
Coefficientsa
Model
Unstandardized
Coefficients
Standardized
Coefficients
t Sig.B Std. Error Beta
1 (Constant) -940.772 11608.524 -.081 .937
Employee_Benefit_Expenses 19.907 5.455 .772 3.649 .005
a. Dependent Variable: Revenue
The above table represents value of coefficients. In simple words, coefficient is the value
used to multiply variables in effectual way. It represents how Mahindra & Mahindra can
8
accomplish higher gains in terms of good financial performance by investing on employees’
welfare. The value of significance level for independent variable is 0.005 which means that
dependent variable revenue cannot increase when employee benefit expenses are not maximised.
Hence, value of coefficient also interprets that there is strong relationship among variables. Thus,
firm must invest in employees for reaping higher revenues quite comfortably.
Discussion
The data analysis has been done with results being analysed and interpreted as per the
output gained by the SPSS tool. It shows that by making good investment in employees, firm can
increase its productivity, retain skilful employees, reduce employee turnover and as a result,
attain higher quantum of revenues (Ibrahim & Jebur, 2019). The job satisfaction is maximised
when employee seeks that firm is investing in his/her welfare for better growth. They become
committed to their work and thus, performance increases and company’s revenue soars high.
Moreover, they become loyal to company and they are motivated to perform even better out of
their potentials (Knox, 2018).
In addition to this, data analysis and results provide clarity that H1 is accepted as there is
a positive relationship between revenue of Mahindra & Mahindra and employee benefit
expenses. As per the annual report, company is constantly incurring higher expenses on
employees and simultaneously, revenue is maximising at great extent. The value of correlation is
0.772 which highlights positive relation between them. Thus, it shows that investing on
employees will surely reap higher financial performance for firm.
CONCLUSION AND RECOMMENDATIONS
Conclusion
Hereby it can be concluded that incurring expenses on employees leads to attainment of
higher financial performance of company quite effectively. Employees are main and integral part
of every organization and without providing benefits and related programs for them, they will
not get satisfied. If they are unsatisfied, they will leave jobs. It then results into decreased
productivity and as a result, revenue and overall performance is decreased. By increasing
employee benefit expense, Mahindra & Mahindra can effectively maximise its revenue and
become leader in the market. This will also help to lower employee turnover and thus, employees
can be retained as well.
9
⊘ This is a preview!⊘
Do you want full access?
Subscribe today to unlock all pages.
Trusted by 1+ million students worldwide
1 out of 20
Related Documents


Your All-in-One AI-Powered Toolkit for Academic Success.
+13062052269
info@desklib.com
Available 24*7 on WhatsApp / Email
![[object Object]](/_next/static/media/star-bottom.7253800d.svg)
Unlock your academic potential
Copyright © 2020–2026 A2Z Services. All Rights Reserved. Developed and managed by ZUCOL.